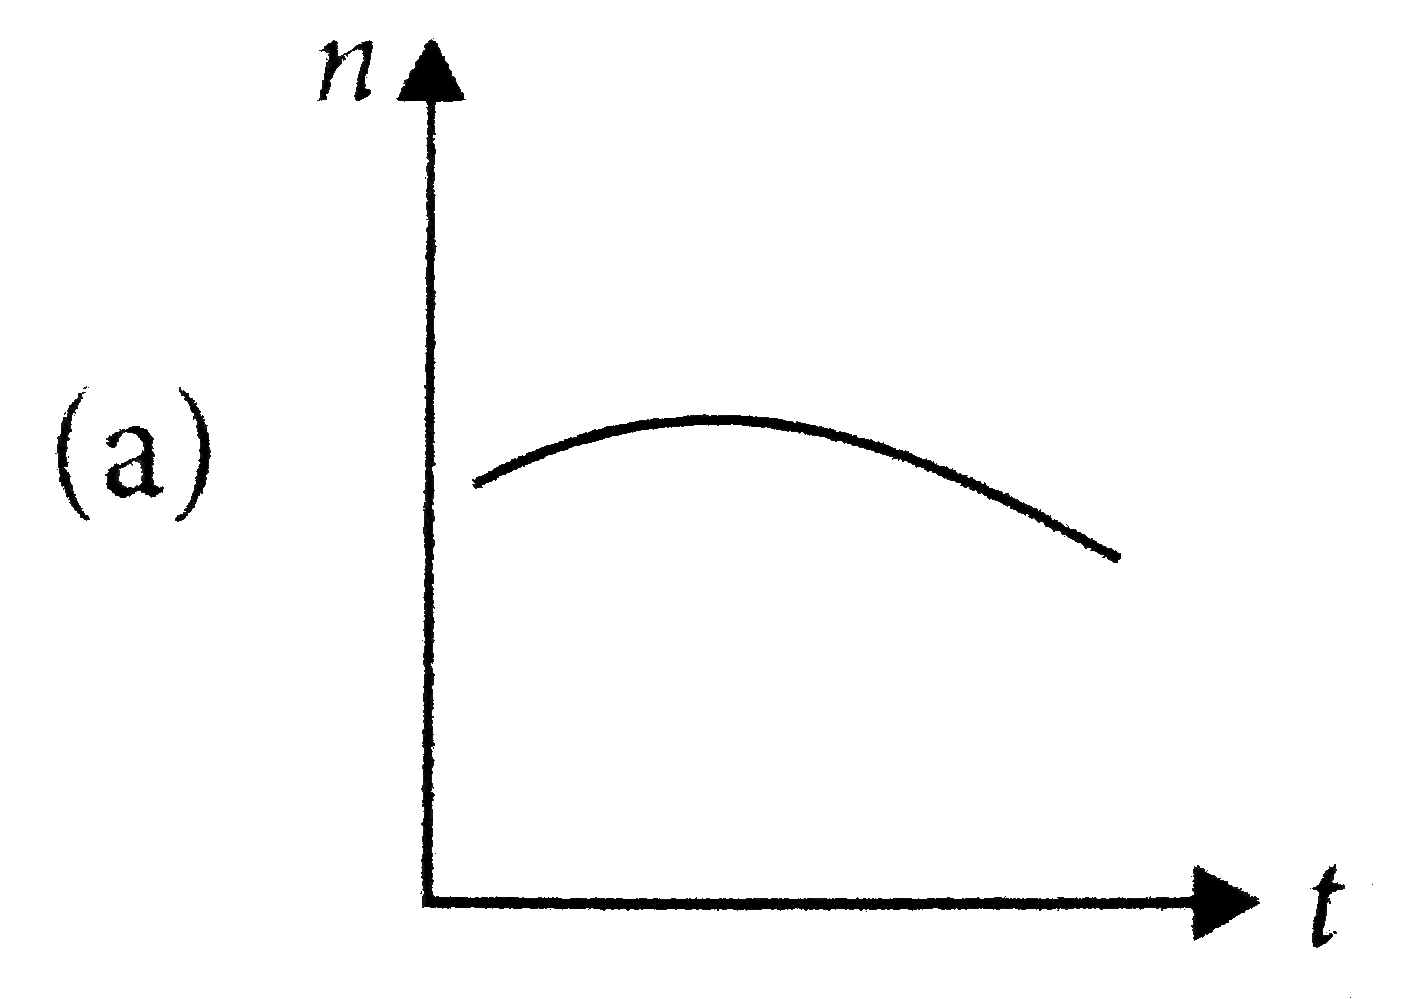
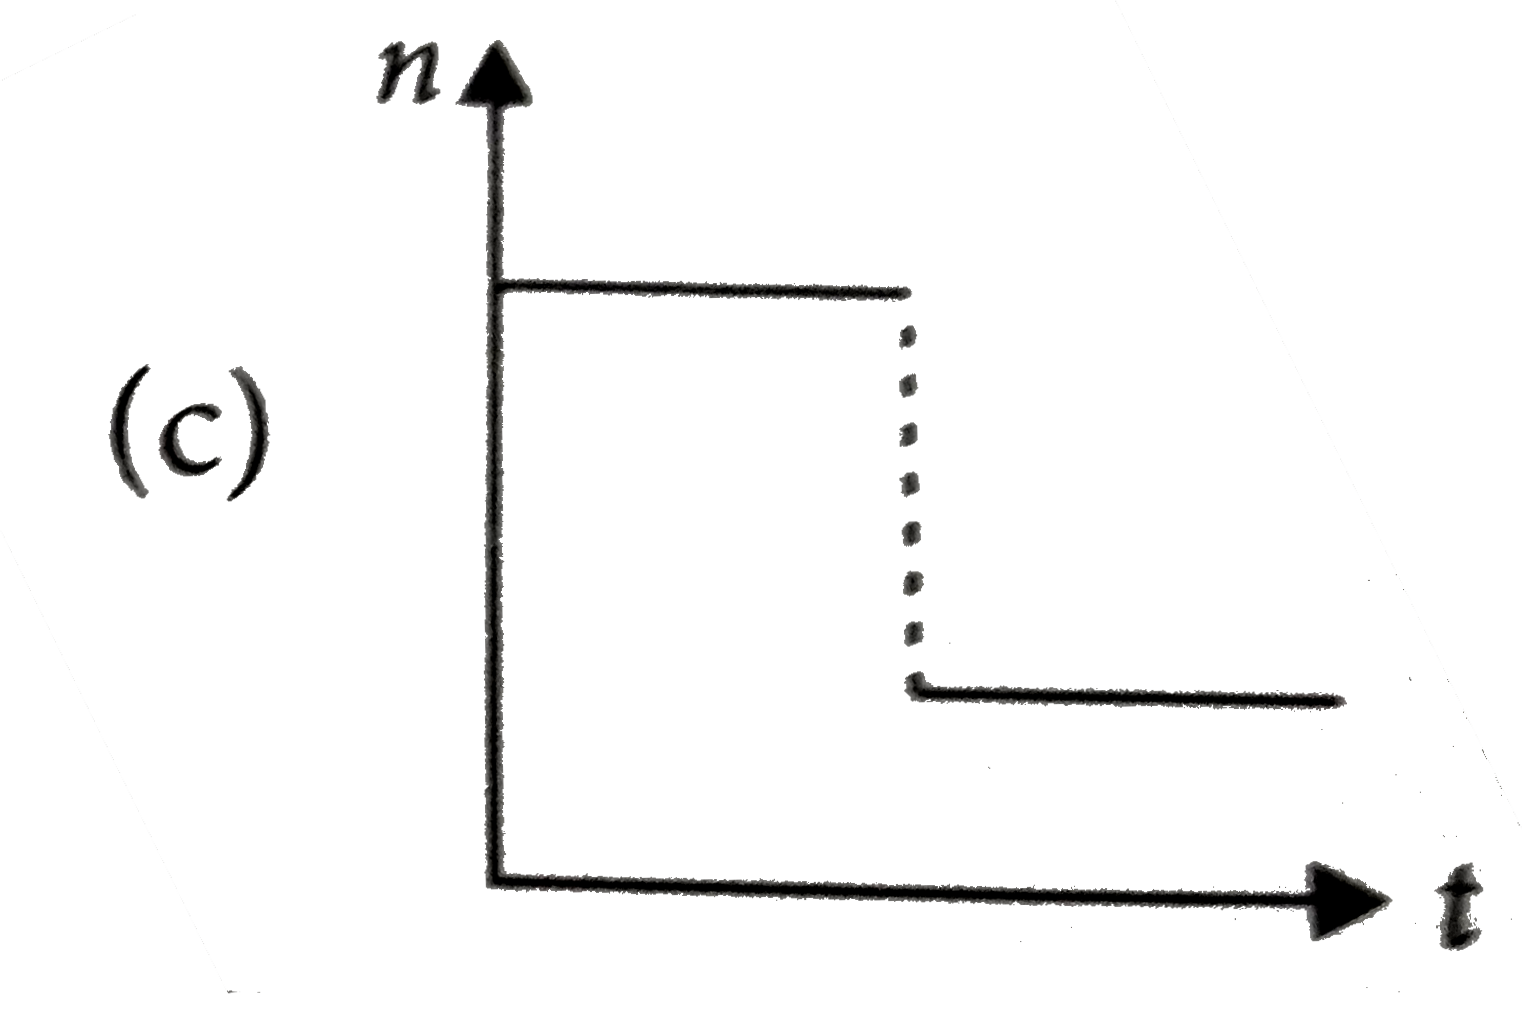
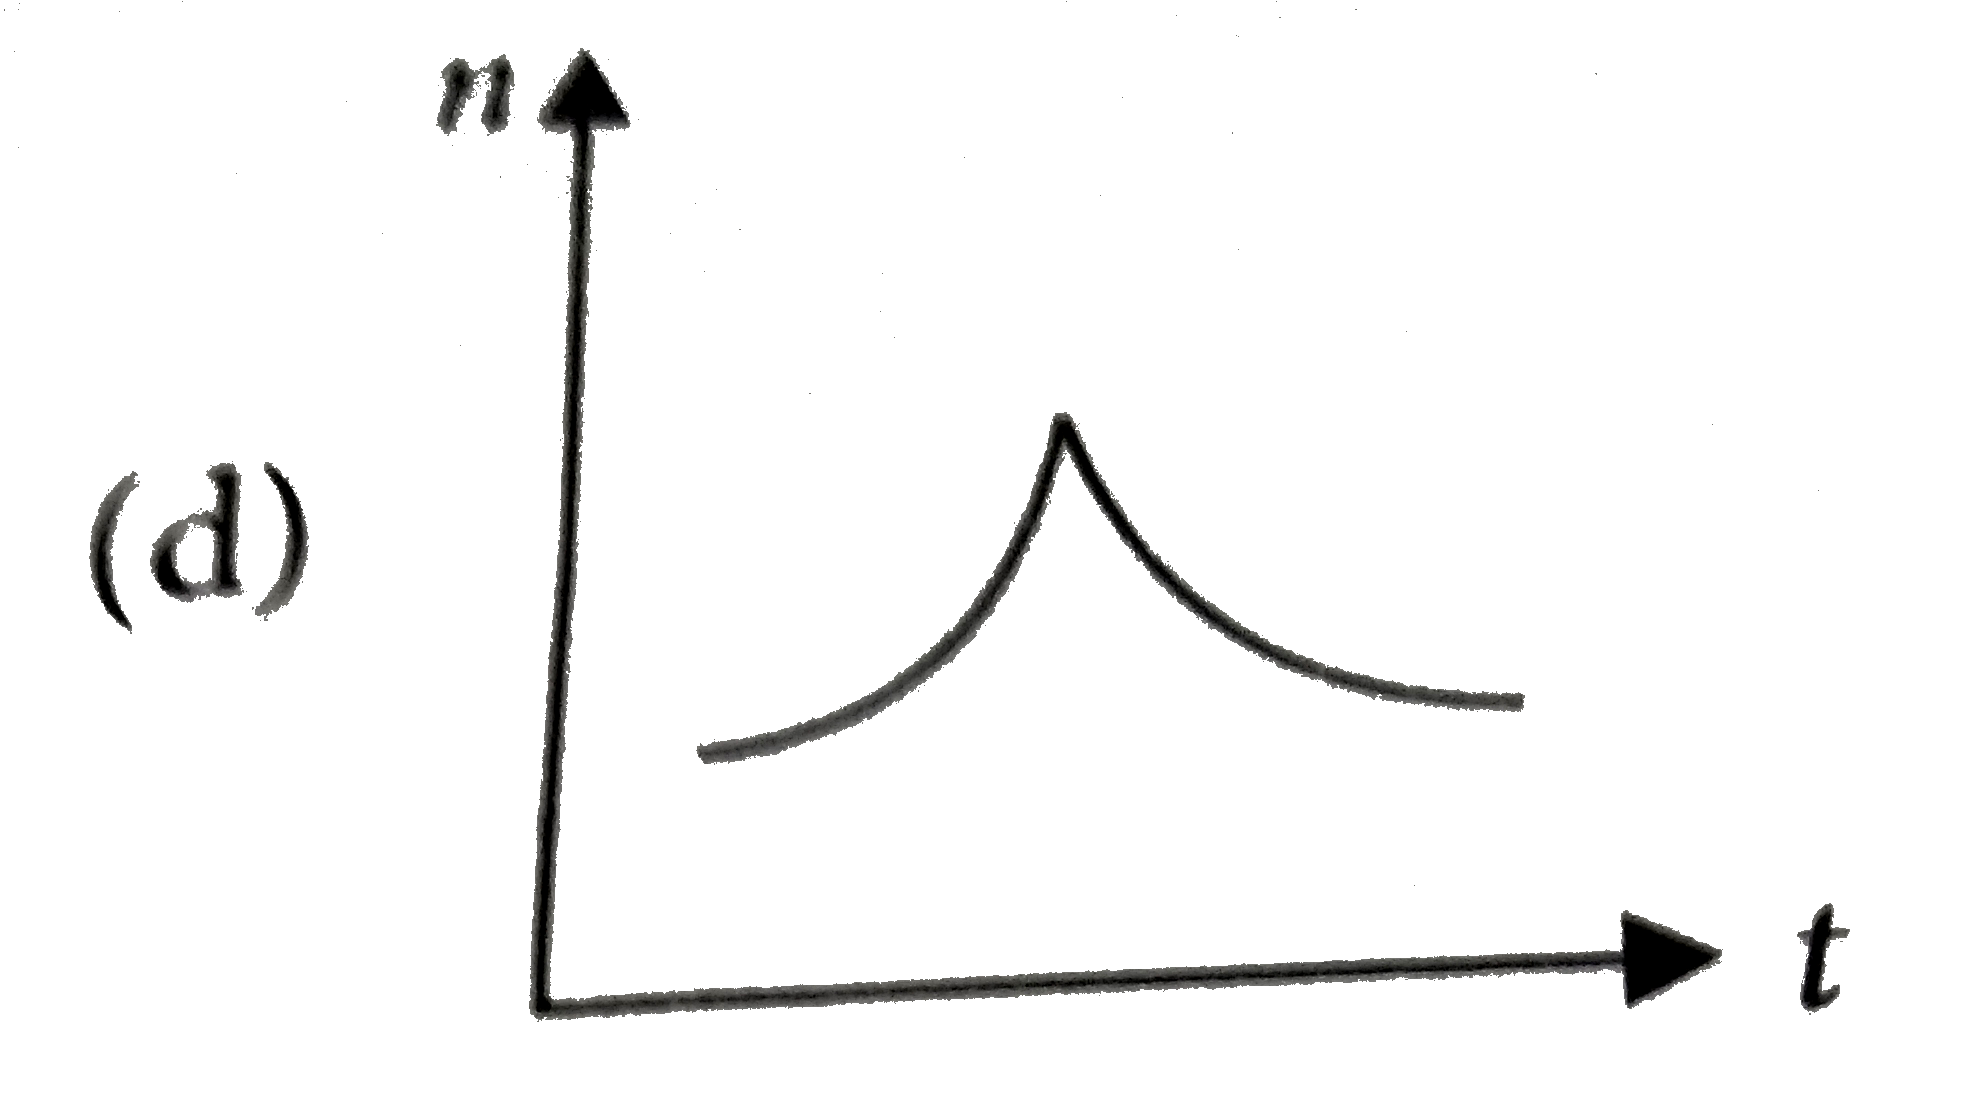
A train whistling at constant frequency is moving towards a station at a constant speed V. The train goes past a stationary observer on the station. The frequency n′ of the sound as heard by the observer is plotted as a function of time t, figure. Identify the expected curve.


The correct Answer is:C
To solve the problem of identifying the expected curve of the frequency of sound as heard by a stationary observer when a train is whistling and moving towards and then away from the observer, we can follow these steps:
1. Understand the Scenario:
- A train is moving towards a stationary observer at a constant speed V.
- The train emits sound at a constant frequency ν.
- We need to analyze how the frequency of the sound changes as the train approaches and then moves away from the observer.
2. Use the Doppler Effect Formula:
- When the source of sound (the train) is moving towards a stationary observer, the apparent frequency ν′ can be calculated using the formula:
ν′=v+vov−vsν
- Here, v is the speed of sound, vo is the speed of the observer (which is 0 since the observer is stationary), and vs is the speed of the source (the train).
3. Calculate Apparent Frequency When Approaching:
- When the train is approaching, we have:
ν′=v+0v−Vν=vv−Vν
- This frequency increases as the train gets closer to the observer.
4. Calculate Apparent Frequency When Moving Away:
- After the train passes the observer and starts moving away, the apparent frequency becomes:
ν′=v+0v+Vν=vv+Vν
- This frequency decreases as the train moves away from the observer.
5. Graph the Frequency vs. Time:
- Initially, as the train approaches, the frequency heard by the observer increases.
- At the moment the train passes the observer, the frequency reaches a maximum.
- After passing, the frequency decreases as the train moves away.
- Therefore, the graph of frequency ν′ as a function of time t will show an increase to a peak and then a decrease, resembling a curve that rises and then falls.
6. Identify the Correct Curve:
- The expected curve will show a sharp increase in frequency as the train approaches, peaking when the train is closest, and then a sharp decrease as the train moves away.
- The graph will not be linear; it will have a distinct peak.
Conclusion
The expected curve of the frequency ν′ as a function of time t will resemble a peak, with frequency increasing as the train approaches and decreasing after it passes.
- A train is moving towards a stationary observer at a constant speed V.
- The train emits sound at a constant frequency ν.
- We need to analyze how the frequency of the sound changes as the train approaches and then moves away from the observer.
- When the source of sound (the train) is moving towards a stationary observer, the apparent frequency ν′ can be calculated using the formula:
ν′=v+vov−vsν
- Here, v is the speed of sound, vo is the speed of the observer (which is 0 since the observer is stationary), and vs is the speed of the source (the train).
- When the train is approaching, we have:
ν′=v+0v−Vν=vv−Vν
- This frequency increases as the train gets closer to the observer.
- After the train passes the observer and starts moving away, the apparent frequency becomes:
ν′=v+0v+Vν=vv+Vν
- This frequency decreases as the train moves away from the observer.
- Initially, as the train approaches, the frequency heard by the observer increases.
- At the moment the train passes the observer, the frequency reaches a maximum.
- After passing, the frequency decreases as the train moves away.
- Therefore, the graph of frequency ν′ as a function of time t will show an increase to a peak and then a decrease, resembling a curve that rises and then falls.
- The expected curve will show a sharp increase in frequency as the train approaches, peaking when the train is closest, and then a sharp decrease as the train moves away.
- The graph will not be linear; it will have a distinct peak.
The expected curve of the frequency ν′ as a function of time t will resemble a peak, with frequency increasing as the train approaches and decreasing after it passes.
Topper's Solved these Questions
- WAVESBOOK - NCERT FINGERTPS ENGLISHCHAPTER - WAVESEXERCISE - ASSERTION
15 Videos
- WAVESBOOK - NCERT FINGERTPS ENGLISHCHAPTER - WAVESEXERCISE - Introduction
2 Videos
- WAVESBOOK - NCERT FINGERTPS ENGLISHCHAPTER - WAVESEXERCISE - HOTS
8 Videos
- UNITS AND MEASUREMENTSBOOK - NCERT FINGERTPS ENGLISHCHAPTER - UNITS AND MEASUREMENTSEXERCISE - Assertion And Reason
15 Videos
- WORK , ENERGY AND POWERBOOK - NCERT FINGERTPS ENGLISHCHAPTER - WORK , ENERGY AND POWEREXERCISE - Assertion And Reason
15 Videos
Similar Questions
A train is moving towards a stationary observer. Which of the following curve best represents the frequency recived by observer f as a function of time?
View SolutionA source of sound is travelling towards a stationary observer. The frequency of sound heard by the observer is 25% more that the actual frequency. If the speed of sound is v, that of the source is
View Solution
Knowledge Check
A train standing at the outer signal of a railway station blows a whistle of frequency 400 Hz in still air. The train begins to move with a speed of 30 ms−1 towards the platform. The frequency of the sound heard by an observer standing on the platform is
(Speed of sound in air = 330 m s−1)A420 HzB430 HzC440 HzD450 HzA sound source is moving towards a stationary observer with 1/10 of the speed of sound. The ratio of apparent to real frequency is
A109B(109)2C(1110)2D1110
A source of sound emitting a note of constant frequency is moving towards a stationary listener and then recedes from the listener with constant velocity maintained throughout the motion. The frequency heard by the listener (f). when plotted against time (t) will give the following curve(s).
View Solutiona bus is moving towards and stationary observer with speed 20 m/s blows a horn of frequency 200 Hz. the frequency of sound heard by the observer is approximately ( take speed of sound 320 m/s)
View SolutionA train is moving with a constant speed along a circular track. The engine of the train emits a sound of frequency f. The frequency heard by the guard at the rear end of the train.
View SolutionThe engine of a train sound a whistle at frequency v, the frequency heard by a passenger is
View SolutionThe engine of a train sound a whistle at frequency v, the frequency heard by a passenger is
View SolutionA source of frequency 'f' is stationary and an obsercer starts moving towards it at t=0 with constant small acceleration. Then the variation of observed frequency 'f' registered by the observer with time is best represented as
View Solution
