An a.c. source of variable angular frequency o is connected to an LCR series circuit. Which one of the following graphs correctly represents variation of impedance Zof a.c. circuit with angular frequency ω?
A

B

C

D

Text Solution
The correct Answer is:D
Variation of impedance Z=√R2+(Lω−1Cω)2 is minimum having a value Z =R when ω=1√LC
|
Updated on:21/07/2023
Topper's Solved these Questions
- BOOK - U-LIKE SERIESCHAPTER - ALTERNATING CURRENT EXERCISE - FILL IN THE BLANKS11videos
ALTERNATING CURRENT
- BOOK - U-LIKE SERIESCHAPTER - ALTERNATING CURRENT EXERCISE - TRUE OR FALSE10videos
ALTERNATING CURRENT
- BOOK - U-LIKE SERIESCHAPTER - ALTERNATING CURRENT EXERCISE - CASE BASED/SOURCE-BASED INTEGRATED QUESTIONS19videos
ALTERNATING CURRENT
- BOOK - U-LIKE SERIESCHAPTER - ATOMSEXERCISE - SELF ASSESSMENT TEST (SECTION C)2videos
ATOMS
Similar Questions
Knowledge Check
- Question 1 - Select One
An AC source of variable frequency f is connected to an LCR series circuit. Which one of the graphs in figure represents the variation of current of current I in the circuit with frequency f?
A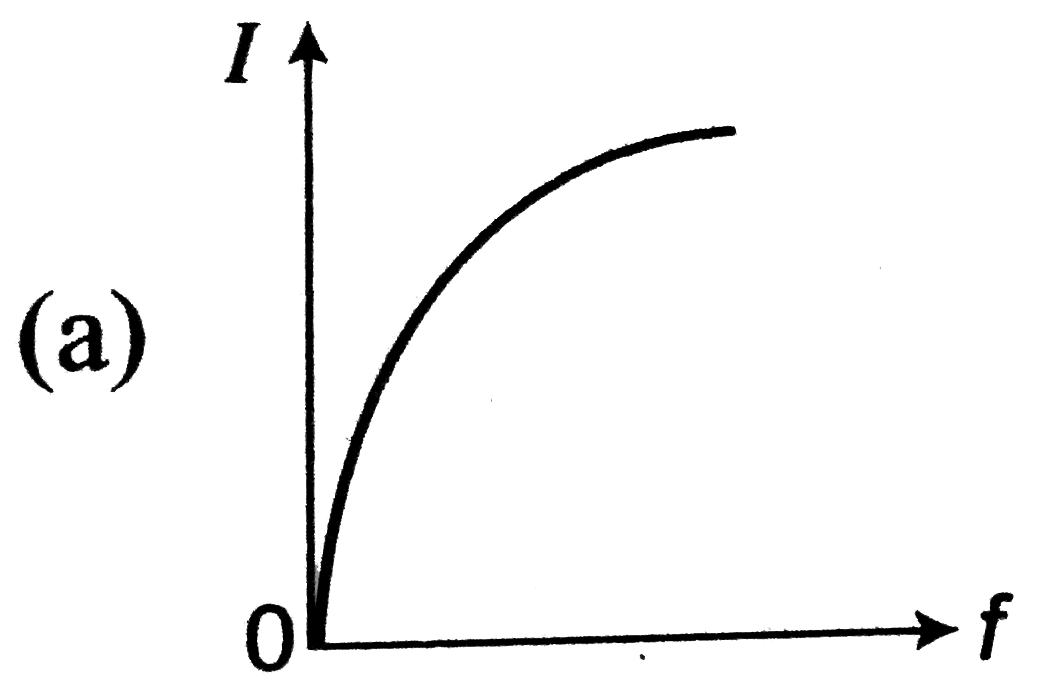 B
B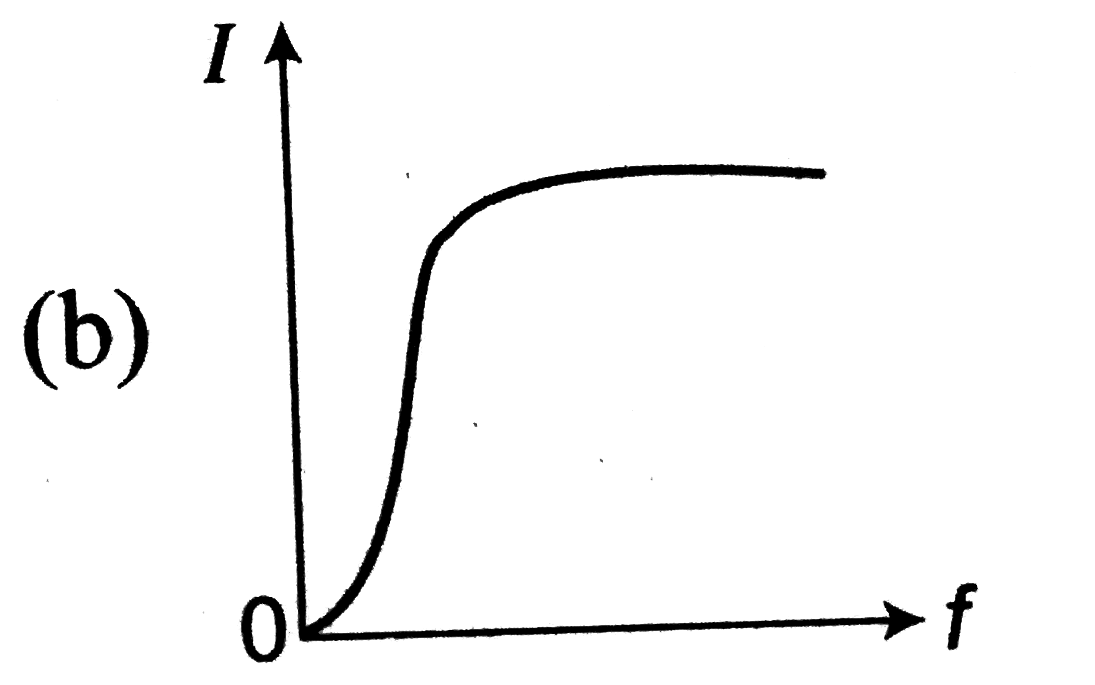 C
C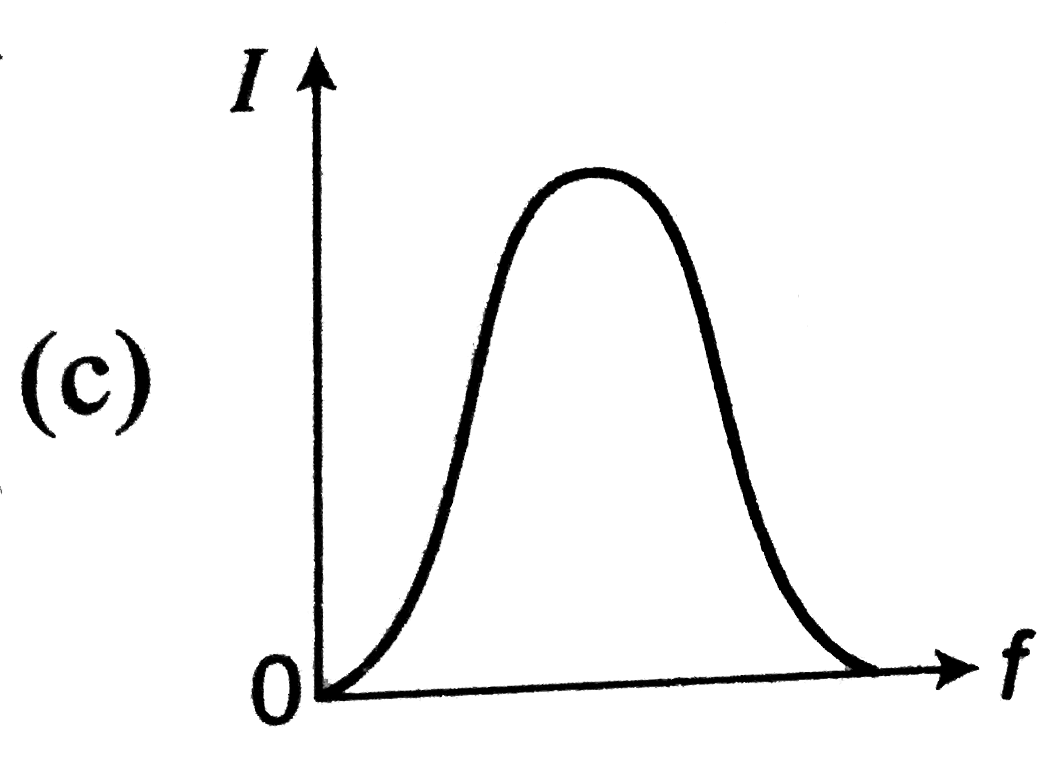 D
D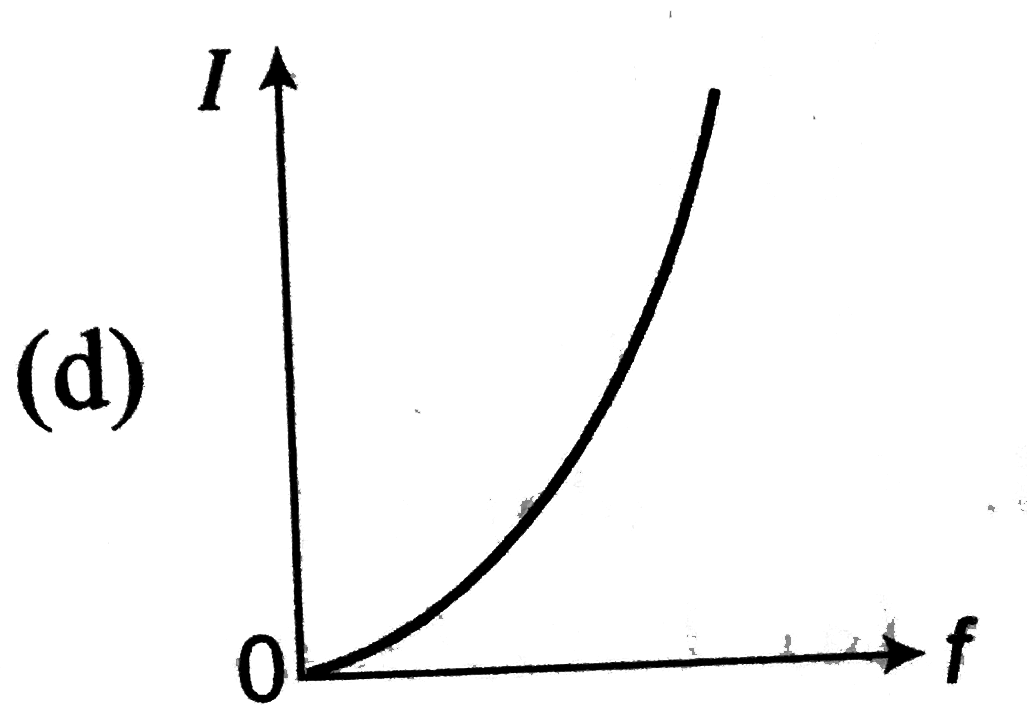
- Question 2 - Select One
Which of the following curves represents the variation of impedance (Z) with frequency f in series LCR circuit?
A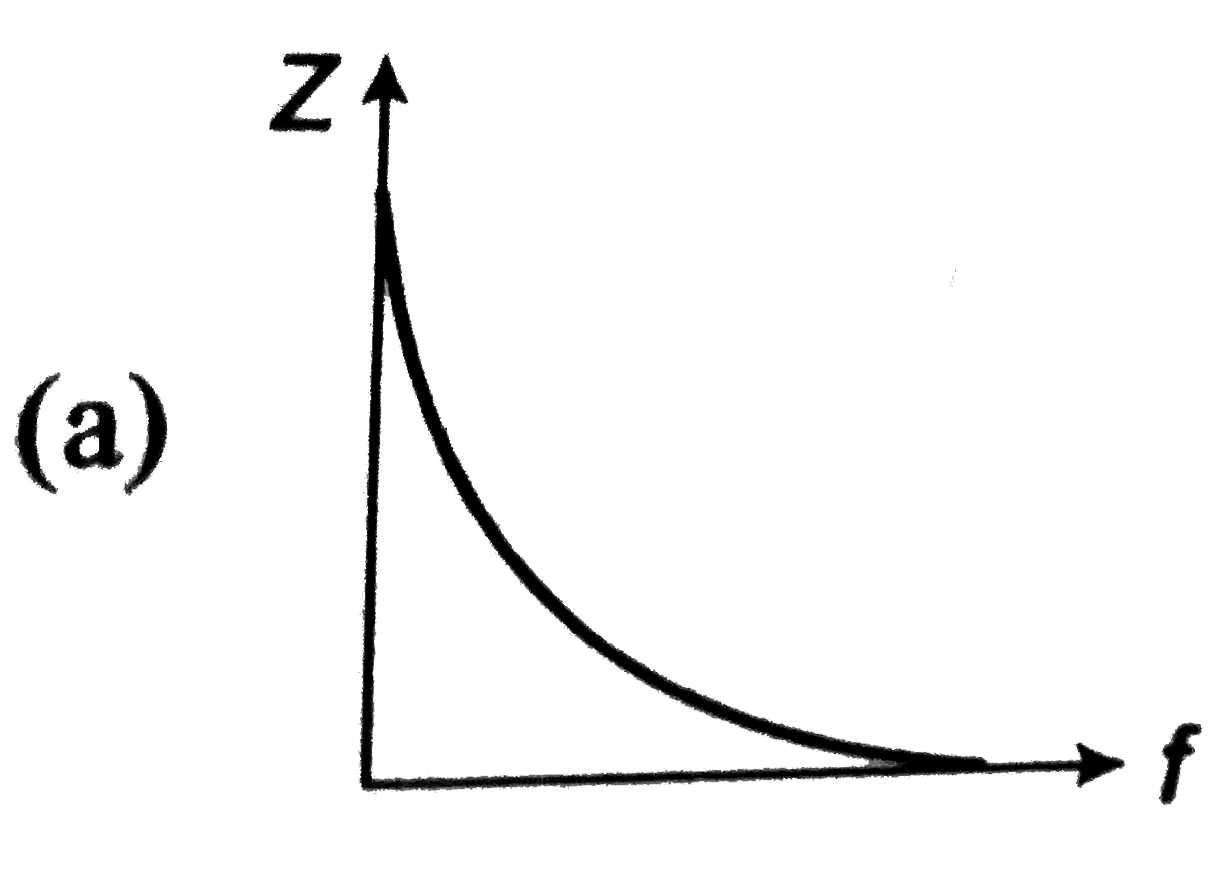 B
B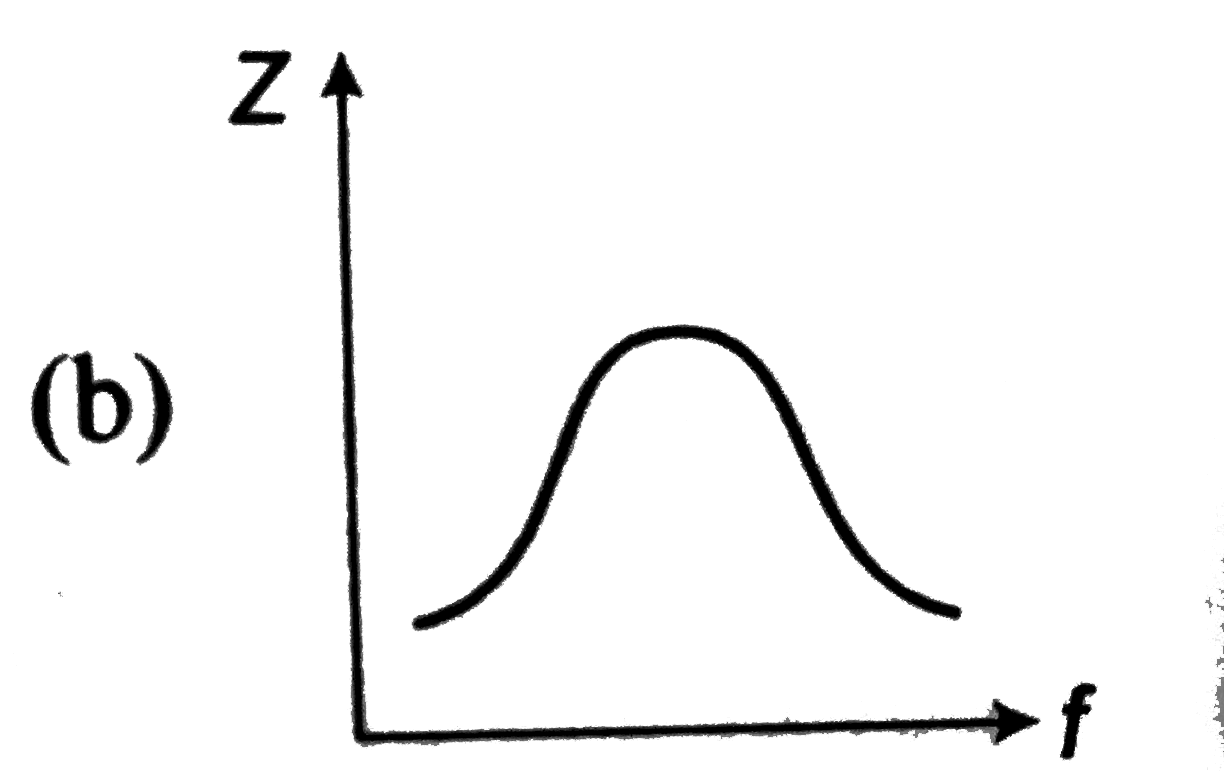 C
C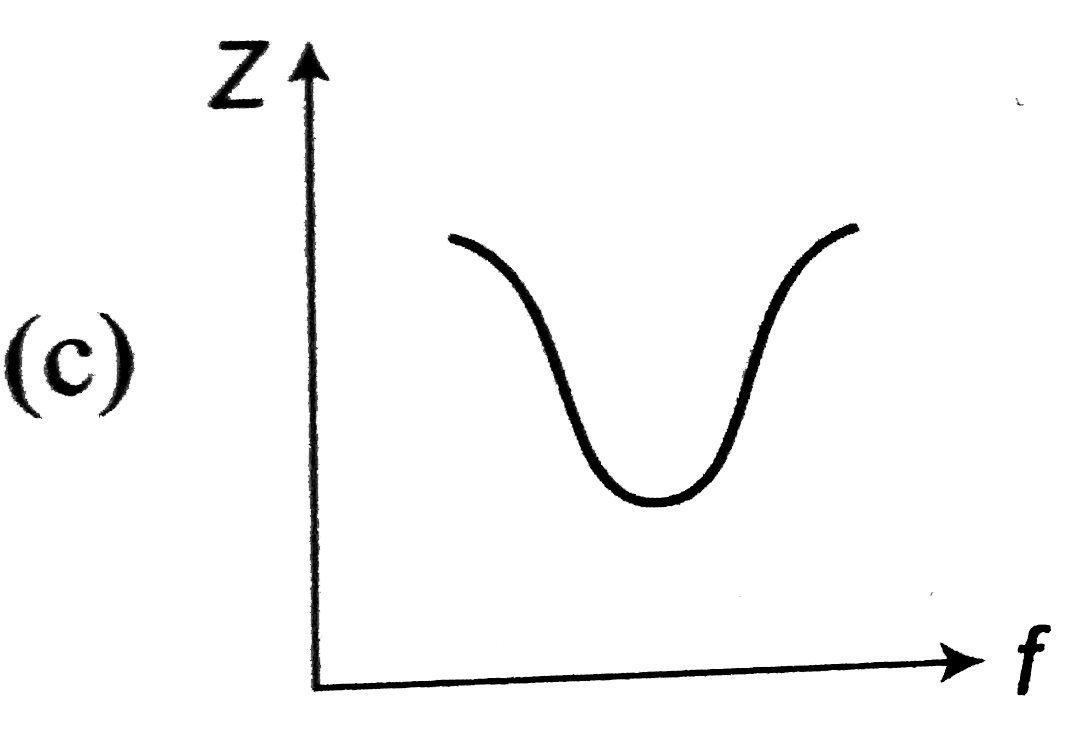 D
D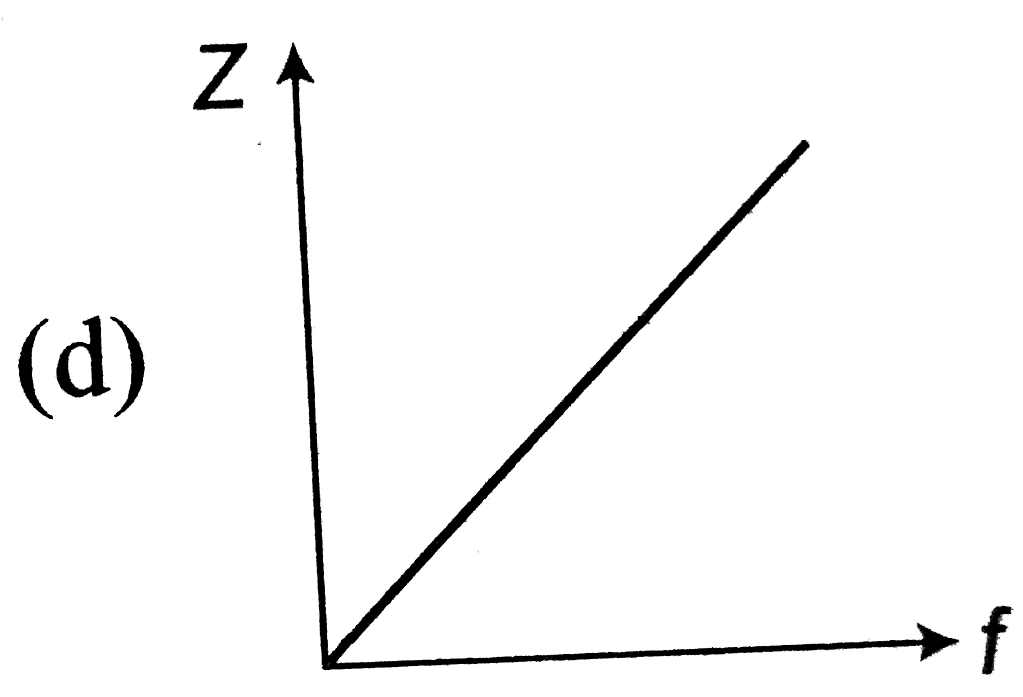
- Question 3 - Select One
When the frequency of AC is doubled, the impedance of an LCR series circuit
Ais halvedBis doubledCincreasesDdecreases
For an LCR series circuit with an ac source of angular frequency ω.
View SolutionDraw a labelled graph showing variation of impedance of a series LCR circuit with frequency of the a.c. supply.
View SolutionFor an LCR series circuit with an aac source of angular frequency ω.
View SolutionPower delivered by an ac source of angular frequency Ω0 to an LCR series circuit is maximum when .
View SolutionFor an LCR series circuit with an aac source of angular frequency ω.
View Solution
