Draw a labelled graph showing variation of impedance of a series LCR circuit with frequency of the a.c. supply.
To draw a labeled graph showing the variation of impedance (Z) of a series LCR circuit with the frequency (f) of the AC supply, follow these steps:
1. Understand the Concept: In a series LCR circuit, the impedance (Z) depends on the frequency of the AC supply. The impedance can be expressed using the formula:
Z=√R2+(XL−XC)2
where XL is the inductive reactance (XL=2πfL) and XC is the capacitive reactance (XC=12πfC).
2. Identify Key Points:
- At low frequencies, the capacitive reactance XC is high, leading to high impedance.
- As frequency increases, XL increases and XC decreases.
- At a certain frequency, known as the resonant frequency (fR), the inductive and capacitive reactances are equal (XL=XC), resulting in minimum impedance Zmin=R.
3. Draw the Axes:
- Draw a horizontal axis (x-axis) labeled as "Frequency (f)".
- Draw a vertical axis (y-axis) labeled as "Impedance (Z)".
4. Plot the Graph:
- Start from the top left of the graph where impedance is high at low frequencies.
- As frequency increases, the impedance decreases until it reaches a minimum at the resonant frequency fR.
- After fR, the impedance starts to increase again as frequency continues to rise.
- The graph should resemble a U-shape, with the lowest point at fR.
5. Label Important Points:
- Mark the minimum impedance point as Zmin=R.
- Label the resonant frequency as fR.
- Indicate that at f<fR, Z is high, and at f>fR, Z increases again.
6. Final Touches:
- Ensure all axes and points are clearly labeled.
- Optionally, you can add a curve to indicate the shape of the impedance variation.
Labeled Graph:
- The graph should show a U-shaped curve with:
- X-axis: Frequency (f)
- Y-axis: Impedance (Z)
- Minimum point labeled as Zmin=R
- Resonant frequency labeled as fR
Z=√R2+(XL−XC)2
where XL is the inductive reactance (XL=2πfL) and XC is the capacitive reactance (XC=12πfC).
- At low frequencies, the capacitive reactance XC is high, leading to high impedance.
- As frequency increases, XL increases and XC decreases.
- At a certain frequency, known as the resonant frequency (fR), the inductive and capacitive reactances are equal (XL=XC), resulting in minimum impedance Zmin=R.
- Draw a horizontal axis (x-axis) labeled as "Frequency (f)".
- Draw a vertical axis (y-axis) labeled as "Impedance (Z)".
- Start from the top left of the graph where impedance is high at low frequencies.
- As frequency increases, the impedance decreases until it reaches a minimum at the resonant frequency fR.
- After fR, the impedance starts to increase again as frequency continues to rise.
- The graph should resemble a U-shape, with the lowest point at fR.
- Mark the minimum impedance point as Zmin=R.
- Label the resonant frequency as fR.
- Indicate that at f<fR, Z is high, and at f>fR, Z increases again.
- Ensure all axes and points are clearly labeled.
- Optionally, you can add a curve to indicate the shape of the impedance variation.
- The graph should show a U-shaped curve with:
- X-axis: Frequency (f)
- Y-axis: Impedance (Z)
- Minimum point labeled as Zmin=R
- Resonant frequency labeled as fR
Similar Questions
Knowledge Check
At resonance frequency the impedance in series LCR circuit is
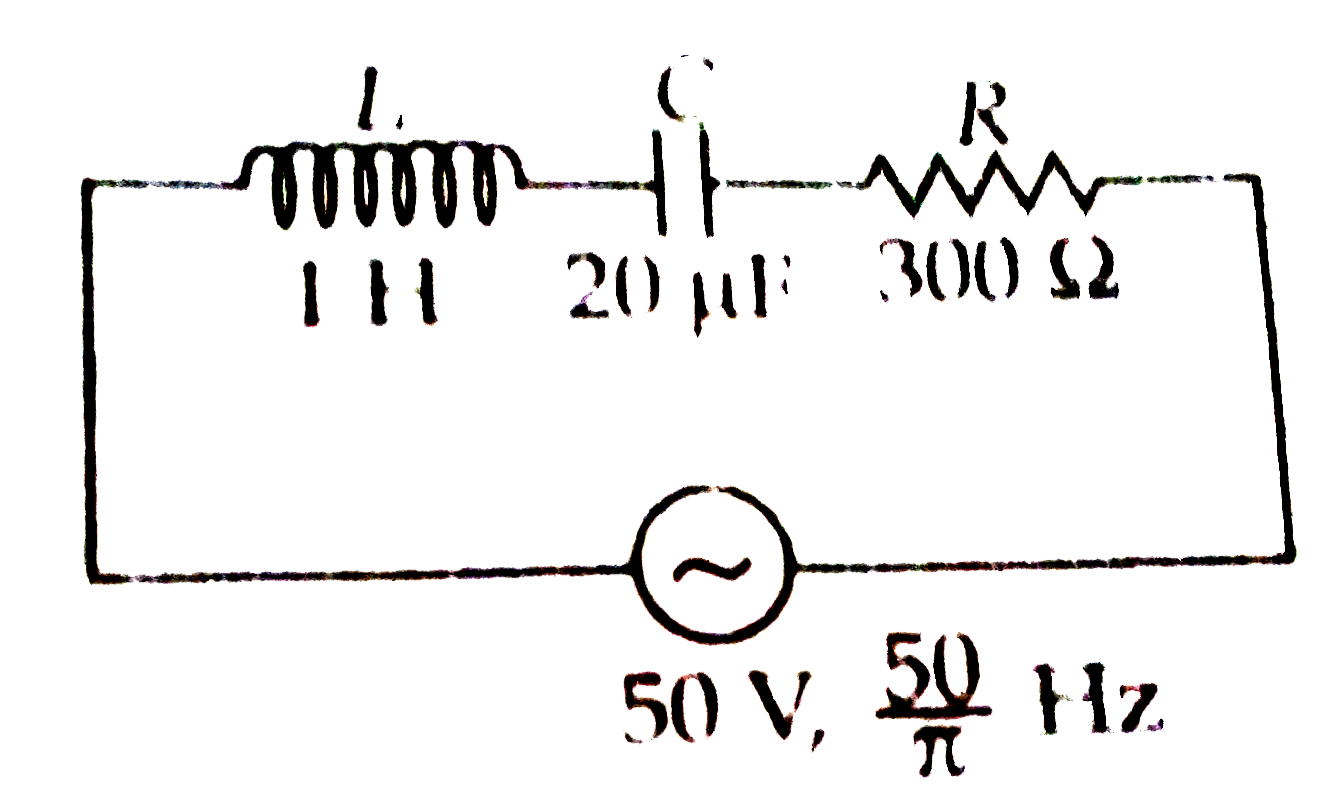
AmaximumBminimumCzeroDinfinityIn the series LCR circuit shown the impedance is
 A200ΩB100ΩC300ΩD500Ω
Draw a labelled graph showing the variation of inductive reactance (XL) verses frequency (f)
View SolutionIn the series LCR circuit shown the impedance is

View SolutionDraw a graph showing the variation of decay rate with number of active nuclei.
View SolutionWhat do you mean by the impedance of LCR-circuit
View SolutionThe figure shows the graphical variation of the reactance of a capacitor with frequency of ac source. (a) find the capacitance of the capacitor (b)an ideal inductor has the same reactance at 100 Hz frequency as the capacitor has the same frequency find the value of the inductor. (c) draw the graph showing the variation of the reactance of this inductor with frequency

View SolutionThe impedance of a series R-C, AC circuit is Z1 for frequency f and Z2 for 2f. If Z1Z2=k, then
View Solution
