Answer the following based on the diagram given below .

which of the two thermometers , T1orT2 will show at temperature of 0∘C first ?
Thermometer T2 will show temperature of 0∘C first .
Topper's Solved these Questions
- HEATBOOK - CHETAN PUBLICATIONCHAPTER - HEATEXERCISE - Paragraph Based Question .
4 Videos
- HEATBOOK - CHETAN PUBLICATIONCHAPTER - HEATEXERCISE - ASSIGNMENT - 5 (Answer the following)
3 Videos
- HEATBOOK - CHETAN PUBLICATIONCHAPTER - HEATEXERCISE - Darw a neat and labelled diagram.
4 Videos
- GRAVITATIONBOOK - CHETAN PUBLICATIONCHAPTER - GRAVITATIONEXERCISE - ASSIGNMENT-1
15 Videos
- LENSESBOOK - CHETAN PUBLICATIONCHAPTER - LENSESEXERCISE - Assignment
14 Videos
Similar Questions
Two ideal Carnot engines operate in cascade (all heat given up by one engine is used by the other engine to produce work) between temperatures, T1andT2. The temperature of the hot reservoir of the first engine is T1 and the temperature of the cold reservoir of the second engine is T2. T is temperature of the sink of first engine which is also the source for the second engine. How is T related to T1andT2, if both the engines perform equal amount of work?
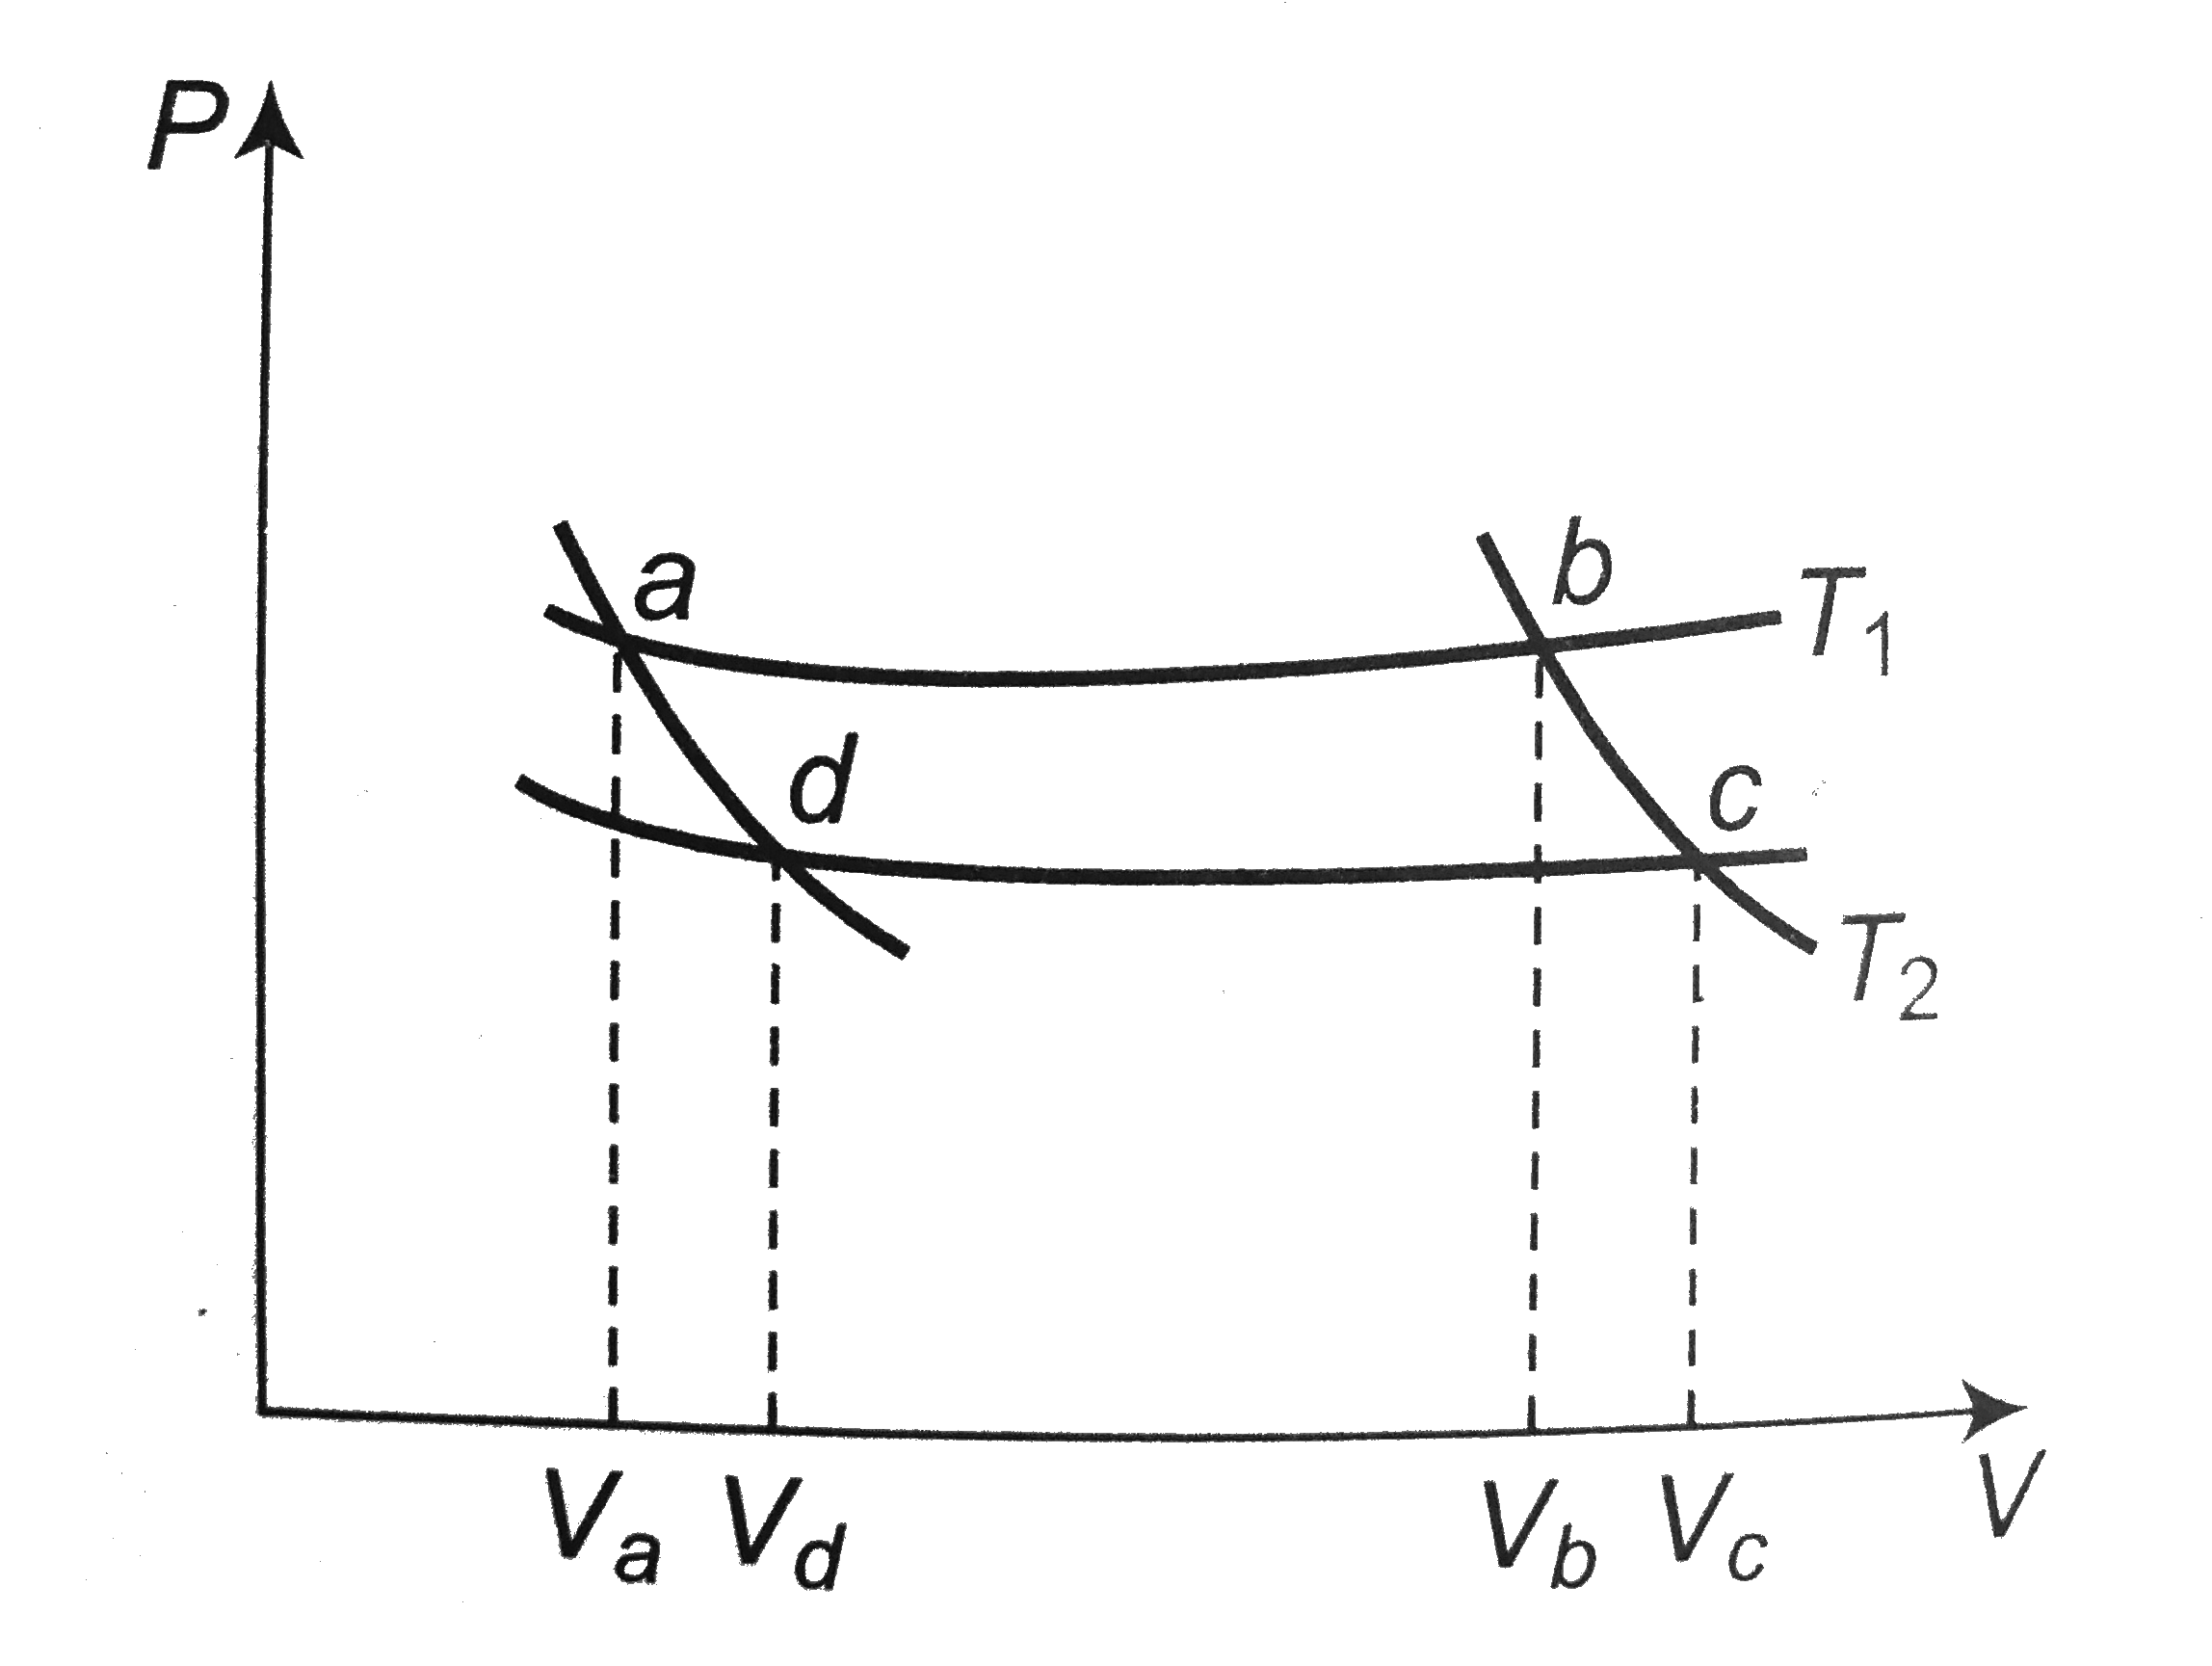
View SolutionIn the following P-V diagram two adiabatics cut two isothermals at temperature T1andT2 (fig). The value of VaVd will be

View Solution
Knowledge Check
Two ideal Carnot engines operate in cascade (all heat given up by one engine is used by the other engine to produce work) between temperatures, T1andT2. The temperature of the hot reservoir of the first engine is T1 and the temperature of the cold reservoir of the second engine is T2. T is temperature of the sink of first engine which is also the source for the second engine. How is T related to T1andT2, if both the engines perform equal amount of work?
AT=2T1T2T1+T2BT=T1+T22CT=√T1T2DT=0In the following P-V diagram two adiabatics cut two isothermals at temperature T1andT2 (fig). The value of VaVd will be
 AVbVcBVcVbCVdVaDVbVc
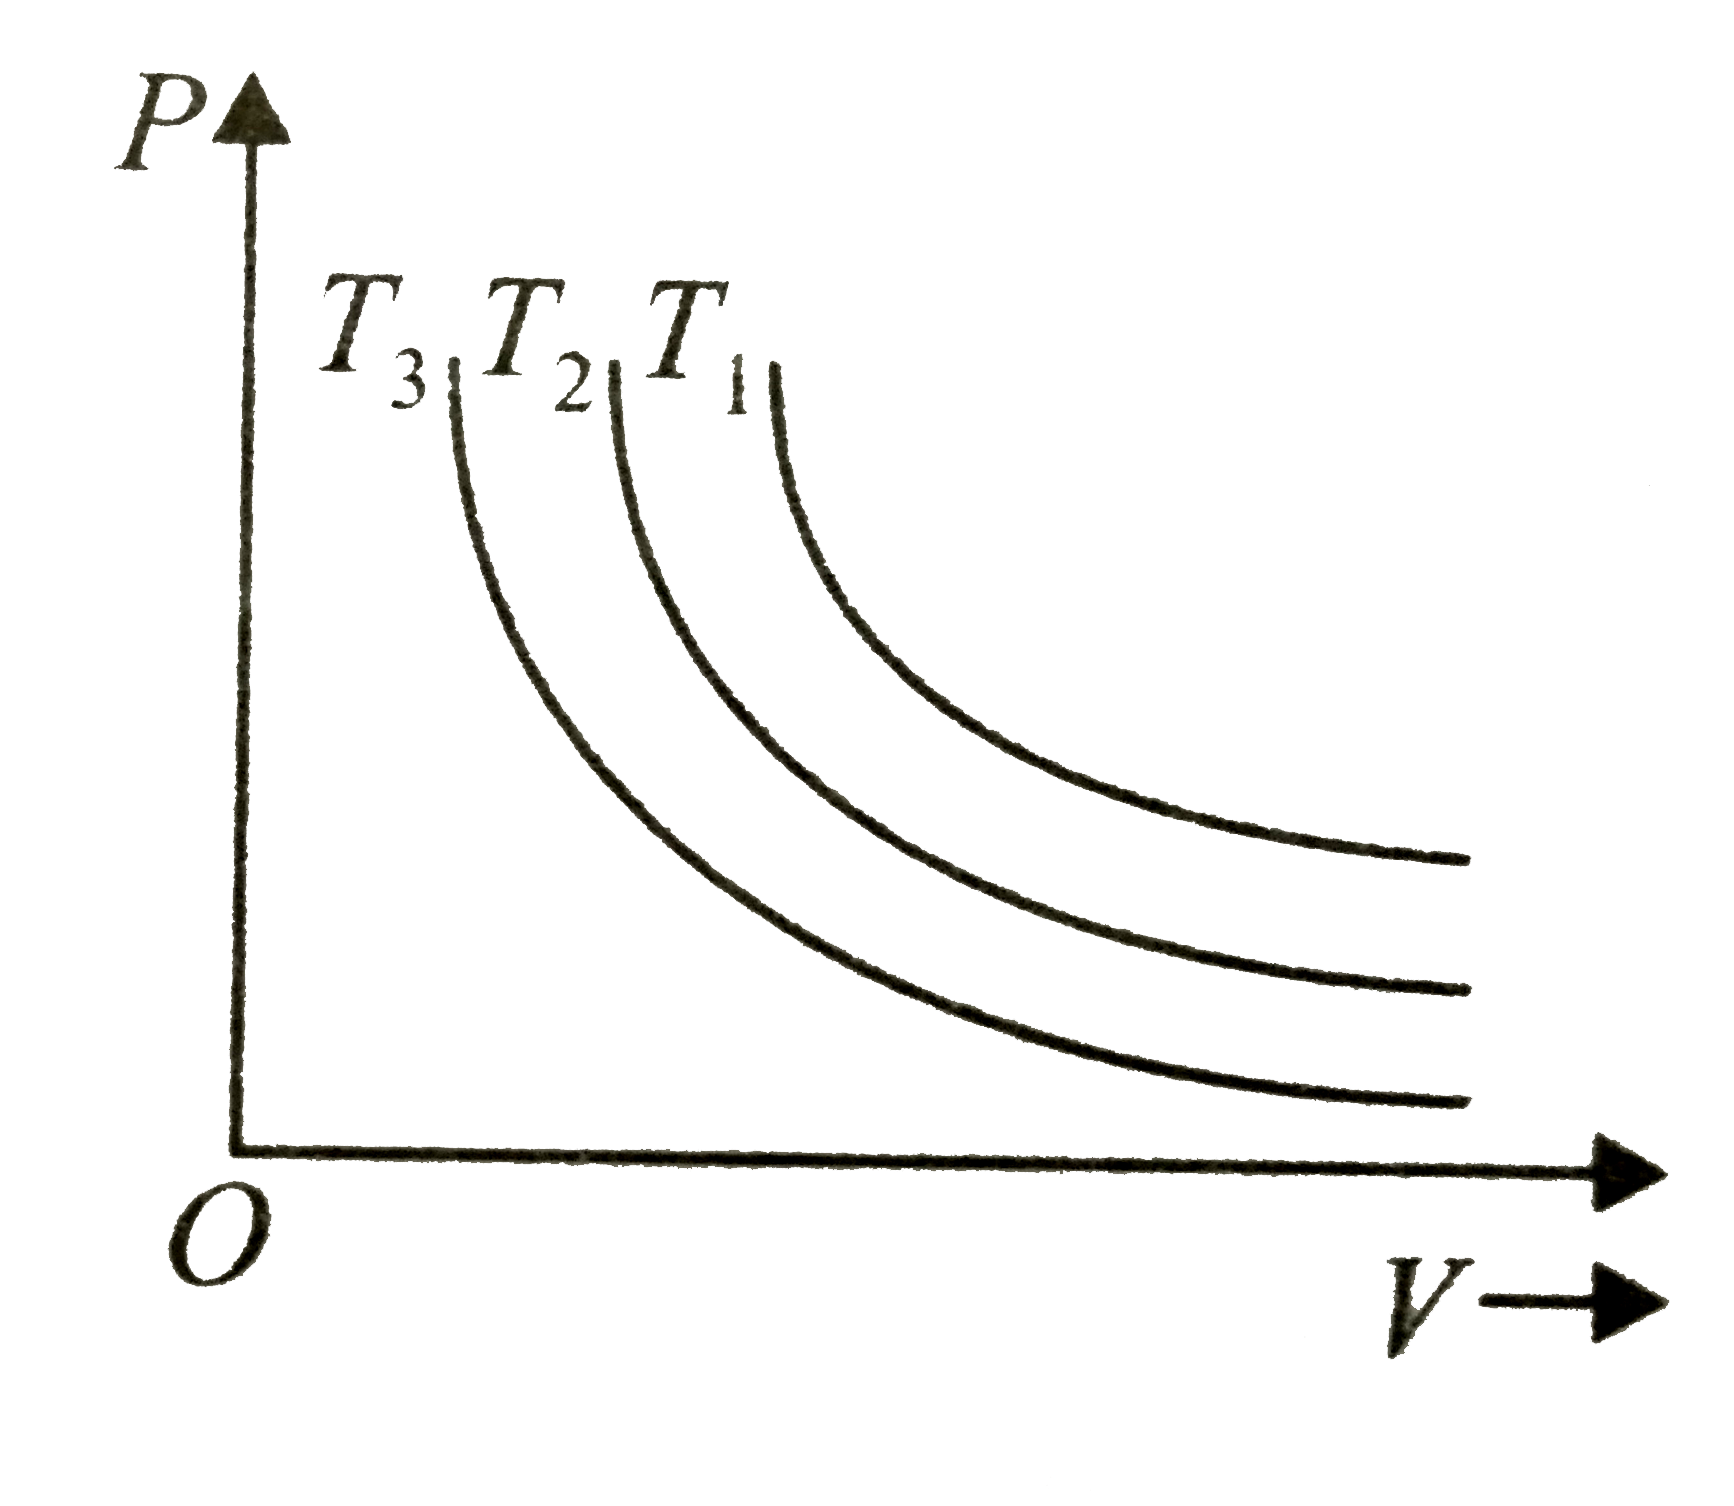
The isothermal diagram of a gas at three different temperatures T1,T2andT3, is show in the given figure .Then
 Aa.T1<T2<TBb. T1<T2>T3Cc.T1>T2>T3Dd.T1>T2<T3
The stress-strain graph for a metallic wire is shown at two different temperature, T1 and T2 which temperature is high T1 or T2 ?
View SolutionThe stress-strain graph for a metallic wire is shown at two different temperature, T1 and T2 which temperature is high T1 or T2 ?
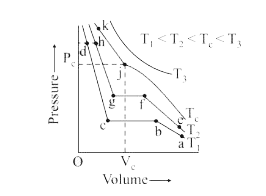
View SolutionIsotherms of carbon dioxide at various temperatures are represented in figure. Answer the following questions based on this figure.

In which state will CO2 exist between the points a and b at temperature T1 ?
View SolutionIsotherms of carbon dioxide at various temperatures are represented in figure. Answer the following questions based on this figure.

In which state will CO2 exist between the points a and b at temperature T1 ?
View SolutionThe isothermal diagram of a gas at three different temperatures T1,T2and_(3), is show in the given figure .Then

View Solution
