In the following P-V diagram two adiabatics cut two isothermals at temperature T1andT2 (fig). The value of VaVd will be
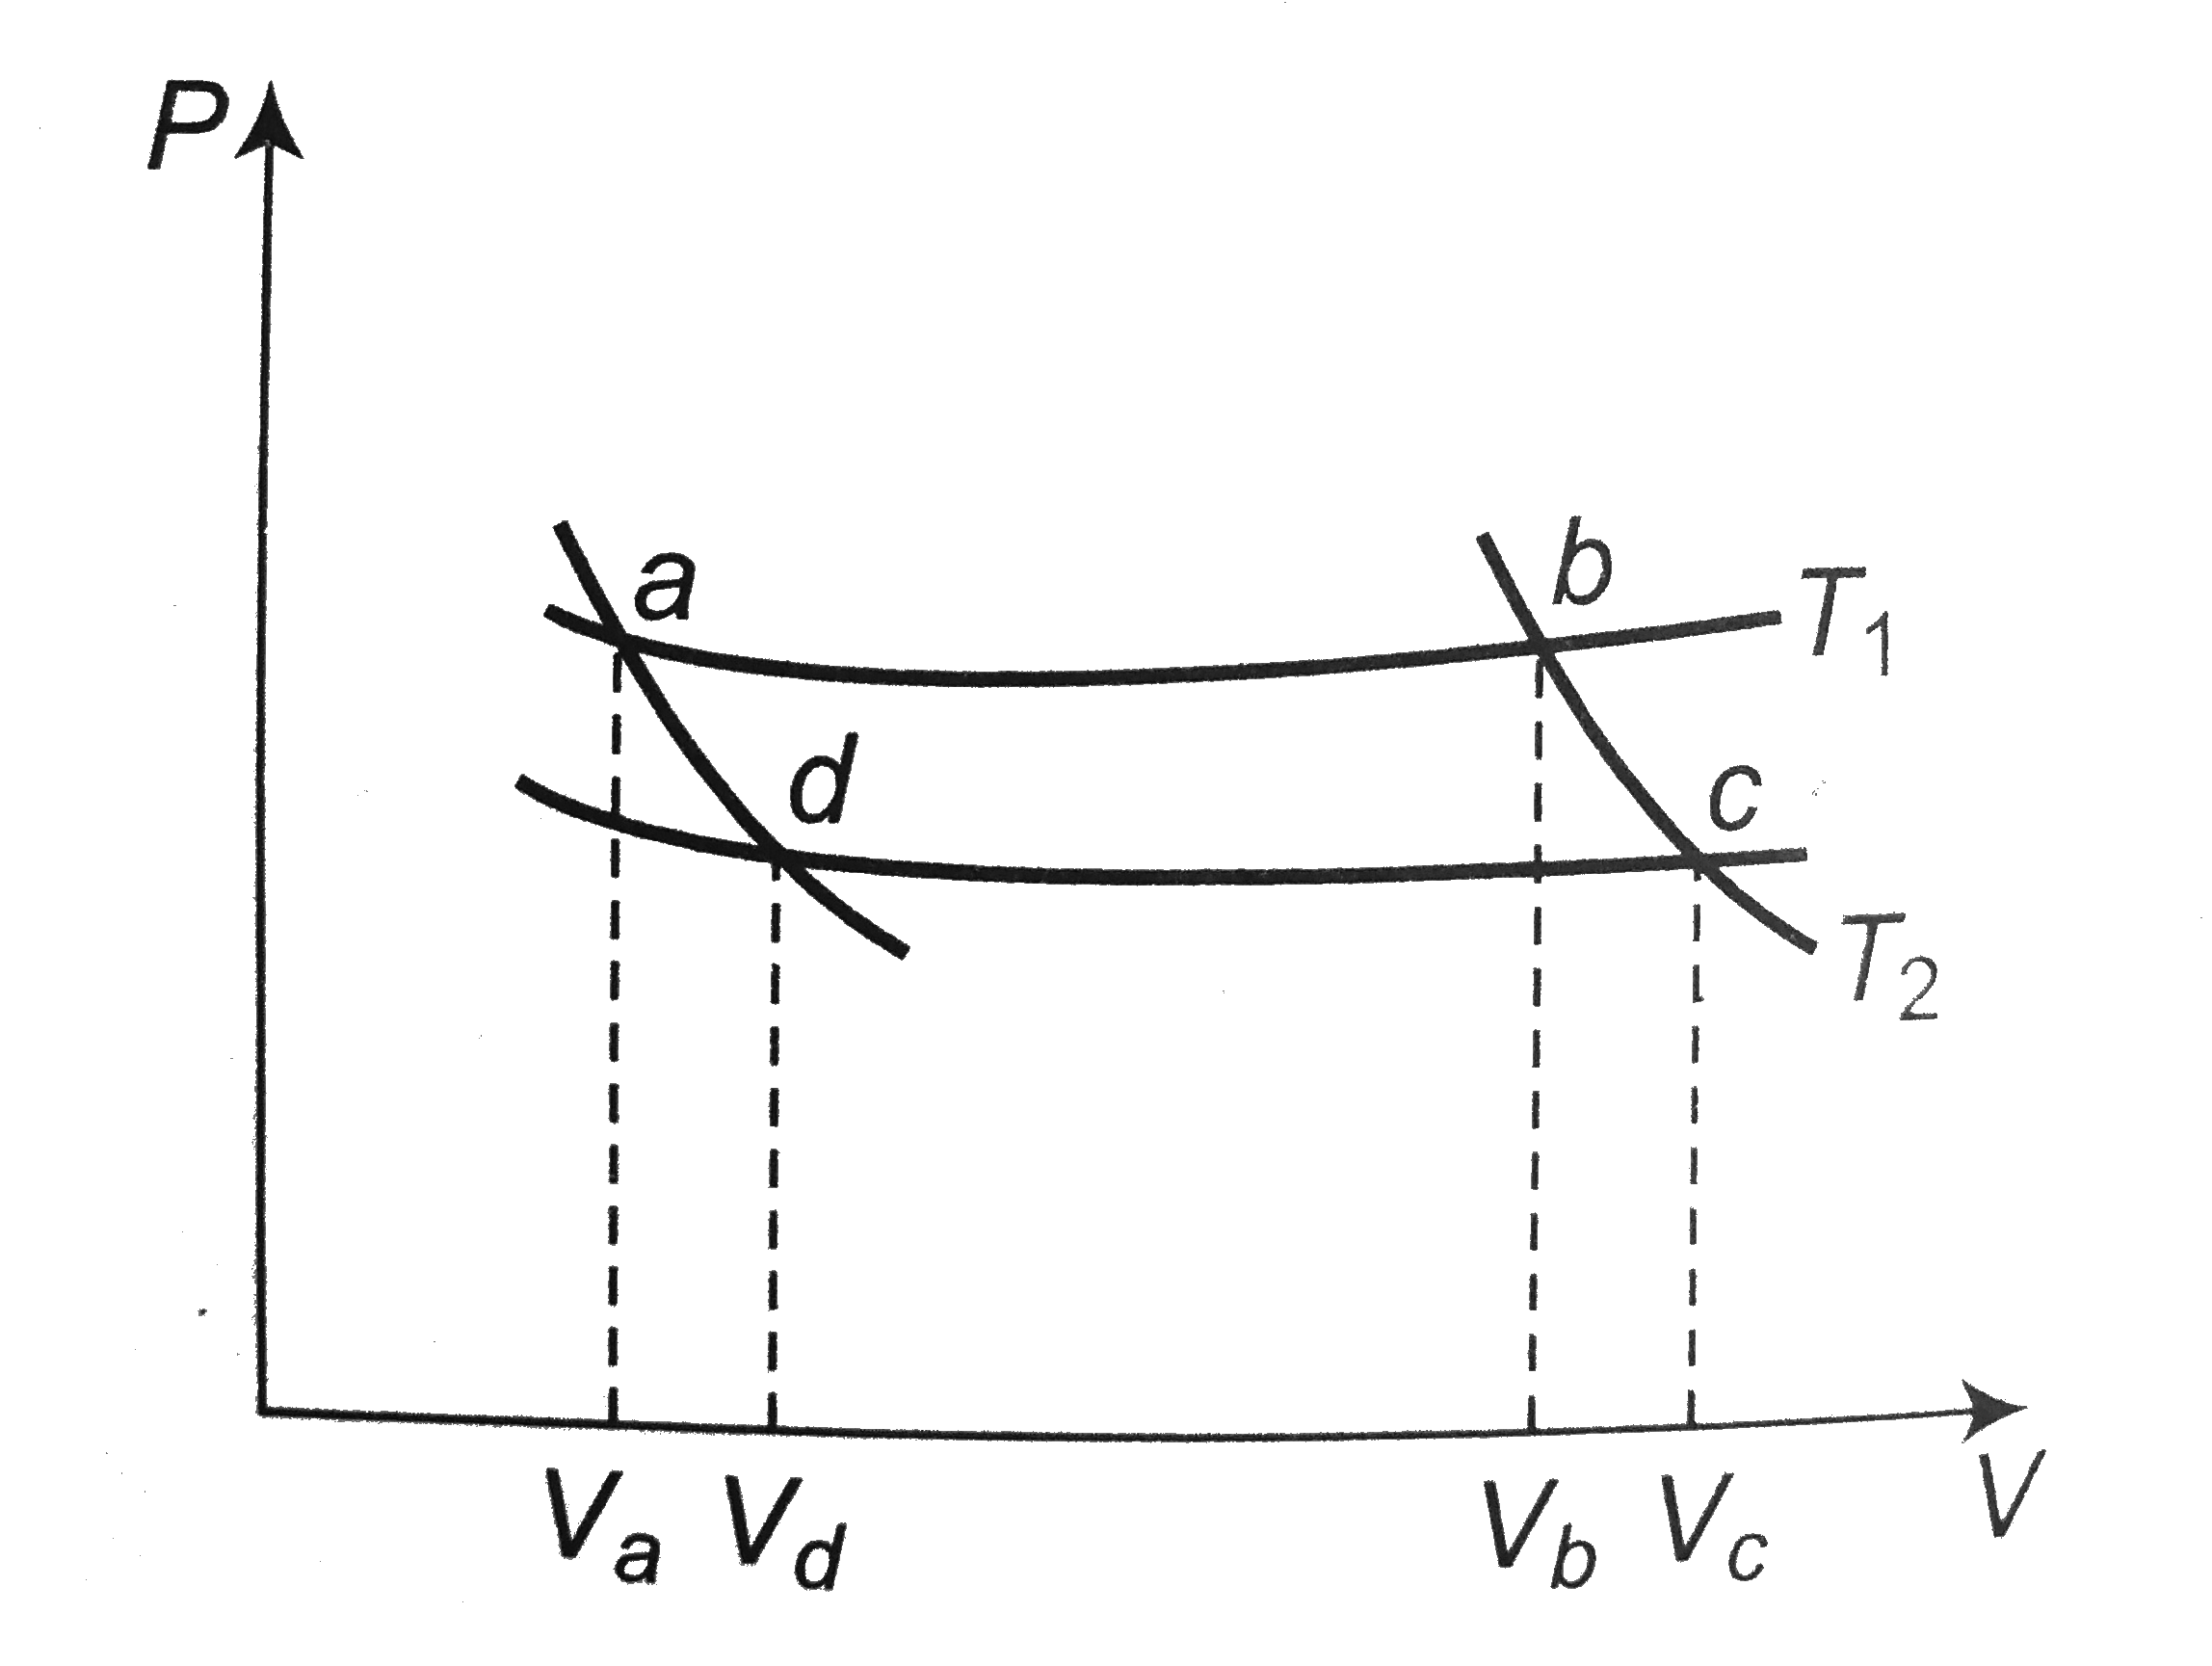
VbVc
VcVb
VdVa
VbVc
The correct Answer is:A
Step by step video & image solution for In the following P-V diagram two adiabatics cut two isothermals at temperature T_(1) and T_(2) (fig). The value of V_(a)/V_(d) will be by Physics experts to help you in doubts & scoring excellent marks in Class 11 exams.
Updated on:21/07/2023Topper's Solved these Questions
- THERMODYNAMICSBOOK - CENGAGE PHYSICS ENGLISHCHAPTER - THERMODYNAMICSEXERCISE - 8
3 Videos
- THERMODYNAMICSBOOK - CENGAGE PHYSICS ENGLISHCHAPTER - THERMODYNAMICSEXERCISE - 9
3 Videos
- THERMODYNAMICSBOOK - CENGAGE PHYSICS ENGLISHCHAPTER - THERMODYNAMICSEXERCISE - 6
3 Videos
- SUPERPOSITION AND STANDING WAVESBOOK - CENGAGE PHYSICS ENGLISHCHAPTER - SUPERPOSITION AND STANDING WAVESEXERCISE - Comprehension Type
5 Videos
- TRANSMISSION OF HEATBOOK - CENGAGE PHYSICS ENGLISHCHAPTER - TRANSMISSION OF HEATEXERCISE - Single correct
9 Videos
Similar Questions
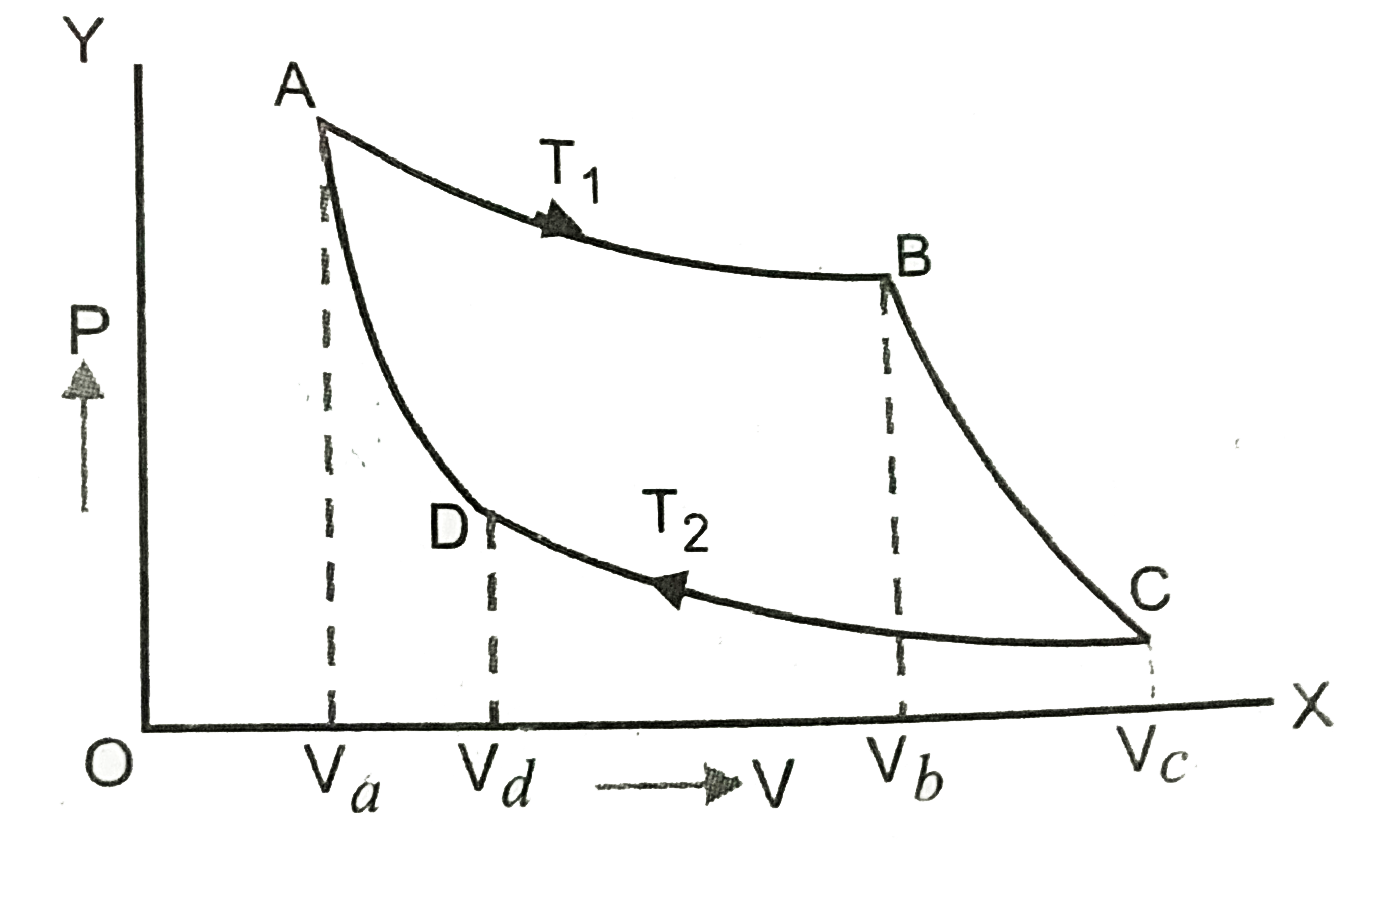
Two different adiabatic curves for the same gas intersect two isothermals at T1,andT2 as shown in P−V diagram, (figure). How does the ratio (Va/Vd) compare with the ratio (Vb/Vc) ?
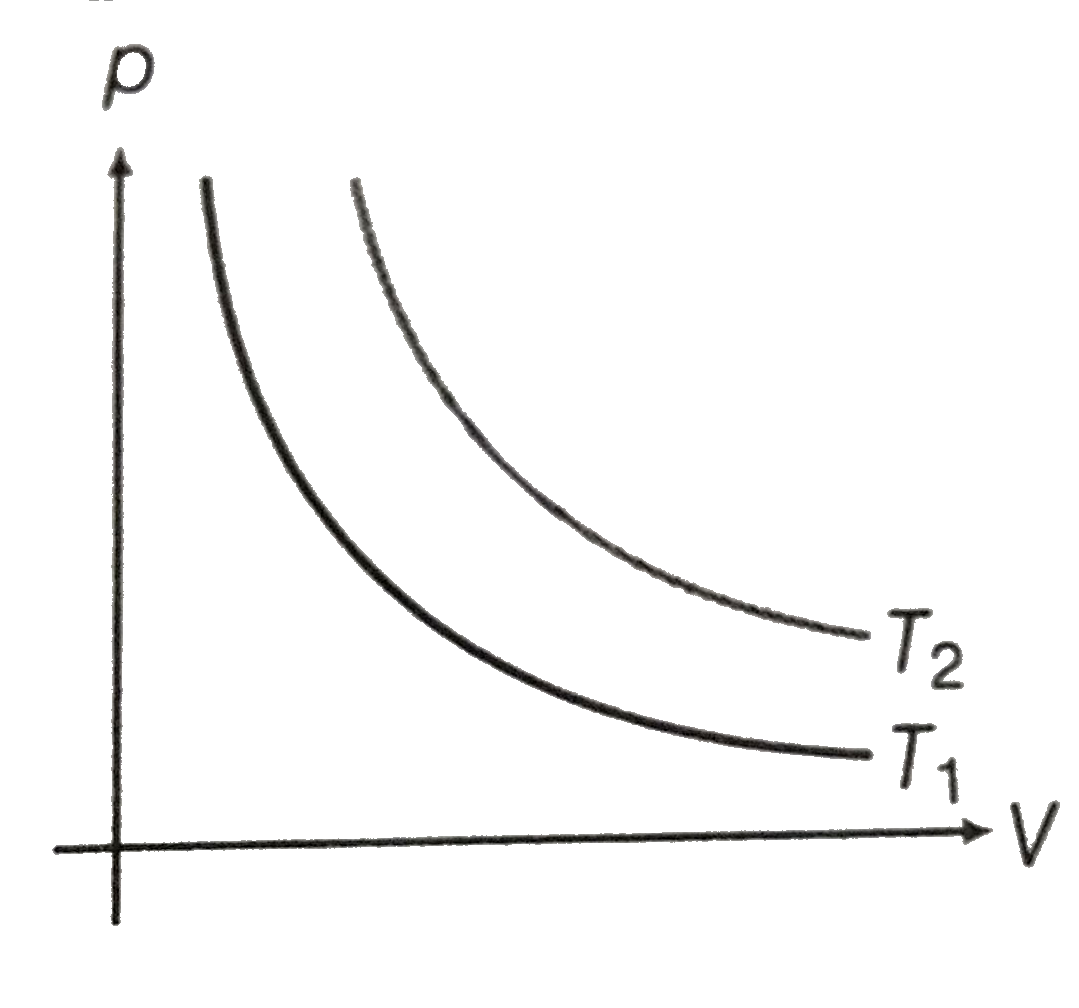
View SolutionThe p−V diagrams of same mass of a gas are drawn at two different temperatues T1 and T2 Explain whether T1>T2 or T2>T1.
View Solution
Knowledge Check
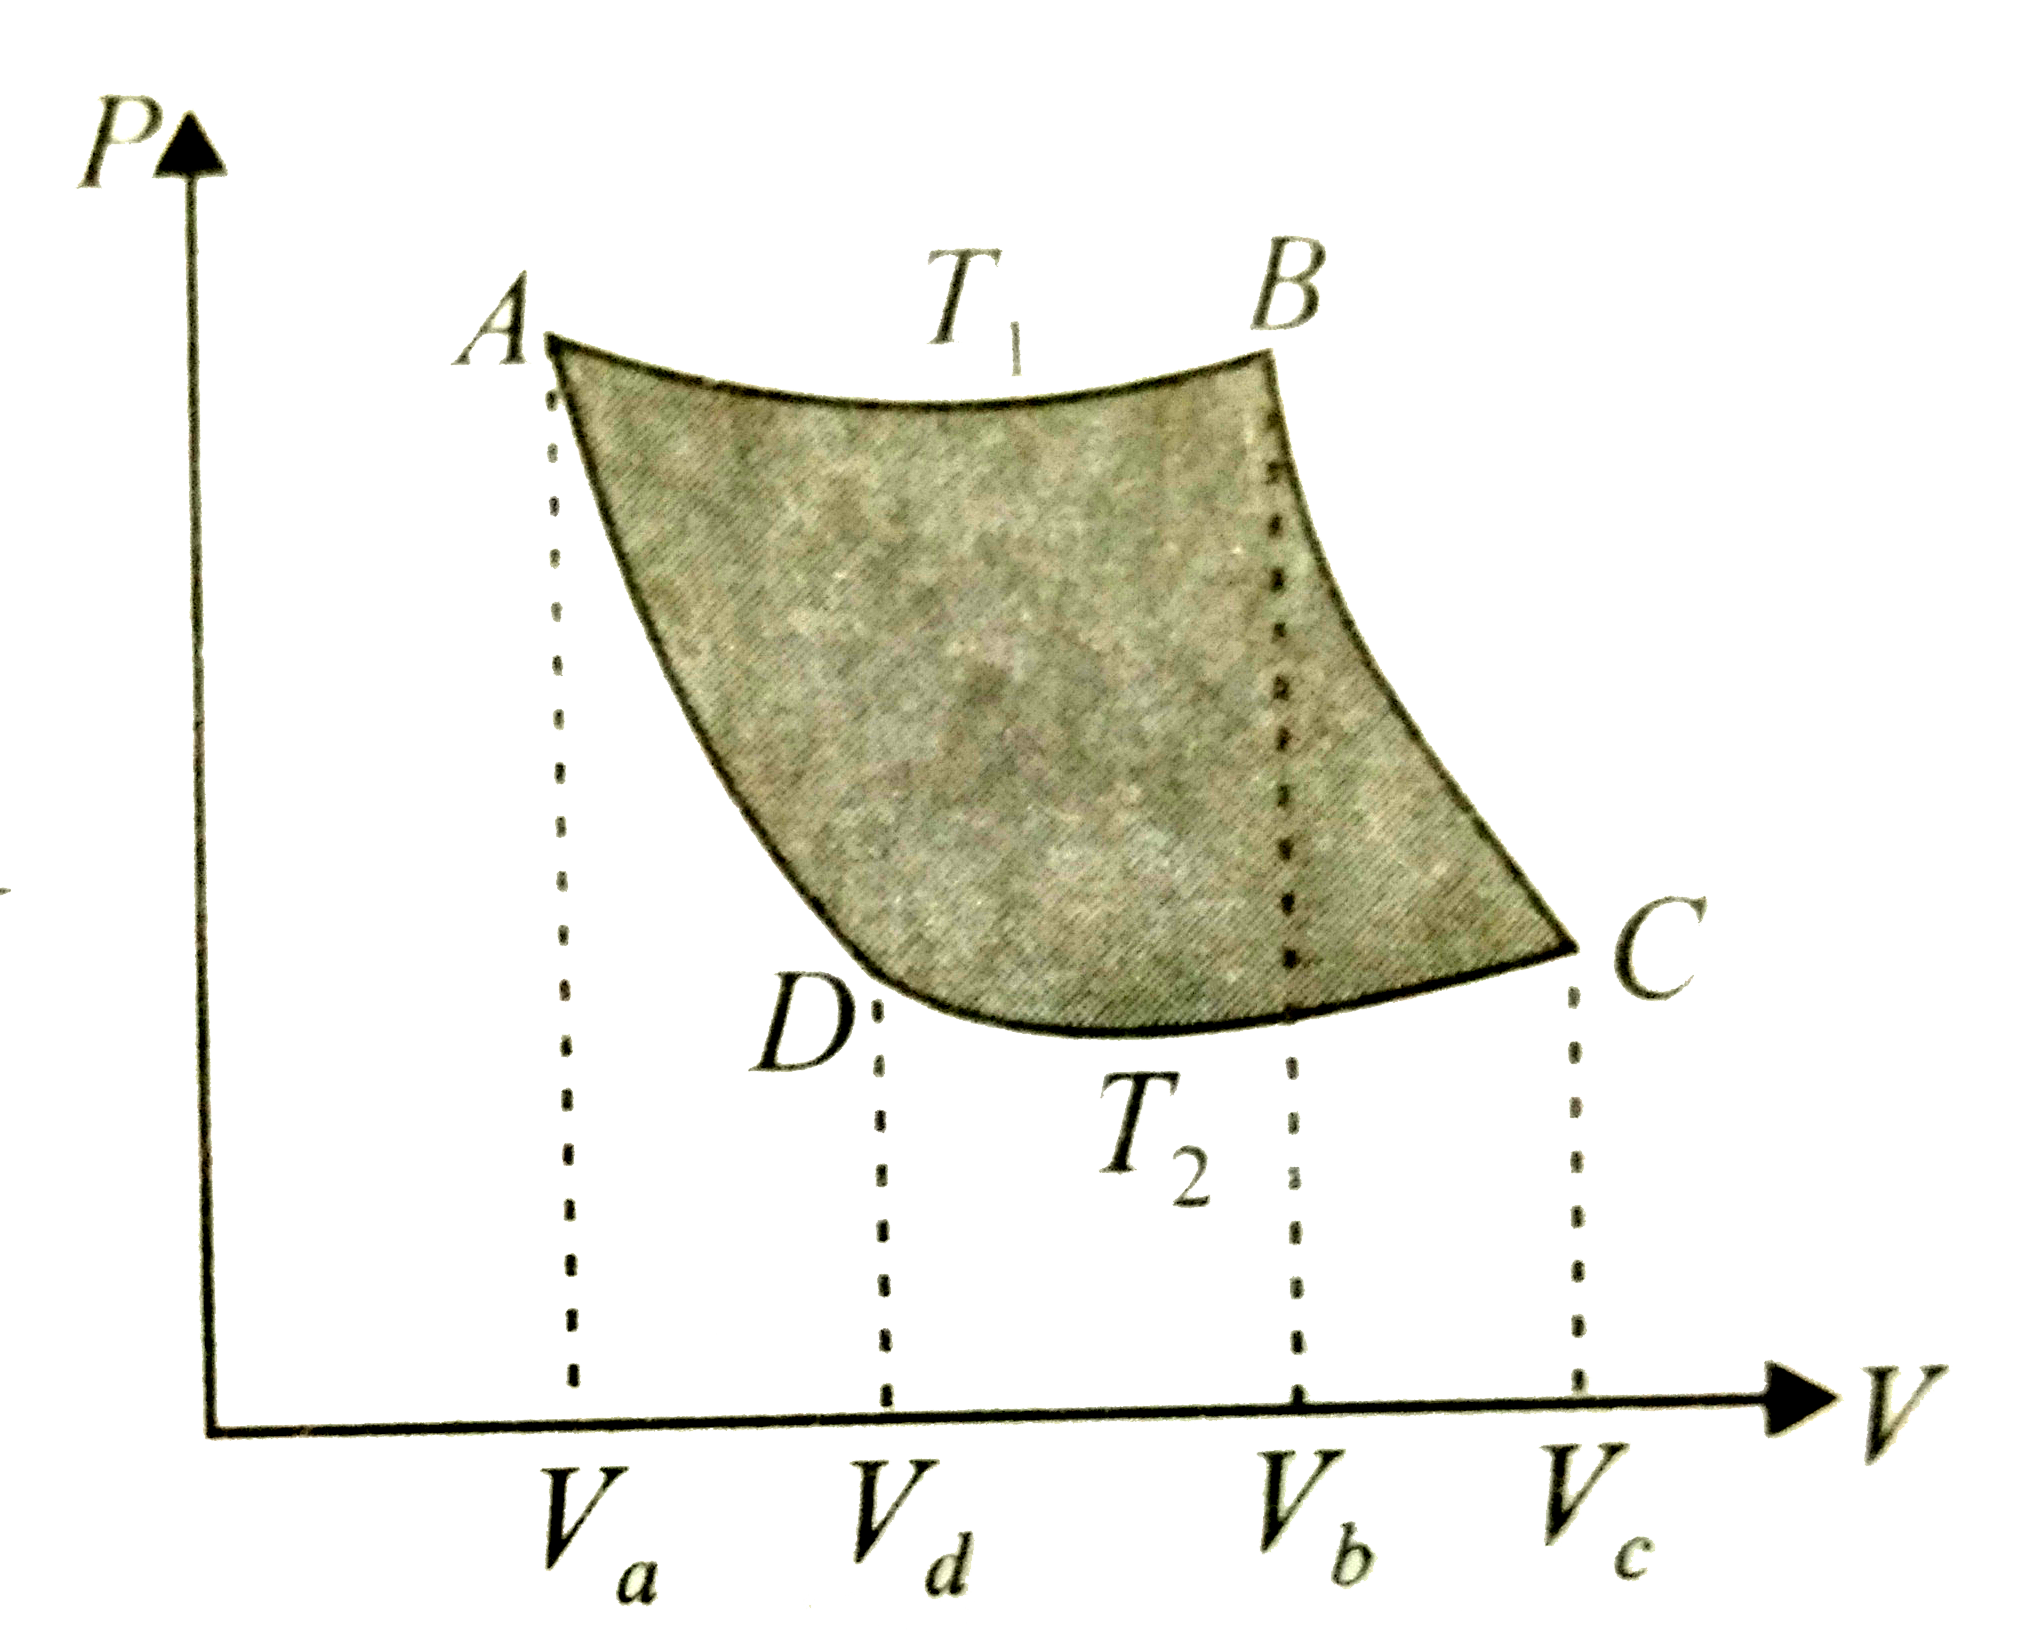
Two different adiabatic parts for the same gas intersect two isothermals at T1andT_2 as shown in P-V diagram . Then the ratio of VaVb will be
 Aa. VcVdBb. VdVcCc. γVdVcDd. 1γVdVc
Assertion : Current versus potential difference (i-V) graph for a conductor at two different temperatures T1 and T2 is shown in figure. Hence T1>T2.
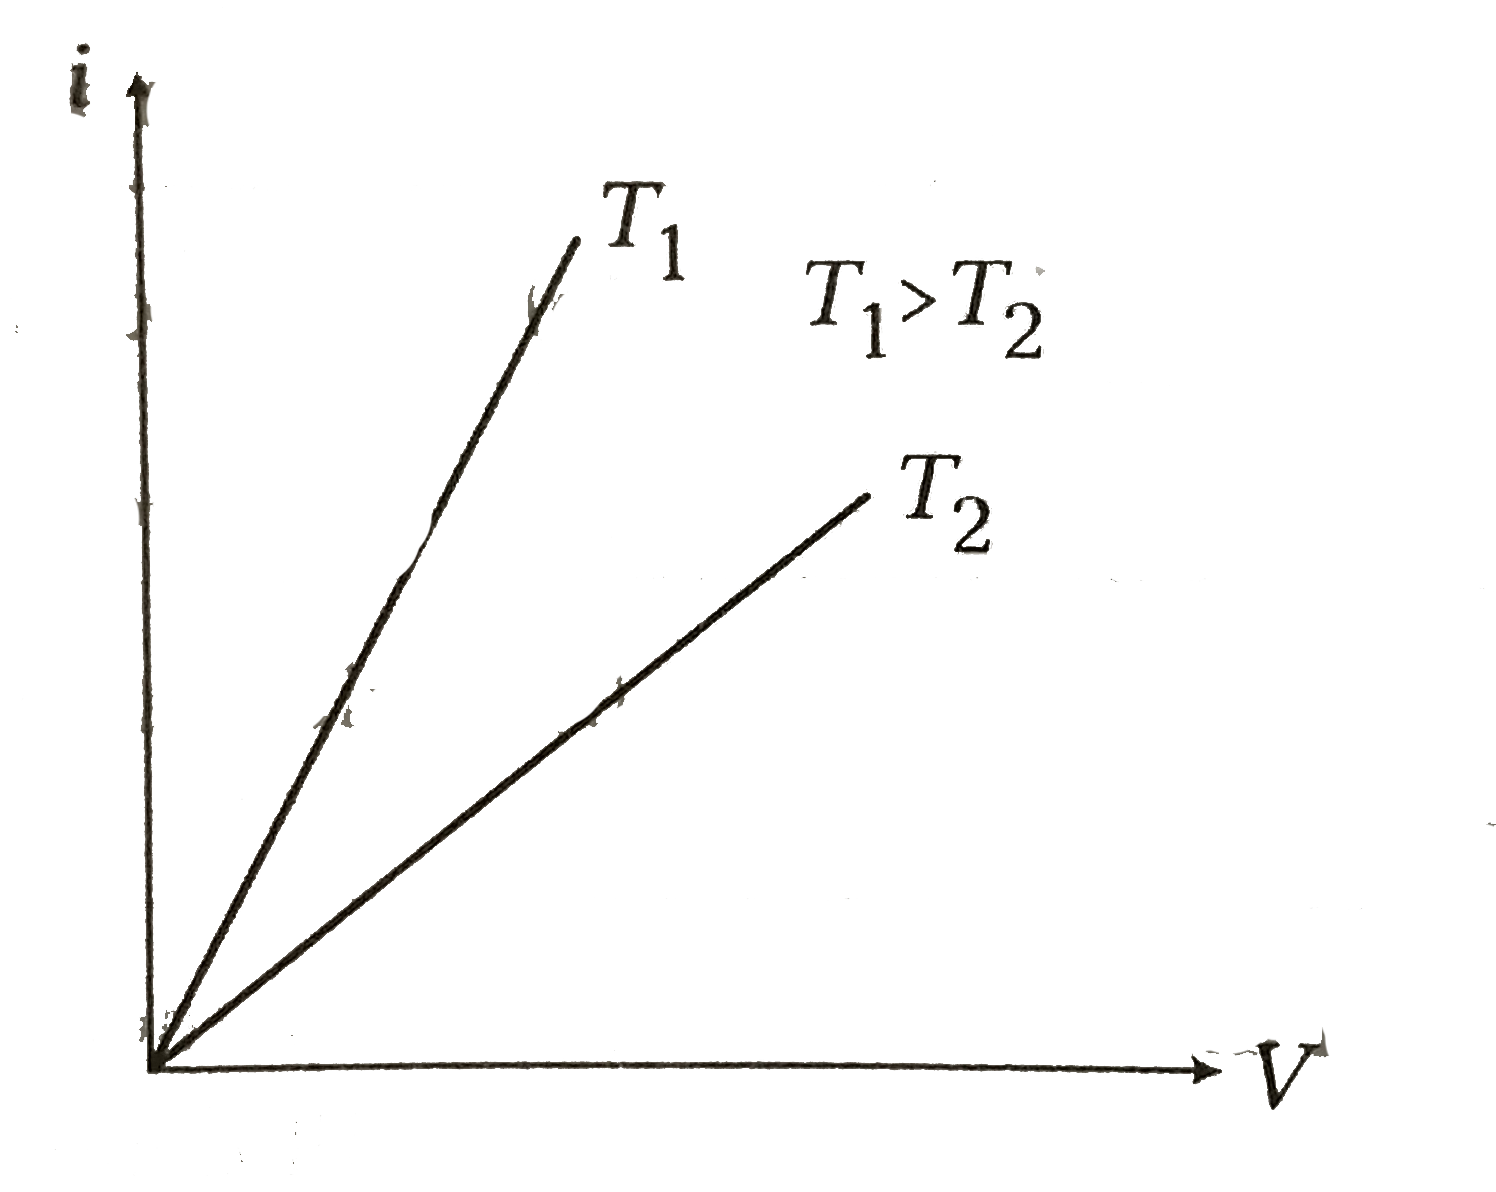
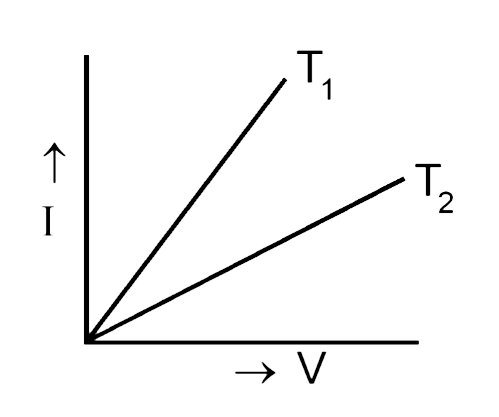
Reason : Resistance of a conductor increases with rise in temperature.Acos2θBsin2θCcot2θDtan2θThe voltage V and current I v graphs for a conductor at two different temperatures T1andT2 are shown in the figure. The relation between T1andT2 is
 AT1>T2BT1<T2CT1=T2DT1=1T2
The current (I) and voltage (V) graphs for a given metallic wire at two different temperature (T1) and (T2) are shown in fig. It is concluded that
View SolutionThe velocities of sound in an ideal gas at temperature T1andT2 K are found to be V1andV2 respectively. If ther.m.s velocities of the molecules of the same gas at the same temperatures T1andT2 are v1andv2 respectively then
View SolutionThe velocities of sound in an ideal gas at temperature T1andT2 K are found to be V1andV2 respectively. If ther.m.s velocities of the molecules of the same gas at the same temperatures T1andT2 are v1andv2 respectively then
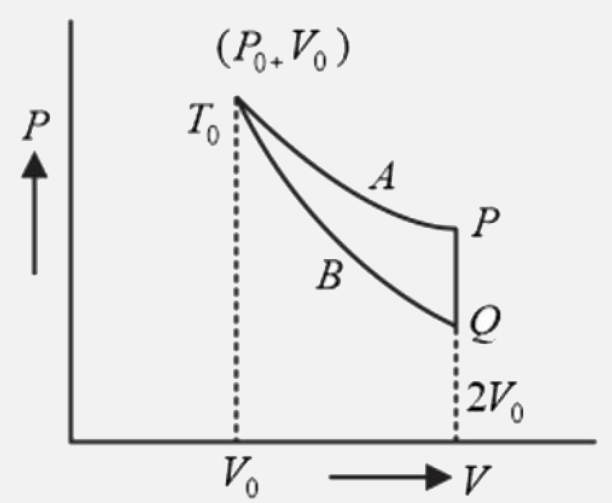
View SolutionAn ideal gas (1 mol ,monatomic) is in the initial state P (see diagram) on an isothermal curve A at a temperature T0 . It is brought under a constant volume (2V0) process to Q which lies on an adiabatic curve B intersecting the isothermal curve A at (P0,V0,T0) . The change in the internal energy of the gas (in terms of T0 ) during the process is (22/3=1.587)
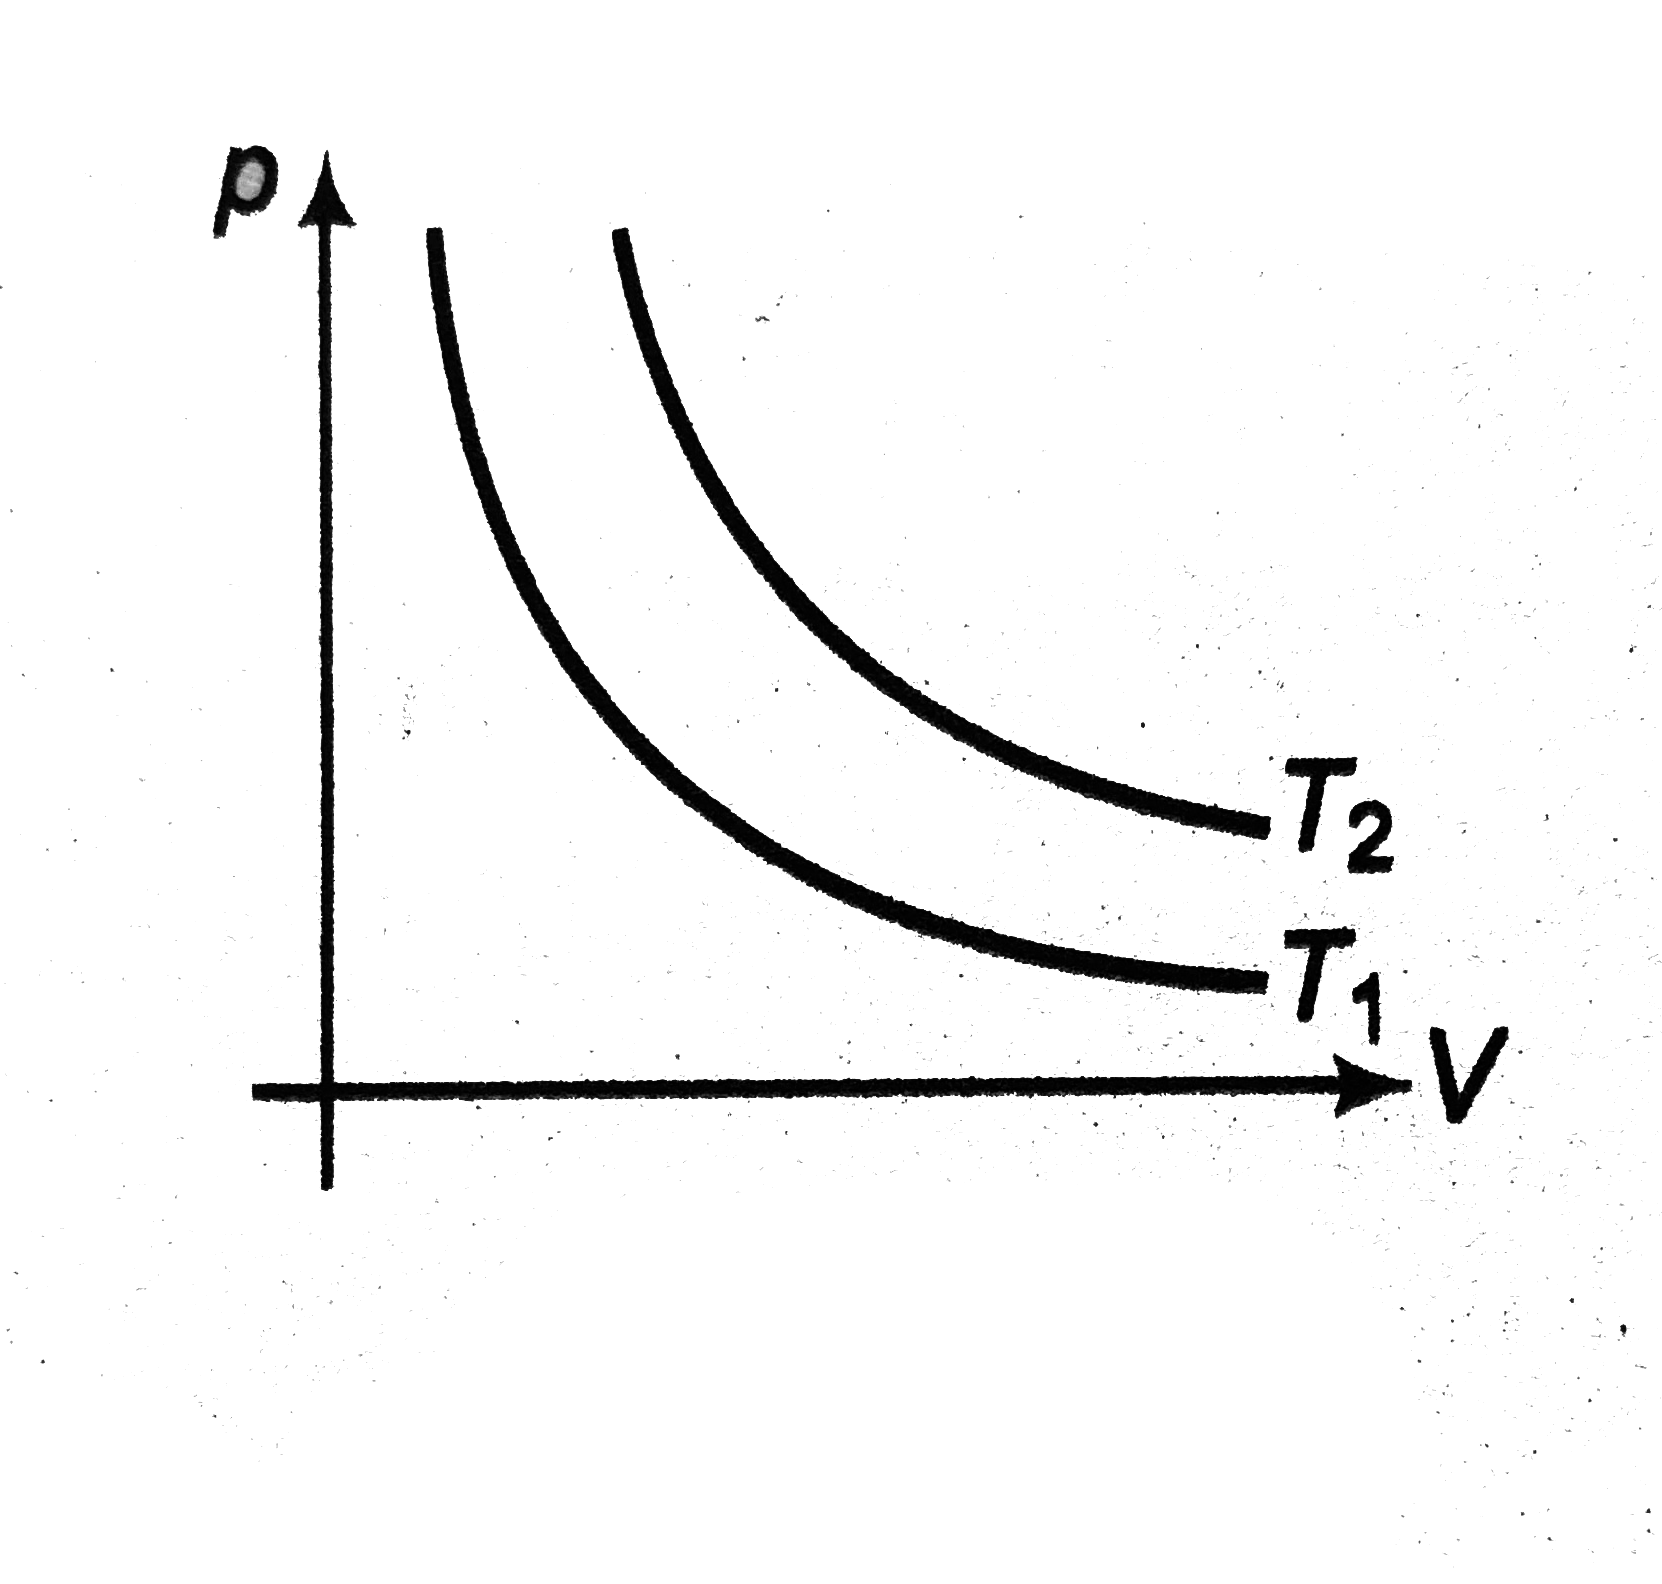
View Solutionp−V diagram of same mass of a gas are drawn at two different temperatures (T1) and (T2). Explain whether T1>T2orT2>T1.
 .
.
View Solution
