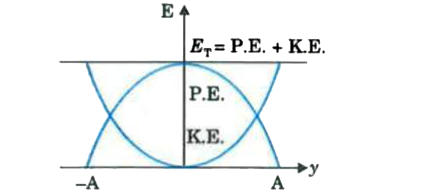
Draw a graph to show the the variation of P.E., K.E. and total eneryg of a simple harmonic oscillator with displacement .
If y is the displacement of a particle executing S.H.M. having amplitude A and angular velocity ω, then
K.E.=12mω2(A2−y2)
P.E. =12mω2y
ET=12mω2A
The variation of P.E., K.E., and total energy is shown in the graph in the adjoining figure.

Topper's Solved these Questions
- OSCILLATIONS BOOK - MODERN PUBLICATIONCHAPTER - OSCILLATIONS EXERCISE - NCERT Exemplar Problems Subjective Question ( short Answer Type Questions )
6 Videos
- OSCILLATIONS BOOK - MODERN PUBLICATIONCHAPTER - OSCILLATIONS EXERCISE - HOTS (Higher Order Thinking Skills & Advanced Level)
11 Videos
- OSCILLATIONS BOOK - MODERN PUBLICATIONCHAPTER - OSCILLATIONS EXERCISE - NCERT Exemplar Problems Subjective Question (Multiple Choice Questions (Type-II))
7 Videos
- MOTION IN A STRAIGHT LINE BOOK - MODERN PUBLICATIONCHAPTER - MOTION IN A STRAIGHT LINE EXERCISE - CHAPTER PRACTICE TEST
16 Videos
- PHYSICAL WORLD BOOK - MODERN PUBLICATIONCHAPTER - PHYSICAL WORLD EXERCISE - Revision exercises (Long answer questions)
6 Videos
Similar Questions
Draw a graph to show the variation of PE, KE and total energy of a simple harmonic oscillator with displacement.
View SolutionA particle is executing S.H.M. along a straight line. The graph showing the variation of kinetic, potential and total energy K, U and T respectively with displacement is -

View Solution
Knowledge Check
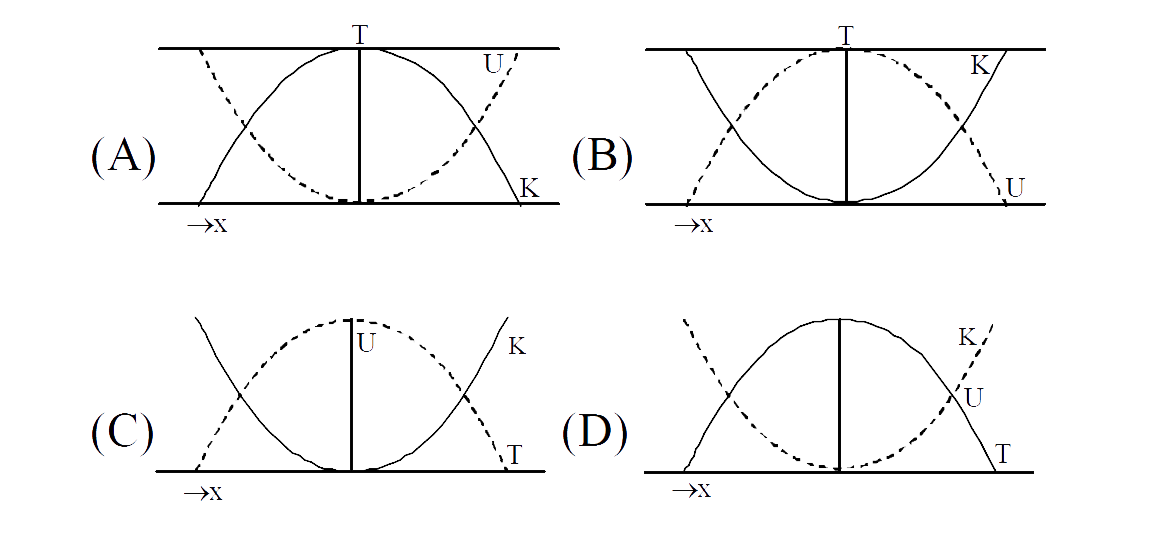
A particle is executing S.H.M. along a straight line. The graph showing the variation of kinetic, potential and total energy K, U and T respectively with displacement is -
 A
A B
B C
C D
D
A particle executes a S.H.M. Its P.E., K.E. and total energy are measured as function of displacement of x. Then its
AK.E. is maximum, when x is maximumBTotal energy is maximum, when x=0CP.E. is maximum, when x=0DK.E. is maximum, when x =0For a simple harmonic oscillator moving along a straight line, the graphs which represent the variation of kinetic energy K, potential energy U and total energy T with displacement are
A B
B C
C D
D
Draw a graph to show the variation of E with perpendicular distance r from line of charge.
View SolutionDraw a graph showing the variation of decay rate with number of active nuclei.
View SolutionDraw a graph showing the variation of decay rate with number of active nuclei.
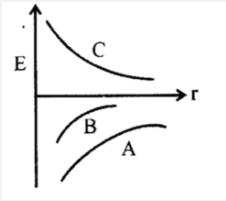
View SolutionAn artificial satellite is made to move in circular orbits of different radii around the earth. The variations of its K.E., P.E. and total energy (E) in different orbits is shown in the figure by different curves. Then for the satellites

View SolutionDraw the graphical representation of simple harmonic motion, showing the displacement-time curve.
View Solution
