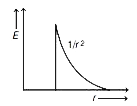
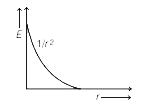
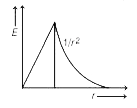
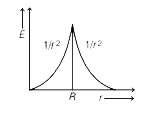
Draw a plot showing variation of electric field with distance from the centre of a solid conducting sphere of radius R, having of + Q on its surface.
To draw a plot showing the variation of electric field with distance from the center of a solid conducting sphere of radius R with a charge +Q on its surface, we can follow these steps:
Step 1: Understand the Electric Field Inside the Sphere
- Inside a solid conducting sphere, the electric field is zero. This is because the charges reside on the surface of the conductor and the electric field within the conductor cancels out.
Step 2: Determine the Electric Field on the Surface
- At the surface of the sphere (at distance R), we can use Gauss's Law to find the electric field. The electric field E at the surface is given by:
E=14πϵ0QR2
- This is the maximum value of the electric field, occurring at the surface of the sphere.
Step 3: Analyze the Electric Field Outside the Sphere
- For points outside the sphere (at distances r>R), the electric field behaves as if all the charge Q were concentrated at the center of the sphere. The electric field at a distance r from the center is given by:
E=14πϵ0Qr2
- This shows that the electric field decreases with the square of the distance from the center, forming a rectangular hyperbola.
Step 4: Plot the Electric Field vs. Distance
- On the x-axis, plot the distance r from the center of the sphere.
- On the y-axis, plot the electric field E.
- The plot will show:
- A horizontal line at E=0 for r<R (inside the sphere).
- A point at E=14πϵ0QR2 at r=R (the surface).
- A curve that starts at this maximum value and decreases as r increases, approaching zero as r goes to infinity.
Step 5: Label the Plot
- Clearly label the axes, the maximum electric field at the surface, and indicate that the electric field is zero inside the sphere.
Final Plot:
- The final plot will have:
- A flat line at E=0 for r<R.
- A peak at r=R where E is maximum.
- A decreasing curve for r>R that approaches zero.
- Inside a solid conducting sphere, the electric field is zero. This is because the charges reside on the surface of the conductor and the electric field within the conductor cancels out.
- At the surface of the sphere (at distance R), we can use Gauss's Law to find the electric field. The electric field E at the surface is given by:
E=14πϵ0QR2
- This is the maximum value of the electric field, occurring at the surface of the sphere.
- For points outside the sphere (at distances r>R), the electric field behaves as if all the charge Q were concentrated at the center of the sphere. The electric field at a distance r from the center is given by:
E=14πϵ0Qr2
- This shows that the electric field decreases with the square of the distance from the center, forming a rectangular hyperbola.
- On the x-axis, plot the distance r from the center of the sphere.
- On the y-axis, plot the electric field E.
- The plot will show:
- A horizontal line at E=0 for r<R (inside the sphere).
- A point at E=14πϵ0QR2 at r=R (the surface).
- A curve that starts at this maximum value and decreases as r increases, approaching zero as r goes to infinity.
- Clearly label the axes, the maximum electric field at the surface, and indicate that the electric field is zero inside the sphere.
- The final plot will have:
- A flat line at E=0 for r<R.
- A peak at r=R where E is maximum.
- A decreasing curve for r>R that approaches zero.
Topper's Solved these Questions
- XII BOARDSBOOK - XII BOARDS PREVIOUS YEARCHAPTER - XII BOARDSEXERCISE - SECTION-B
65 Videos
- XII BOARDSBOOK - XII BOARDS PREVIOUS YEARCHAPTER - XII BOARDSEXERCISE - SECTION-C
55 Videos
- XII BOARDSBOOK - XII BOARDS PREVIOUS YEARCHAPTER - XII BOARDSEXERCISE - section -E
15 Videos
- SAMPLE PAPER 2019BOOK - XII BOARDS PREVIOUS YEARCHAPTER - SAMPLE PAPER 2019EXERCISE - SECTION D
6 Videos
Similar Questions
Draw a plot showing variation of electric field with distance from the centre of a solid conducting sphere of radius R having a charge Q on its surface.
View SolutionDraw a plot showing the variation of (i) electric field E, and (ii) electric potential V with distance 'r' due to a point charge Q.
View Solution
Knowledge Check
The potential at a distance R/2 from the centre of a conducting sphere of radius R will be
A0BQ8πε0RCQ4πε0RDQ2πε0RAn isolated non-conducting solid sphere of radius R is given an electric charge. The charge is uniformly distributed in the volume of sphere. The graph which shows the correct variation of magnitude of electric field with distance from the centre of the sphere is
A B
B C
C D
D
Potential at a point x-distance from the centre inside the conducting sphere of radius R and charged with charge Q is
AKQRBKQxCQx2DxQ
Following curve shows the variation of intesity of gravitational field (→I) with distance from the centre of solid sphere(r) :
View SolutionThe electric field at a distance 3R/2 from the centre of a charge conducting spherical shell of radius R is E. The electric field at a distance R/2 from the centre of the sphere is
View SolutionThe electric field at a distance 3R2 from the centre of a charged conducting spherical shell of radiu R is E. The electric field at a distance R2 from the centre of the sphere is:
View SolutionThe electric field at a distance 3R2 from the centre of a charged conducting spherical shell of radius R is E. The electric field at a distance R2 from the centre of the sphere is :
View SolutionWhich graph best represents the variation of electric potential as a function of distance from the centre of a uniformly charged solid sphere of charge of radius R ?
View Solution
