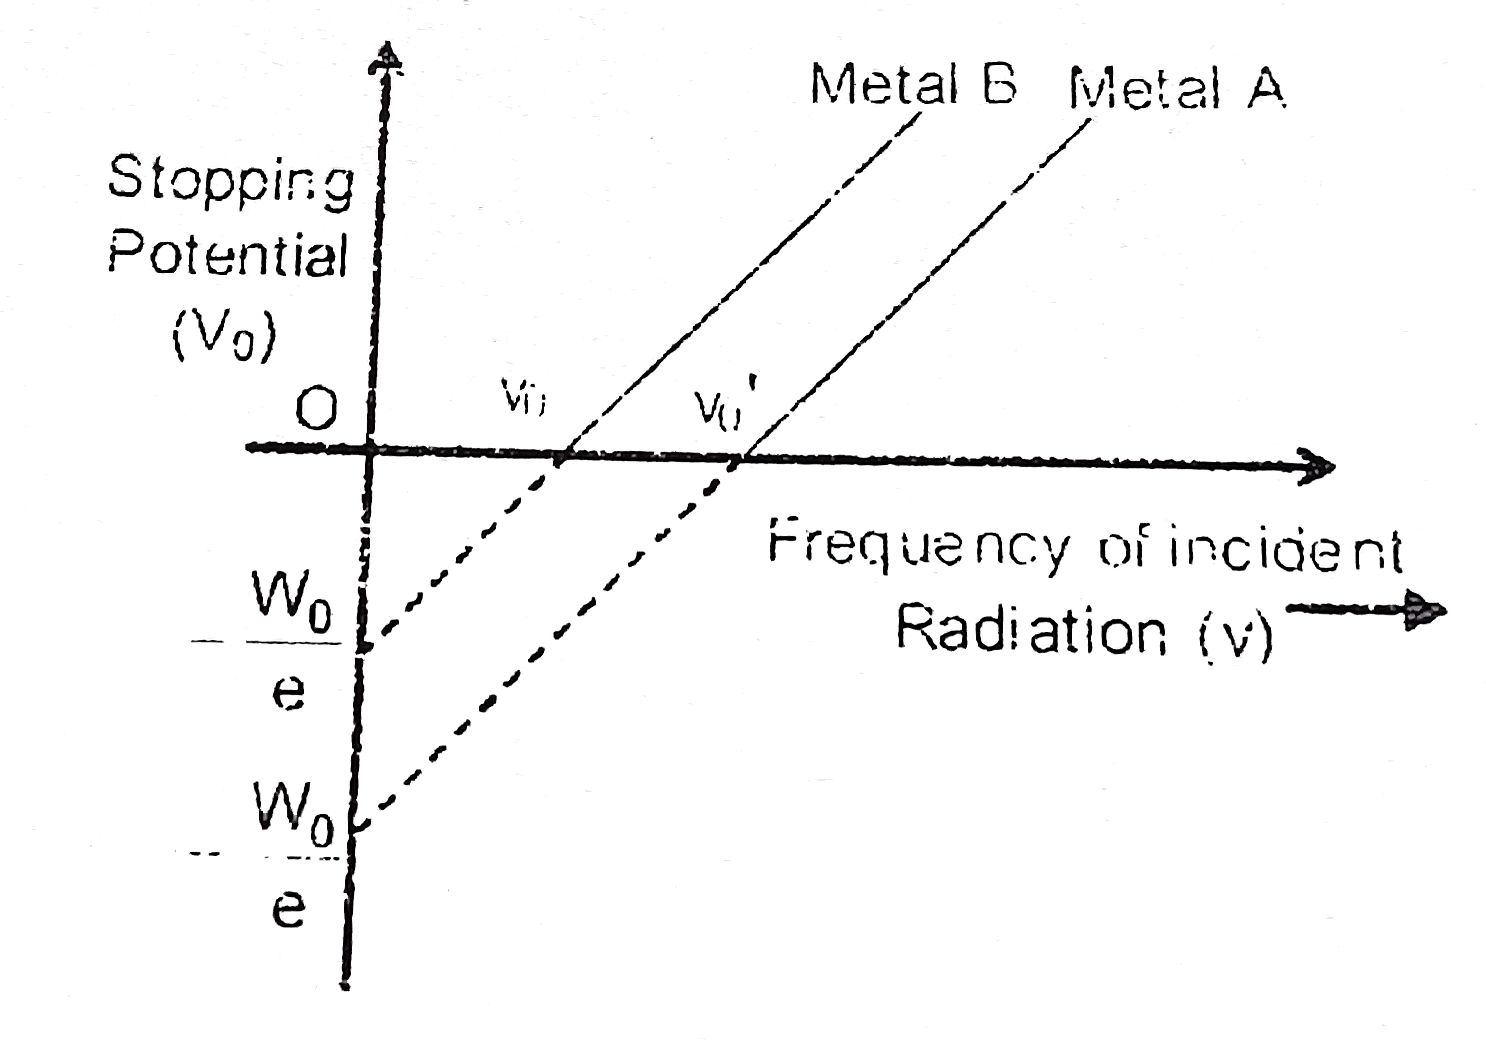
Draw and explain the graph showing the variation of stopping potential with frequency of incident radiation in relation to photoelectric effect.
Step-by-Step Solution:
1. Understanding the Photoelectric Effect:
The photoelectric effect refers to the phenomenon where electrons are emitted from a material (usually a metal) when it is exposed to light (or electromagnetic radiation) of sufficient frequency.
2. Key Equations:
- The maximum kinetic energy (K.E.) of the emitted electrons can be expressed as:
K.E.=eV0
where e is the charge of the electron and V0 is the stopping potential.
- The kinetic energy can also be expressed in terms of the frequency of the incident radiation:
K.E.=hν−ϕ
where h is Planck's constant, ν is the frequency of the incident radiation, and ϕ is the work function of the material.
3. Equating the Two Expressions:
By equating the two expressions for kinetic energy, we have:
eV0=hν−ϕ
4. Rearranging the Equation:
Rearranging the equation gives:
V0=heν−ϕe
This equation resembles the equation of a straight line y=mx+c, where:
- y is the stopping potential V0,
- x is the frequency ν,
- m (slope) is he,
- c (y-intercept) is −ϕe.
5. Graphing the Relationship:
- On the x-axis, plot the frequency ν.
- On the y-axis, plot the stopping potential V0.
- The graph will be a straight line with a positive slope of he and a y-intercept at −ϕe.
6. Interpreting the Graph:
- As the frequency of the incident radiation increases, the stopping potential also increases linearly.
- The intercept indicates the threshold frequency, below which no photoelectrons are emitted (since V0 would be negative).
Final Graph:
- The graph is a straight line starting from the intercept −ϕe on the y-axis and increasing with a slope of he.
The photoelectric effect refers to the phenomenon where electrons are emitted from a material (usually a metal) when it is exposed to light (or electromagnetic radiation) of sufficient frequency.
- The maximum kinetic energy (K.E.) of the emitted electrons can be expressed as:
K.E.=eV0
where e is the charge of the electron and V0 is the stopping potential.
- The kinetic energy can also be expressed in terms of the frequency of the incident radiation:
K.E.=hν−ϕ
where h is Planck's constant, ν is the frequency of the incident radiation, and ϕ is the work function of the material.
By equating the two expressions for kinetic energy, we have:
eV0=hν−ϕ
Rearranging the equation gives:
V0=heν−ϕe
This equation resembles the equation of a straight line y=mx+c, where:
- y is the stopping potential V0,
- x is the frequency ν,
- m (slope) is he,
- c (y-intercept) is −ϕe.
- On the x-axis, plot the frequency ν.
- On the y-axis, plot the stopping potential V0.
- The graph will be a straight line with a positive slope of he and a y-intercept at −ϕe.
- As the frequency of the incident radiation increases, the stopping potential also increases linearly.
- The intercept indicates the threshold frequency, below which no photoelectrons are emitted (since V0 would be negative).
- The graph is a straight line starting from the intercept −ϕe on the y-axis and increasing with a slope of he.
Topper's Solved these Questions
- BOOK - MODERN PUBLICATIONCHAPTER - DUAL NATURE OF RADIATION AND MATTER EXERCISE - Revision Exercises (Long Answer Questions)3videos
DUAL NATURE OF RADIATION AND MATTER
- BOOK - MODERN PUBLICATIONCHAPTER - DUAL NATURE OF RADIATION AND MATTER EXERCISE - Revision Exercises (Numerical Problems)20videos
DUAL NATURE OF RADIATION AND MATTER
- BOOK - MODERN PUBLICATIONCHAPTER - DUAL NATURE OF RADIATION AND MATTER EXERCISE - Revision Exercises (Fill in the Blanks)11videos
DUAL NATURE OF RADIATION AND MATTER
- BOOK - MODERN PUBLICATIONCHAPTER - CURRENT ELECTRICITYEXERCISE - Chapter Practice Test15videos
CURRENT ELECTRICITY
- BOOK - MODERN PUBLICATIONCHAPTER - ELECTRIC CHARGES AND FIELDS EXERCISE - Chapter Practice Test15videos
ELECTRIC CHARGES AND FIELDS
Similar Questions
Draw a graph showing the variation of stopping potential with frequency of the incident radiation. What does the slope of the line with frequency axis indicate? What information can be obtained from the values of intercept on the potential axis?
View SolutionDefine photoelectric effect. Draw a graph to show the variation of stopping potential with frequency of incident radiation on a metal plate.
View Solution
Knowledge Check
- Question 1 - Select One
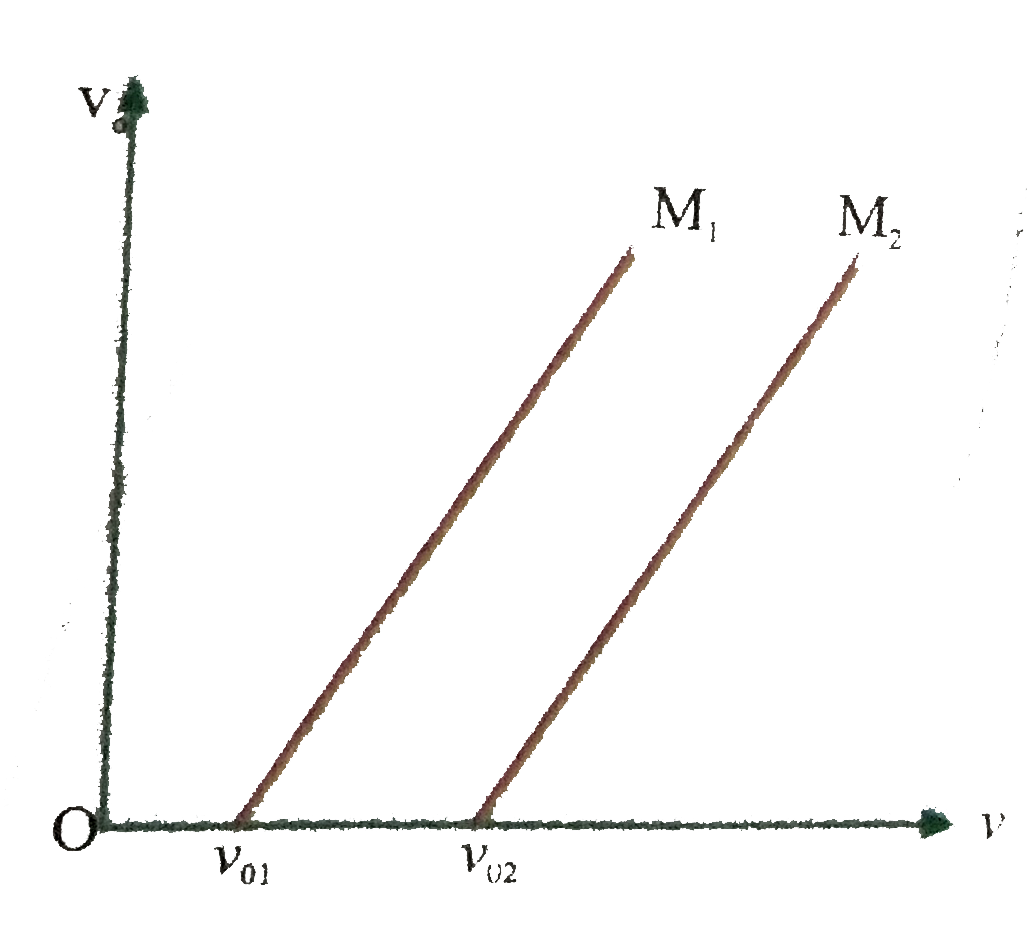
Figure show the variation of the stopping potential (V0) with the frequency (v) of the incident radiations for two different photosensitive matererial M1 and M2 What are the values of work functions for M1 and M2 respectively
 Ahv01,hv02Bhv02,hv01Chv01,hv01Dhv02,hv02
Sketch the graphs showing variation of stopping potential with frequency of incident radiations for two photosensitive materials A and B having threshold frequencies vA>vB.
(i) In which case is the stopping materials A and B having threshold frequencies vA>VB.
(i) In which case is the stopping potential more and why?
(ii) Does the slope of the graph depend on the nature of the materials used ? Explain.View SolutionDraw a graph showing the variation of stopping potential with frequency of the incident on a metal plate. How can the value of Planck's constant be determined from this graph?
View SolutionPlot a graph showing variation of stopping potential (V0) with the frequency (v) of the incident radiation for a given photosensitive material. Hence, state the significance of the threshold frequency in photoelectric emission.
Using the principle of energy conservation, write the equation relating the energy of incident photon, threshold frequency and the maximum kinetic energy of the emitted photoelectrons.View SolutionDefine the term 'stopping potential' in relation to photoelectric effect.
View SolutionDefine the term 'stopping potential' in relation to photoelectric effect.
View SolutionThe figure shows the variation of stopping potential VQ with the frequency v of the incident radiations for two photosensitive metals P and
Which metal has smaller threshold wavelength ? Justify your answer.View SolutionThe graph shows variation of stopping potential V0 versus frequency of incident radiation v for two photosensitive metals A and B. Which of two metals has higher threshold frequency and why?
 View Solution

