Draw displacement-time graph of a wave and show on it the amplitude and time period of wave.
Step by step video & image solution for Draw displacement-time graph of a wave and show on it the amplitude and time period of wave. by Physics experts to help you in doubts & scoring excellent marks in Class 9 exams.
Updated on:21/07/2023Topper's Solved these Questions
- PROPAGATION OF SOUND WAVES BOOK - ICSECHAPTER - PROPAGATION OF SOUND WAVES EXERCISE - EXERCISE -8(A) (Multiple choice type)
4 Videos
- PROPAGATION OF SOUND WAVES BOOK - ICSECHAPTER - PROPAGATION OF SOUND WAVES EXERCISE - EXERCISE -8(A) (Numericals)
13 Videos
- PROPAGATION OF SOUND WAVES BOOK - ICSECHAPTER - PROPAGATION OF SOUND WAVES EXERCISE - EXERCISE -8(B) (Multiple choice type)
3 Videos
- PRESSURE IN FLUIDS AND ATMOSPHERIC PRESSUREBOOK - ICSECHAPTER - PRESSURE IN FLUIDS AND ATMOSPHERIC PRESSUREEXERCISE - Exercise -4(B)Numericals
5 Videos
- REFLECTION OF LIGHTBOOK - ICSECHAPTER - REFLECTION OF LIGHTEXERCISE - EXERCISE 7(C)
54 Videos
Similar Questions
Draw a displacement-distance graph of a wave and mark on it, the amplitude of wave by the letter a and wavelength of wave by the letter λ
View SolutionDraw a displacement-distance graph for two waves A and B such that the amplitude of wave A is three times that of wave B.
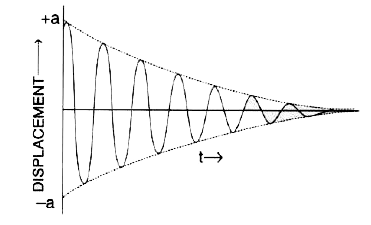
View SolutionThe diagram in Fig. shows the displacement time graph of a vibrating body.

Why is the amplitude of vibrations gradually decreasing ?
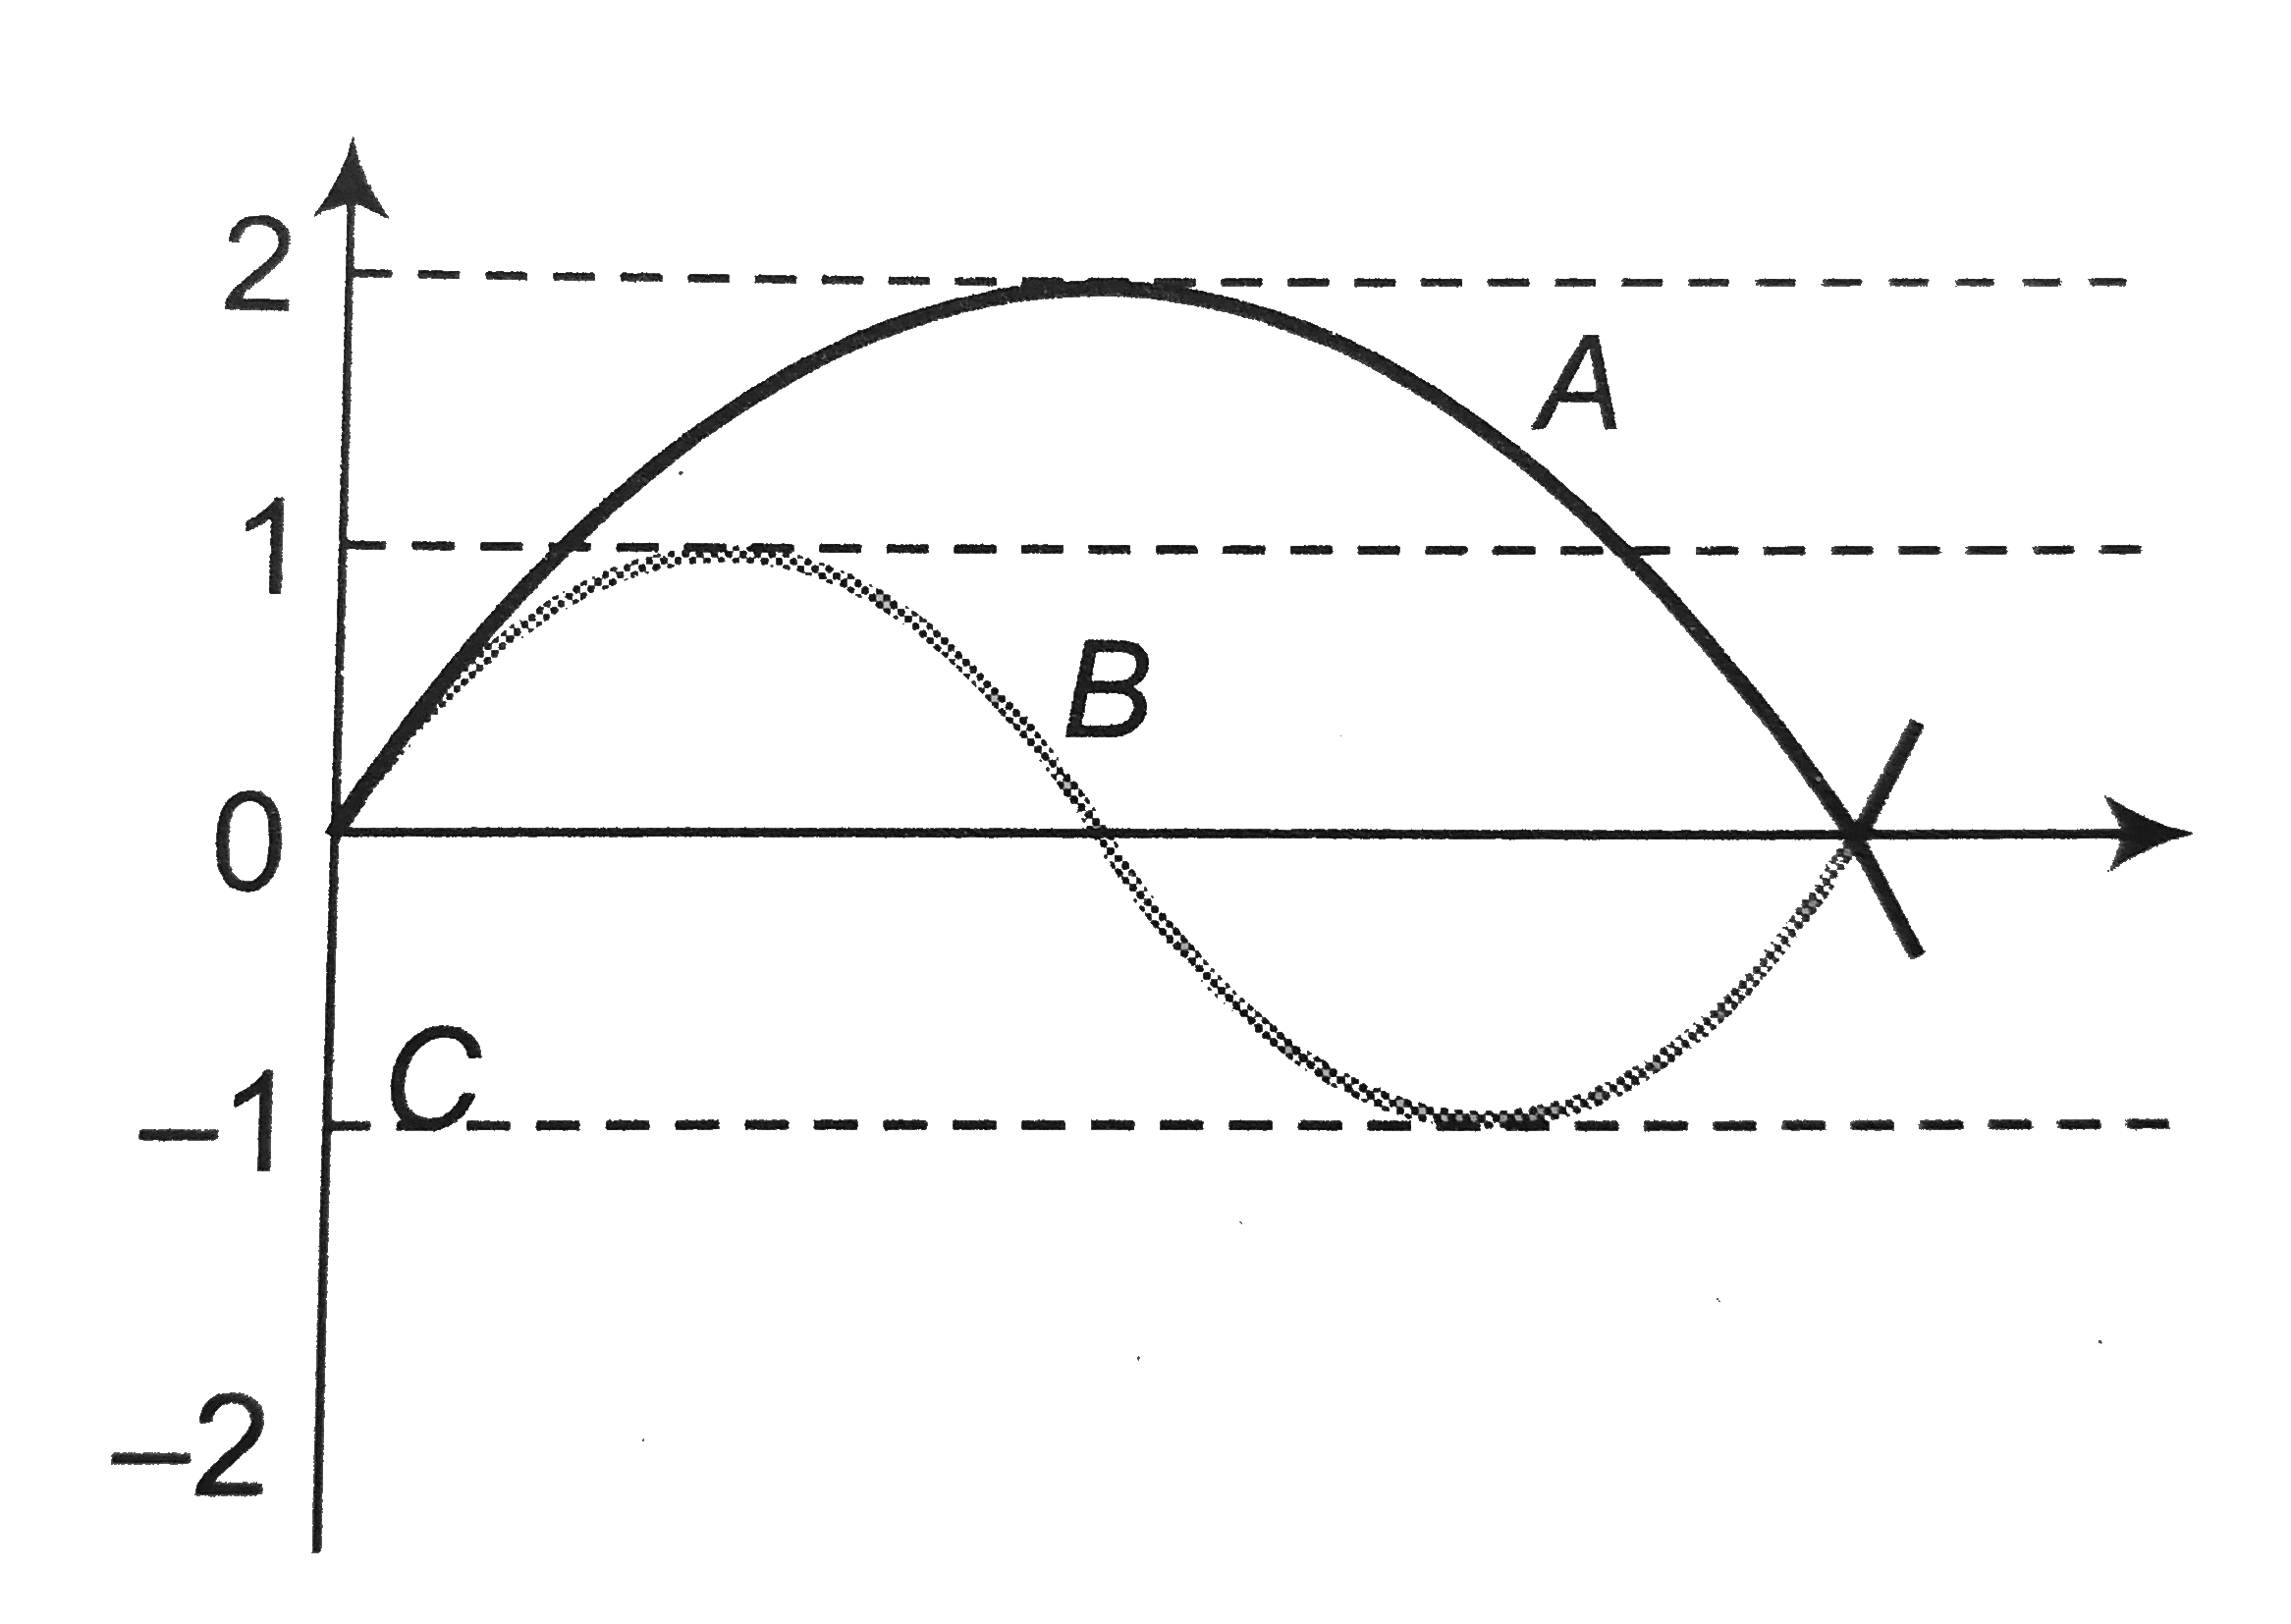
View SolutionFigure below shows the distance-displacement graph of two waves A and B. Compare (i) the amplitude, (ii) the wavelength of the two waves.

View SolutionDraw the displacement-time graph of a longitudial wave. On the diagram mark the region of compression and region of rarefaction.
View SolutionThe diagram in Fig. shows the displacement time graph of a vibrating body.

Why is the amplitude of vibrations gradually decreasing ?
View SolutionDraw a displacement-time graph for a boy going to school with a uniform velocity.
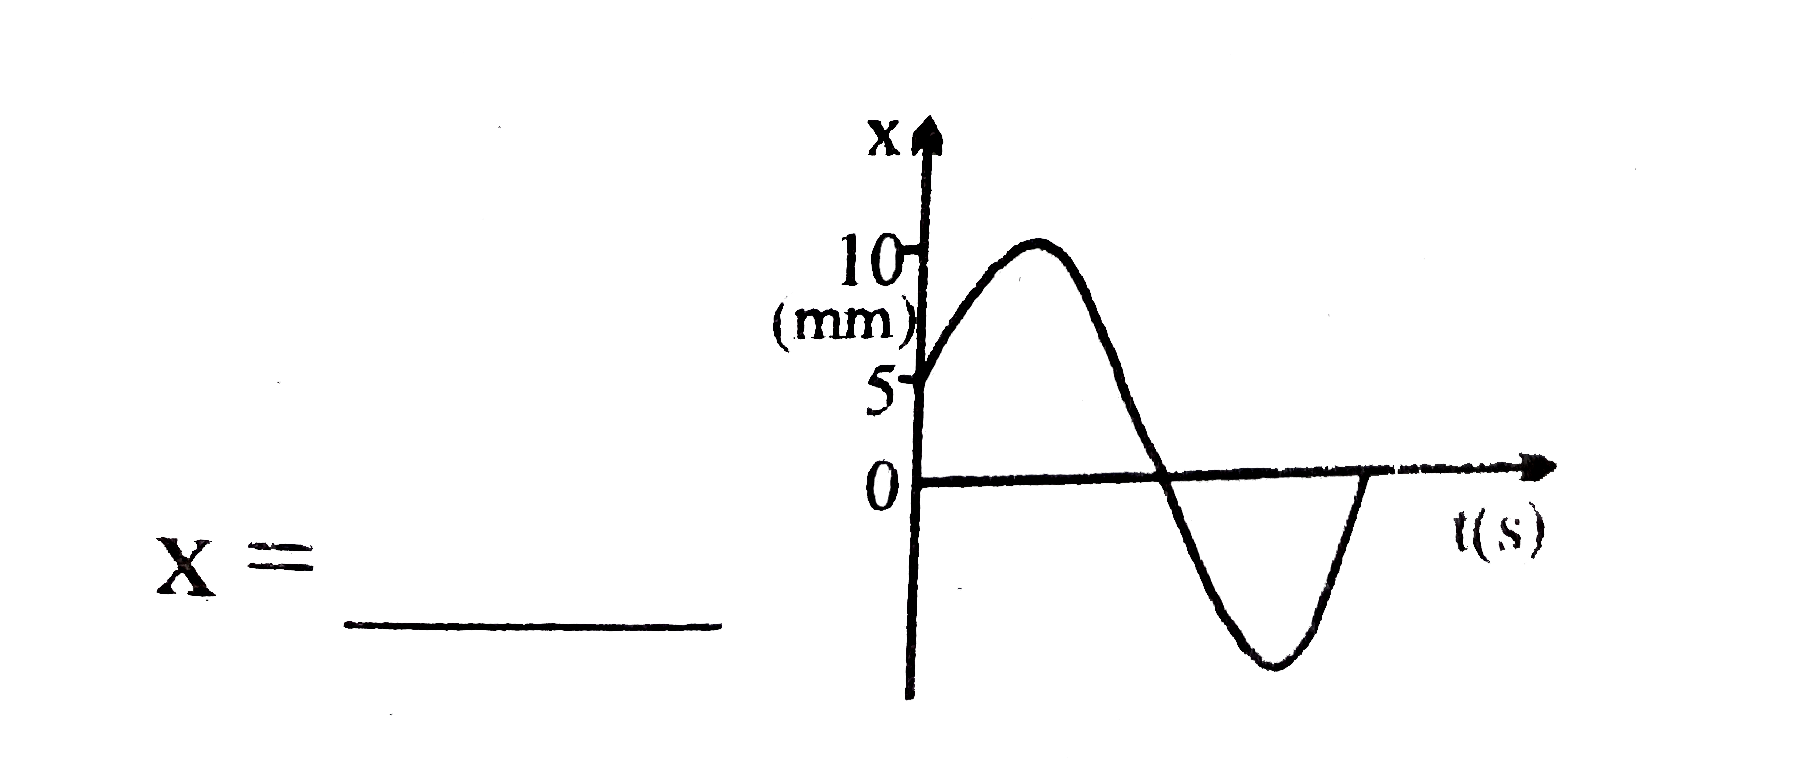
View SolutionThe figure shows the displacement-time graph of a particle executing SHM. If the time period of oscillation is 2s, then the equation of motion is given by

View SolutionThe figure shows the displacement-time graph of a particle executing SHM. If the time period of oscillation is 2s, then the equation of motion is given by

View Solution
The displacement time graph for two sound waves A and B are shown in the figure. Then the ratio of their intensities IA/IB is equal to
View Solution
