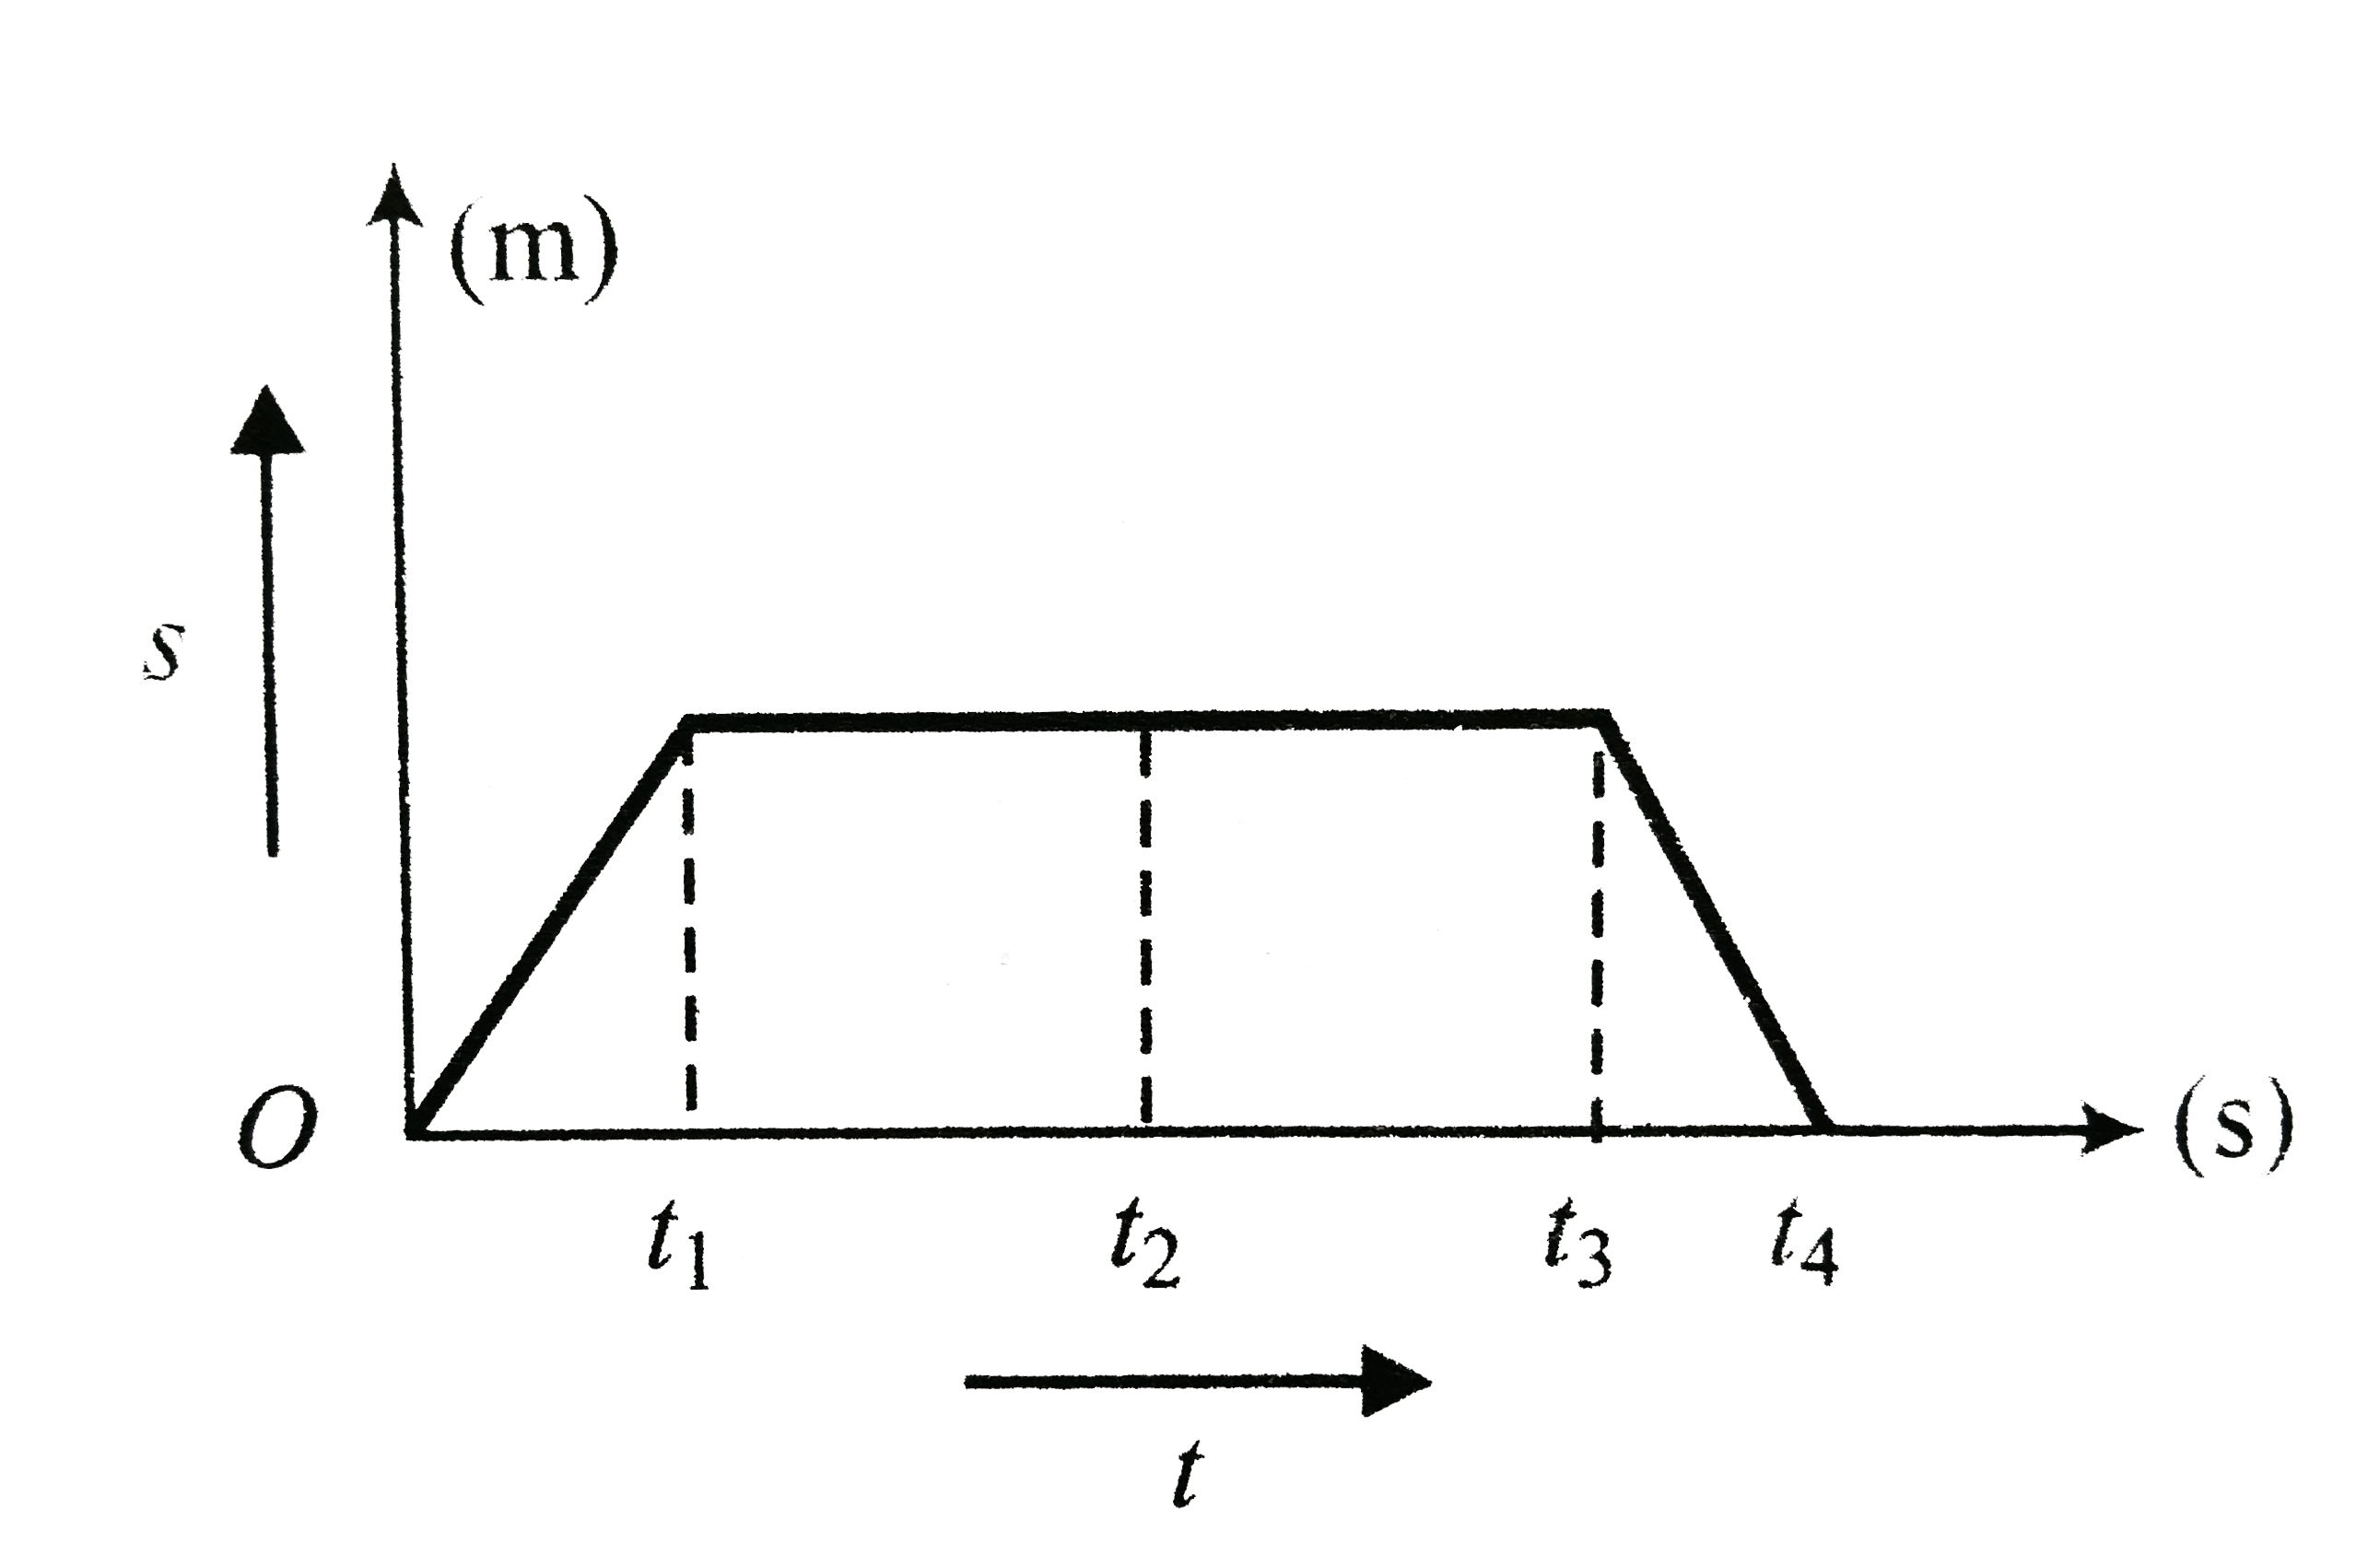
Draw a displacement-time graph for a boy going to school with a uniform velocity.
To draw a displacement-time graph for a boy going to school with a uniform velocity, we can follow these steps:
1. Understand the Concept of Uniform Velocity:
- Uniform velocity means that the boy covers equal distances in equal intervals of time. This implies that the displacement increases linearly with time.
2. Set Up the Axes:
- Draw a horizontal line (x-axis) to represent time (t).
- Draw a vertical line (y-axis) to represent displacement (s).
3. Label the Axes:
- Label the x-axis as "Time (t)" and the y-axis as "Displacement (s)".
4. Choose Points for the Graph:
- Select a few time intervals (e.g., 0, 1, 2, 3, 4, 5 seconds).
- For uniform velocity, choose corresponding displacement values that increase linearly (e.g., 0 m, 2 m, 4 m, 6 m, 8 m, 10 m).
5. Plot the Points:
- Plot the points on the graph:
- (0, 0)
- (1, 2)
- (2, 4)
- (3, 6)
- (4, 8)
- (5, 10)
6. Draw the Line:
- Connect the points with a straight line. Since the velocity is uniform, the line will be straight.
7. Final Graph:
- The final graph will show a straight line starting from the origin (0,0) and sloping upwards, indicating that as time increases, displacement also increases uniformly.
- Uniform velocity means that the boy covers equal distances in equal intervals of time. This implies that the displacement increases linearly with time.
- Draw a horizontal line (x-axis) to represent time (t).
- Draw a vertical line (y-axis) to represent displacement (s).
- Label the x-axis as "Time (t)" and the y-axis as "Displacement (s)".
- Select a few time intervals (e.g., 0, 1, 2, 3, 4, 5 seconds).
- For uniform velocity, choose corresponding displacement values that increase linearly (e.g., 0 m, 2 m, 4 m, 6 m, 8 m, 10 m).
- Plot the points on the graph:
- (0, 0)
- (1, 2)
- (2, 4)
- (3, 6)
- (4, 8)
- (5, 10)
- Connect the points with a straight line. Since the velocity is uniform, the line will be straight.
- The final graph will show a straight line starting from the origin (0,0) and sloping upwards, indicating that as time increases, displacement also increases uniformly.
Topper's Solved these Questions
- MOTION IN ONE DIMENSION BOOK - ICSECHAPTER - MOTION IN ONE DIMENSION EXERCISE - EXERCISE -2 (B) ( Multiple choice type :)
3 Videos
- MOTION IN ONE DIMENSION BOOK - ICSECHAPTER - MOTION IN ONE DIMENSION EXERCISE - EXERCISE -2 (B) ( Numericals )
12 Videos
- MOTION IN ONE DIMENSION BOOK - ICSECHAPTER - MOTION IN ONE DIMENSION EXERCISE - EXERCISE -2 (A) ( Numericals )
16 Videos
- MEASUREMENTS AND EXPERIMENTATION BOOK - ICSECHAPTER - MEASUREMENTS AND EXPERIMENTATION EXERCISE - TOPIC 2 SIMPLE PENDULUM (4 Marks Questions )
1 Videos
- PRESSURE IN FLUIDS AND ATMOSPHERIC PRESSUREBOOK - ICSECHAPTER - PRESSURE IN FLUIDS AND ATMOSPHERIC PRESSUREEXERCISE - Exercise -4(B)Numericals
5 Videos
Similar Questions
Draw the shape of the velocity-time graph for a body moving with (a) uniform velocity, (b) uniform acceleration.
View SolutionDraw a velocity-time graph for a body moving with an initial velocity u and uniform acceleration a. Use this graph to find the distance travelled by the body in time t.
View SolutionDraw displacement-time graph of a wave and show on it the amplitude and time period of wave.
View SolutionDraw areal velocity time graph for Mars.
View SolutionAssertion : Displacement-time graph is a parabola corresponding to straight line velocity-time graph.
Reason : lf v=u+at then s=ut+12at2
View SolutionDraw the velocity-displacement graph of a body executing shm.
View SolutionA body at rest is made to fall from the top of a tower. Its displacement at different instants is given in the following table : Draw a displacement-time graph and state whether the motion is uniform or non-uniform?

View SolutionThe displacement-time graph of a body is shown in.
 .
.
The velocity-time graph of the motion of the body will be .
View SolutionThe displacement -time (x– t) graph of a body is given as

The corresponding velocity -time (v – t ) graph will be
View SolutionThe displacement-time (x - t) graph of a body is given as

The corresponding velocity -time (v - t) graph will be
View Solution
