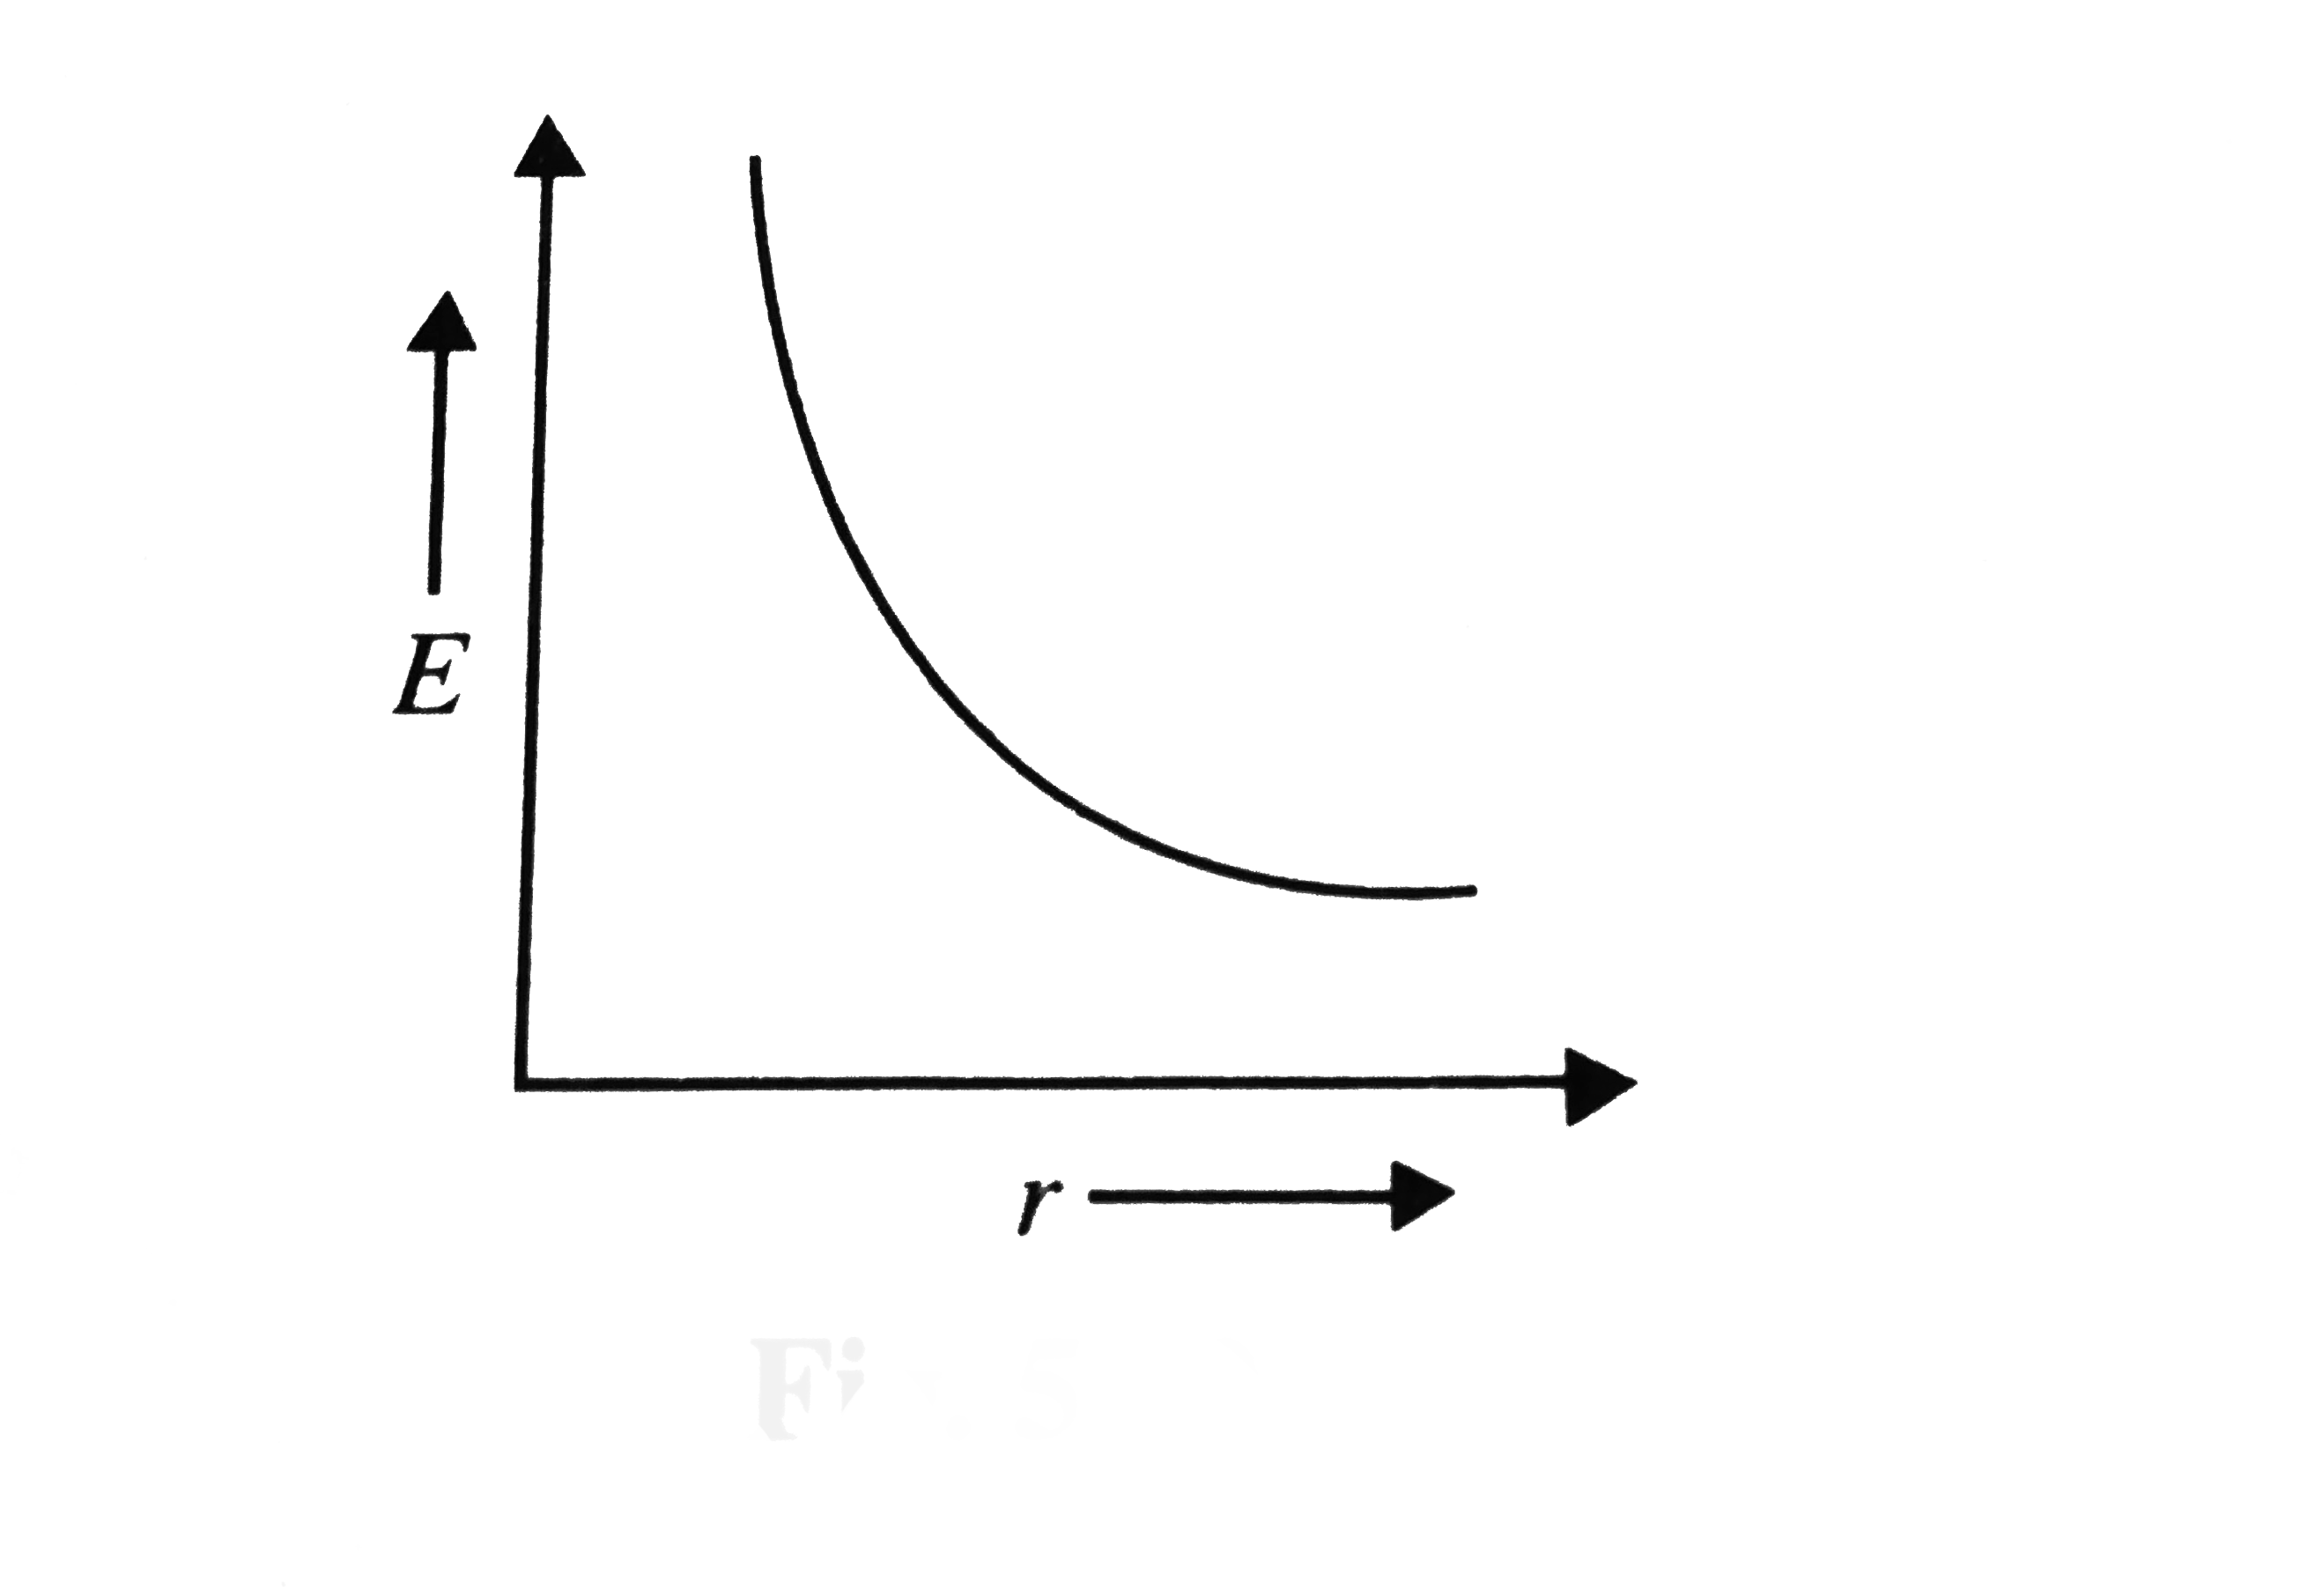
Energy density E (energy per unit volume ) of the medium ar a distance r from a sound source varies acording to the curve shown in figure. Which of the following are possible?
The source may be a point isotropic source
if the source is a plane source then the medium particle have damped oscillations
if the source is a plane source then power of the sourcee is decresing with time
density of the medium decrease with distance r from the source
The correct Answer is:a., b., d.
Due to propagation of a wave the energy density at a point is given by
E=I/v Where I is intenssity at that point and v is wave propagation velocity.
it means energy density E is directly propagation to intensity I.
if power emitted by a point source is P then intensity at a distance r from it is equal to
I=P4πr2orI∝1r2
Hence, the shape of the curve between I and r will also be same as that given in figure of the quetion.
hence, option (a) is correct.
if the source is a plane sound source then intensity at every point in front of the source then intensity at every point in front of the source will be same if damping does not take place. but if damping takes place then the amplitude of oscillation of medium particle decrease with distance. hence, the intensity decrease with the distance from the source. in that case, the curve between I and r may have the same shape as shown in the figure given in the equation. hence, option (b) is also correct.
if the source is a plane source, intensity at every point of the source will be the same. but if power if the source is decreasing with time then intensity will also decrease with time. but at an instant, intensity at every point in front of source will be same. therefore, the energy density at every point in front of source will also be same, though it will decrease with time. hence, option (c ) is wrong.
intensity, I=2π2n2a2pv
Since, intensity I∝p (density of medium) and density I is decrease with distance, therefore, the density p also decrease with distance from the source. hence, option (d) is also correct.
Topper's Solved these Questions
- BOOK - CENGAGE PHYSICS ENGLISHCHAPTER - TRAVELLING WAVESEXERCISE - Assertion-Reasoning6videos
TRAVELLING WAVES
- BOOK - CENGAGE PHYSICS ENGLISHCHAPTER - TRAVELLING WAVESEXERCISE - Comprehension45videos
TRAVELLING WAVES
- BOOK - CENGAGE PHYSICS ENGLISHCHAPTER - TRAVELLING WAVESEXERCISE - Single Correct Answer1videos
TRAVELLING WAVES
- BOOK - CENGAGE PHYSICS ENGLISHCHAPTER - TRANSMISSION OF HEATEXERCISE - Single correct9videos
TRANSMISSION OF HEAT
- BOOK - CENGAGE PHYSICS ENGLISHCHAPTER - VECTORSEXERCISE - Exercise Multiple Correct5videos
VECTORS
Similar Questions
A sonic source, located in a uniform medium, emits waves of frequency n. If intensity, energy density (energy per unit volume of the medium) and maximum speed of oscillations of medium particle are, respectively, I, E and u0 at a point, then which of the following graphs are correct?
View SolutionPotential energy U(r ) varies with position r as shown in figure
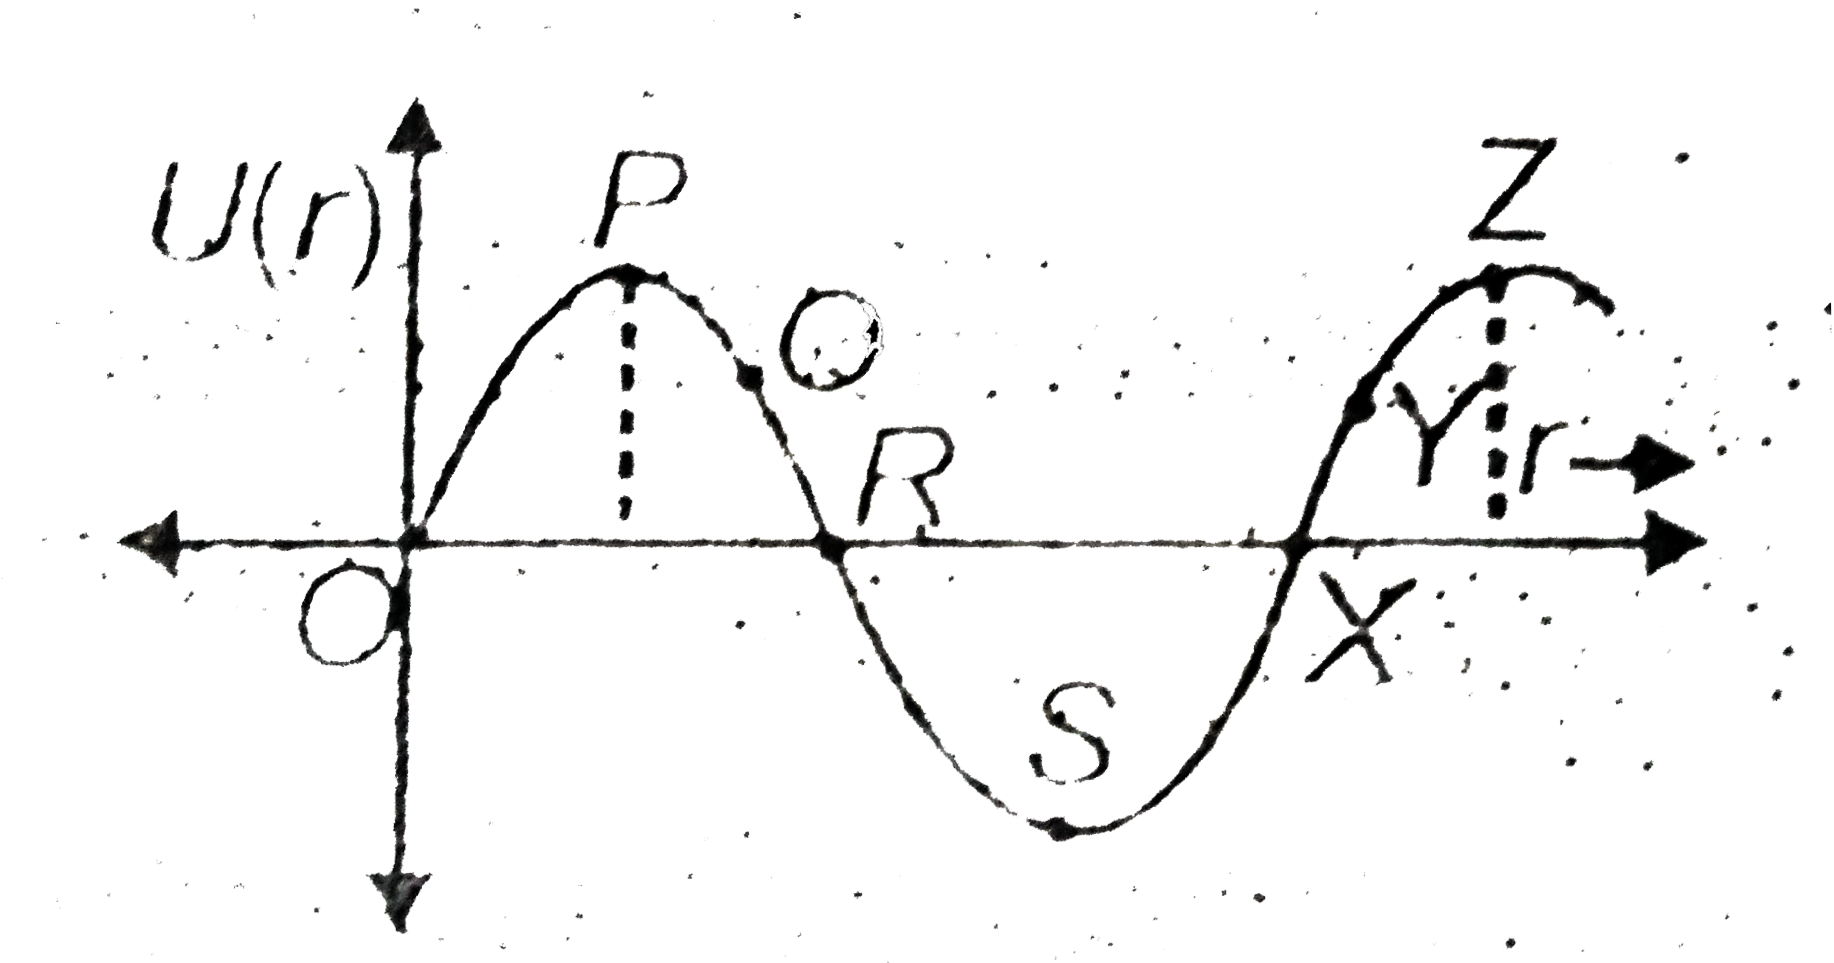
Which of the following conclusions are correct?View SolutionThe potential energy curve for interaction between two molecules is shown in figure. Which of the following statements are true?
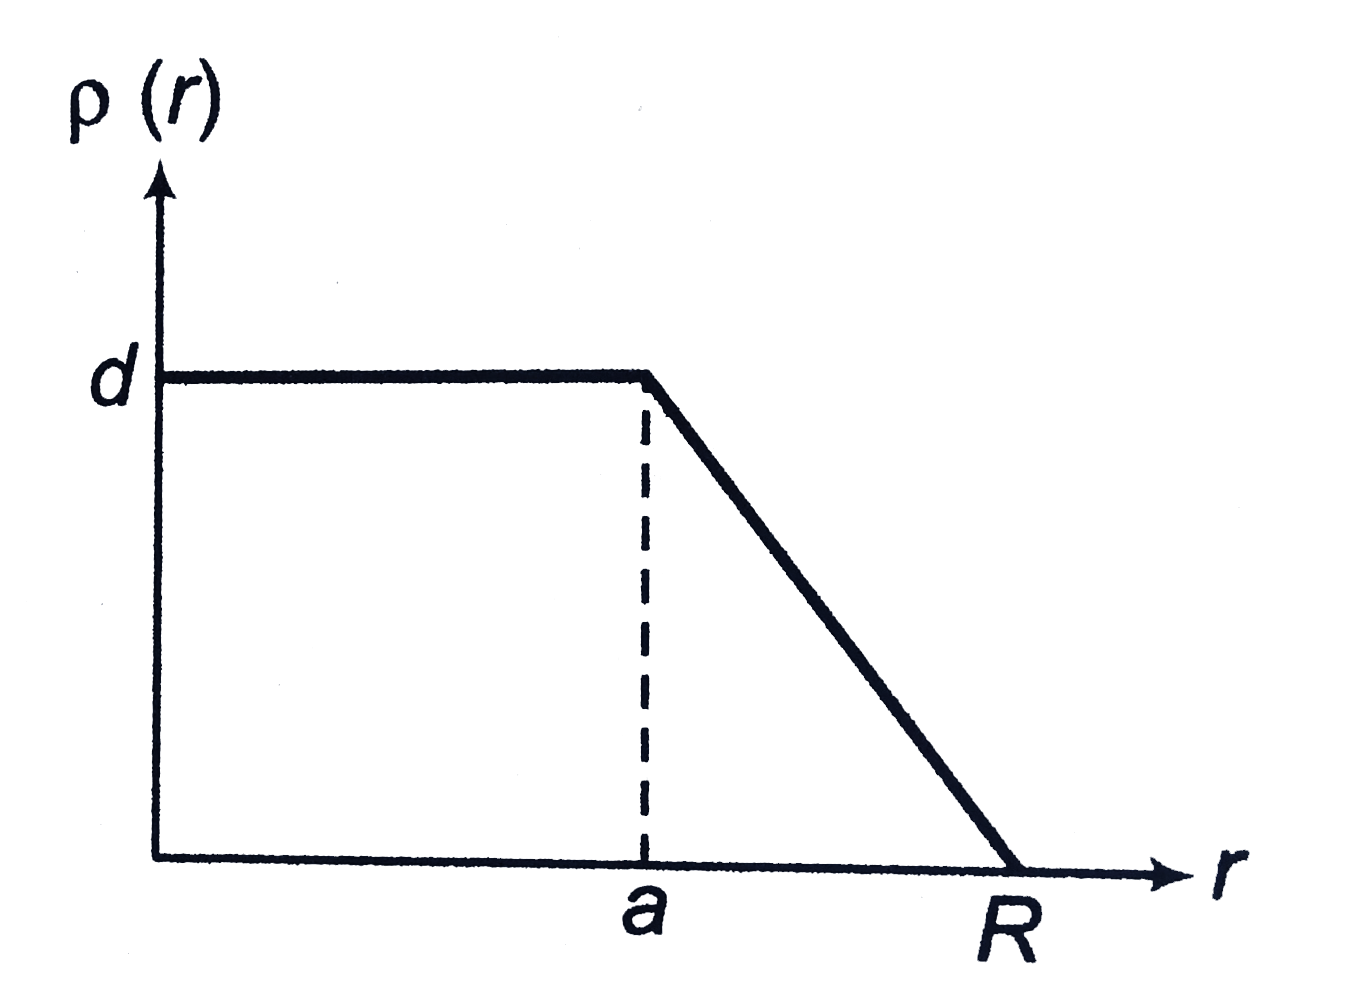
View SolutionThe nuclear charge (Ze) is non uniformlly distribute with in a nucleus of radius r. The charge densilty ρ(r) (charge per unit volume) is dependent only on the radial distance r form the centre of the nucleus s shown in figure. The electric field is only along the radial direction.
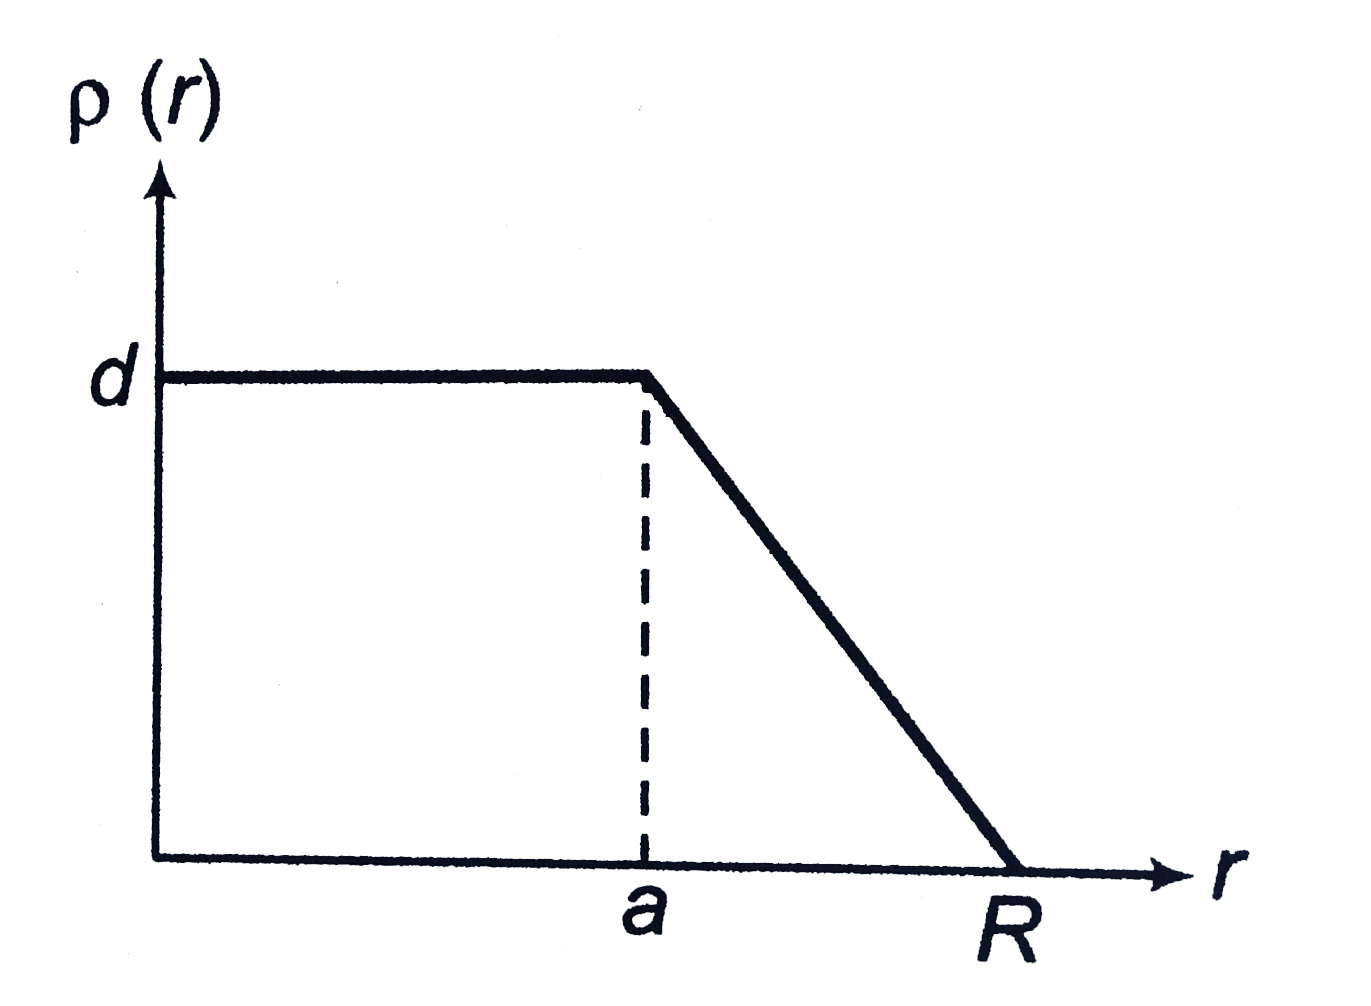
The electric field within the nucleus is generaly observed to be linearly dependent on r. This impliesView SolutionThe nuclear charge (Ze) is non uniformlly distribute with in a nucleus of radius r. The charge density ρ(r) (charge per unit volume) is dependent only on the radial distance r form the centre of the nucleus s shown in figure. The electric field is only along the radial direction.
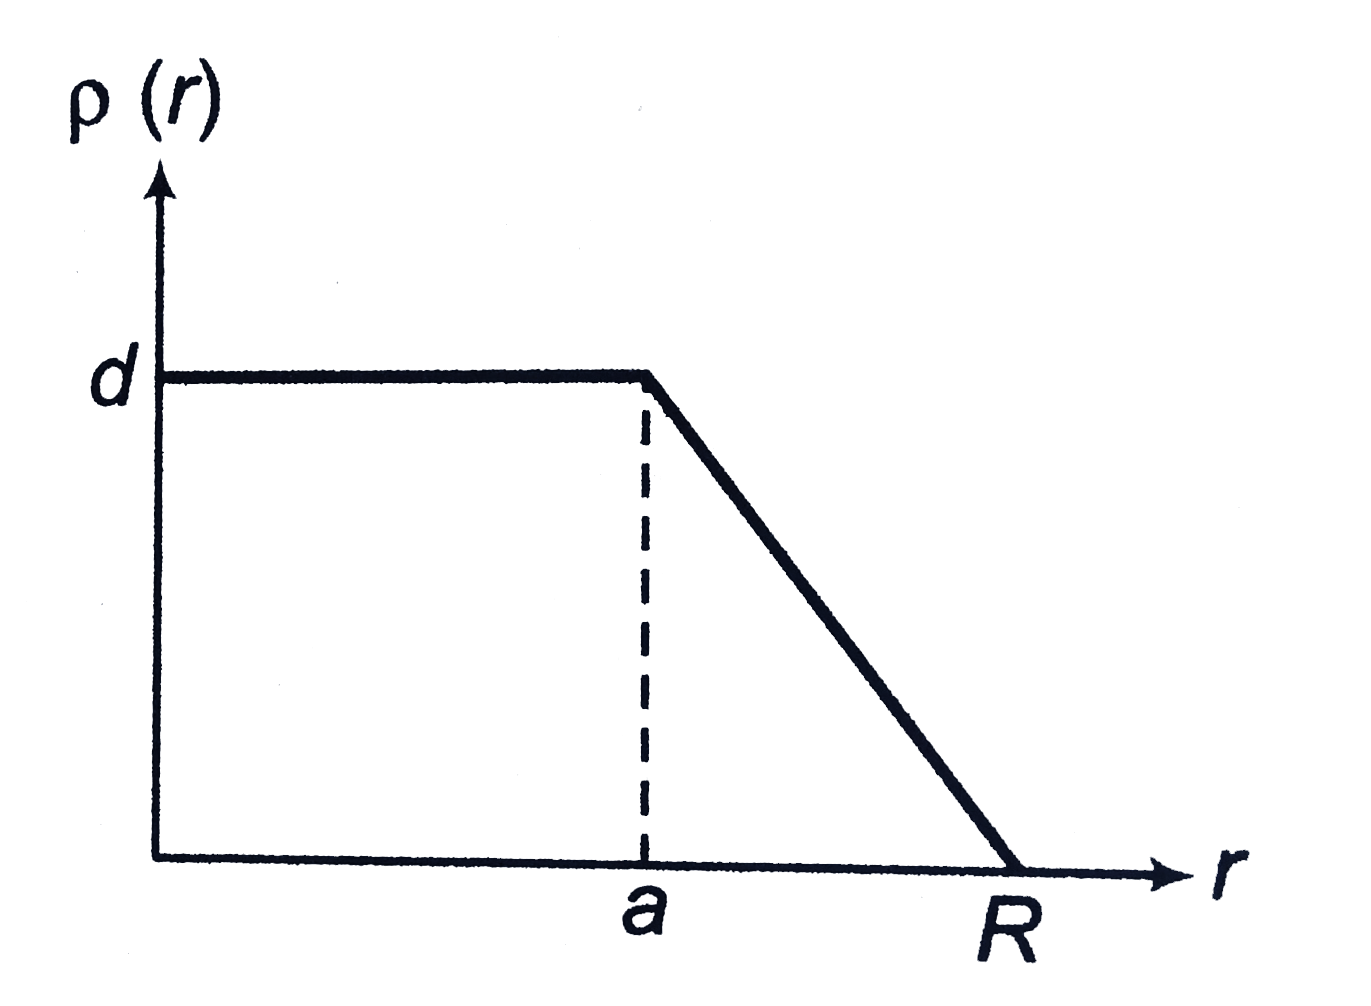
For a=0 the value of d (maximum value of ρ as shown in the figure) is
 View Solution
If V and u are electric potential and energy density, respectively, at a distance r from a positive point charge, then which of the following graph is correct ?
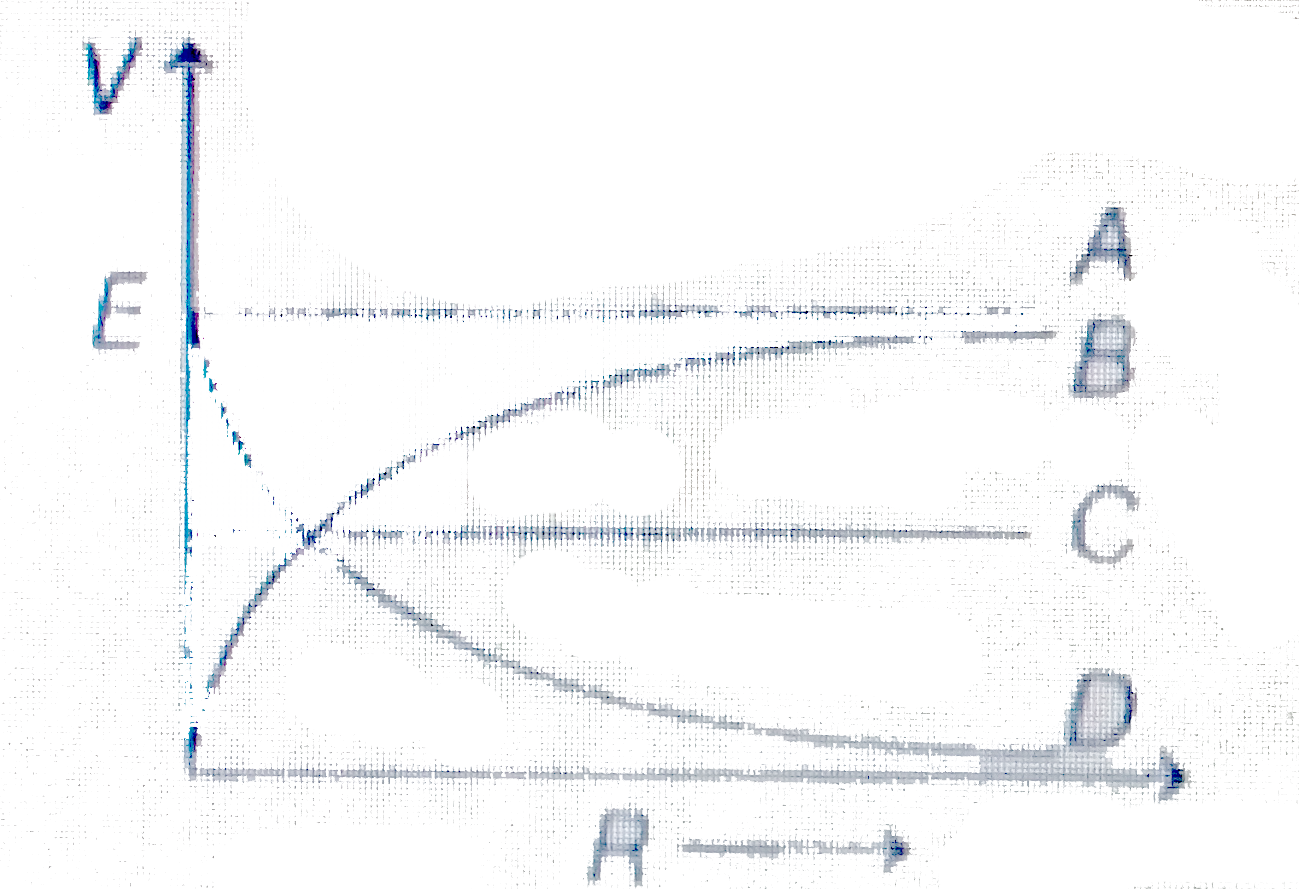
View SolutionA cell of emf E having an internal resistance R varies with R as shown in figure by the curve
 View Solution
The linear mass density , i.e mass per unit length of the rope as shown in figure , varies 0 to λ from one end to another . The acceleration of the combined system of figure will be
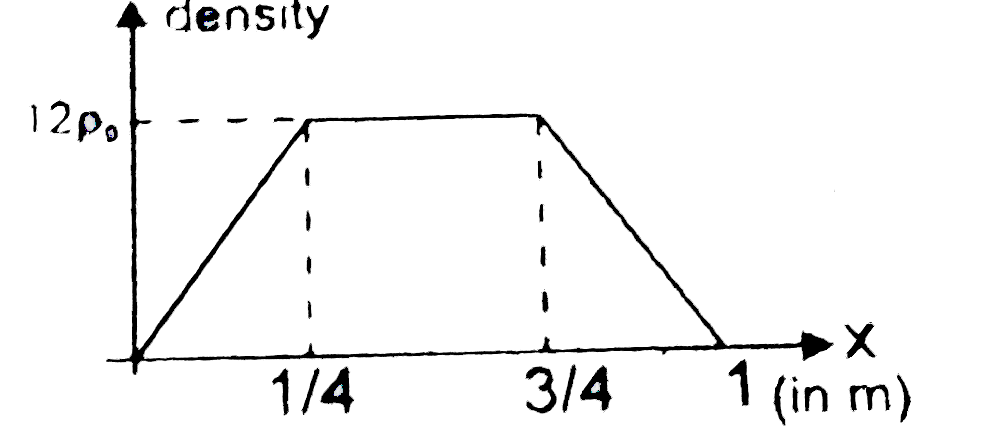
View SolutionThe volume charge density as a function of distance X from one face inside a unit cube is varying as shown in the figure. Find the total flux (in S.I. units) through the cube (If ρ0=8.85×10⁻¹²C/m3).
 View Solution
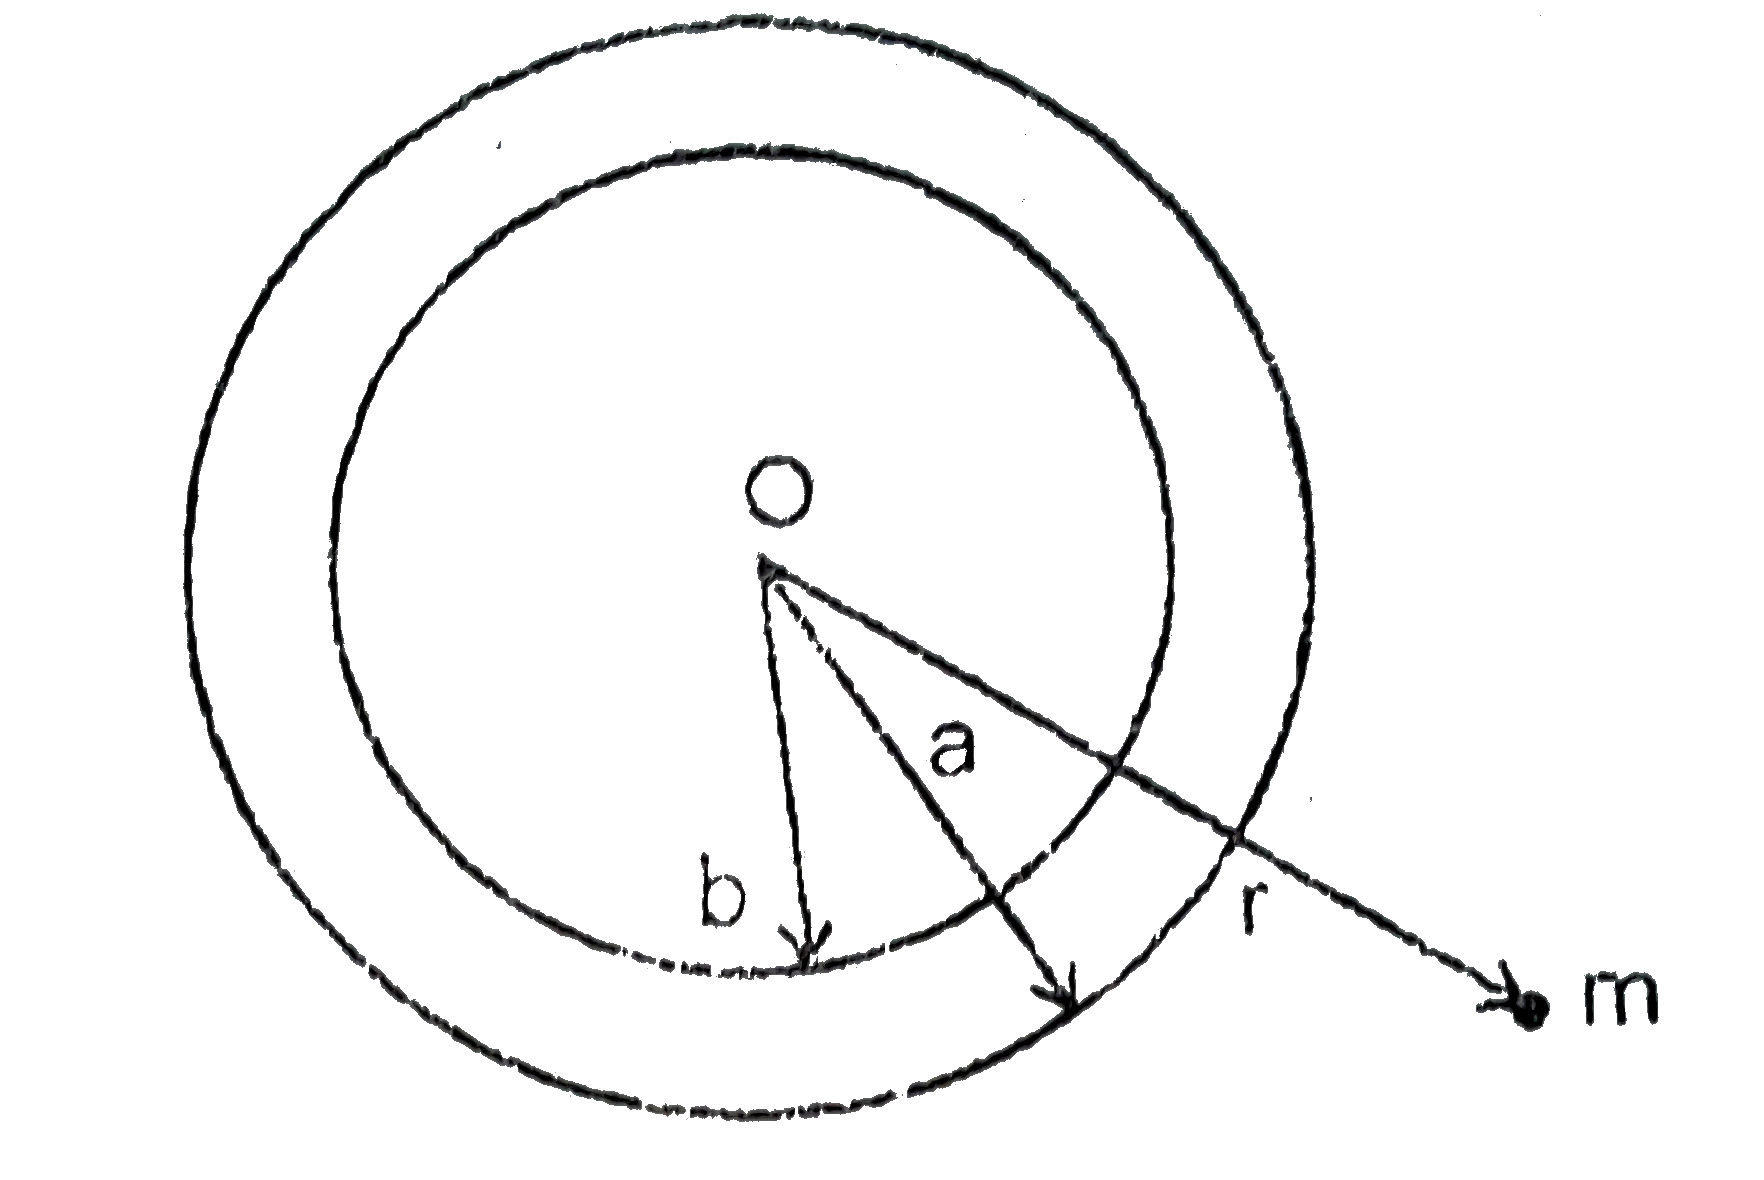
A sphere of density ρ and radius a has a concentric of radius b as shown in the
(a) Sketch the gravitational force exerted by the spehre on the particle of mass m located at a distance r from the centre of the sphere as a function of r in the range 0≤r≤∞
(b) Sketch the corresponding curve for the potential energy u (r) of the system
 ,View Solution

