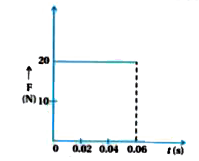
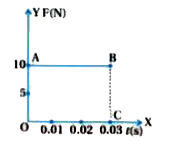
F → t graph for a body is shown in figure. The change in value of momentum of the body in the interval 0.02 s to 0.06 s is ..
 Solution in Gujrati
1.2 kg ms−1
0.3 kg ms−1
0.8 kg ms−1
0.4 kg ms−1
The correct Answer is:C
Change in value of momentum Δp=FΔt
f= 20 N and Δt=0.06−0.02=0.04s
∴,Δp=20×0.04=0.8kgms−1
Topper's Solved these Questions
- LAW OF MOTIONBOOK - KUMAR PRAKASHANCHAPTER - LAW OF MOTIONEXERCISE - SECTION-F (QUESTIONS FROM MODULE)
22 Videos
- LAW OF MOTIONBOOK - KUMAR PRAKASHANCHAPTER - LAW OF MOTIONEXERCISE - (QUESTION PAPER) SECTION-A
5 Videos
- LAW OF MOTIONBOOK - KUMAR PRAKASHANCHAPTER - LAW OF MOTIONEXERCISE - SECTION-D(NCERT EXEMPLAR SOLUTIONS)
42 Videos
- GRAVITATIONBOOK - KUMAR PRAKASHANCHAPTER - GRAVITATIONEXERCISE - QUESTIONS PAPER Section - D
1 Videos
- MACHANICAL PROPERTIES OF SOLIDS BOOK - KUMAR PRAKASHANCHAPTER - MACHANICAL PROPERTIES OF SOLIDS EXERCISE - QUESTION PAPER
11 Videos
Similar Questions
A block rests on a rough inclined plane making an angle of 30° with the horizontal. The coefficient of static friction between the block and the plane is 0.8. If the frictional force on the block is 10 N, the mass of the block ((in kg) is .......... (Take g = 10 m/s2)
View SolutionWhat is dynamics?
View SolutionA ball is moving with uniform translatory motion. This means that
View SolutionA spaceship is stationed on Mars. How much energy must be expended on the spaceship to launch it out of the solar system ? Mass of the spaceship = 1000 kg, mass of the sun =2×1030kg, mass of mars =6.4×10²³kg, radius of mars = 3395 km, radius of the orbit of mars =2.28×10⁸km,G=6.67×10⁻¹¹Nm2kg2
View SolutionWhat is called brittle material ?
View SolutionIn figure shown, the graph shows the variation of acceleration of body with time t . The velcocity of the body at t = 0 is zero. The velocity of the body at t = 30 s is.
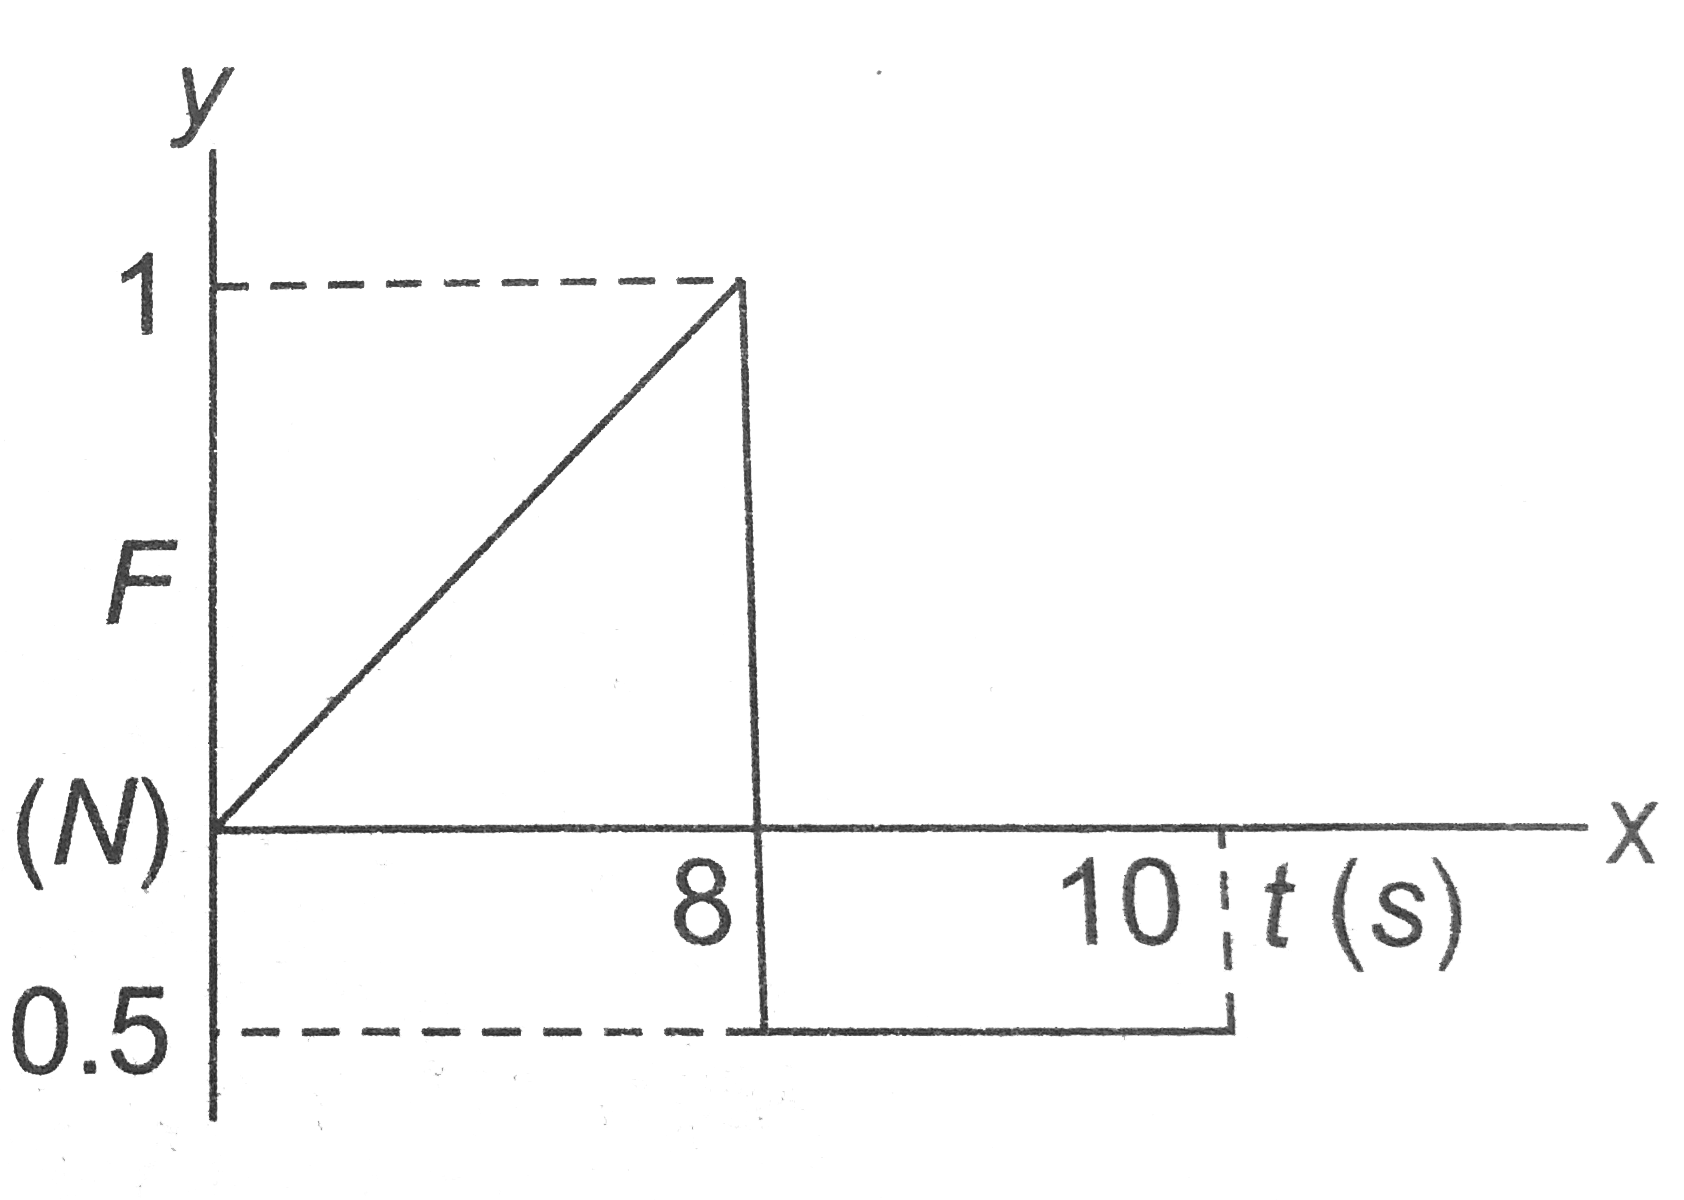
View SolutionA force-time graph for the motion of a body is shown in the figure. The change in the momentum of the body between zero and 10sec is
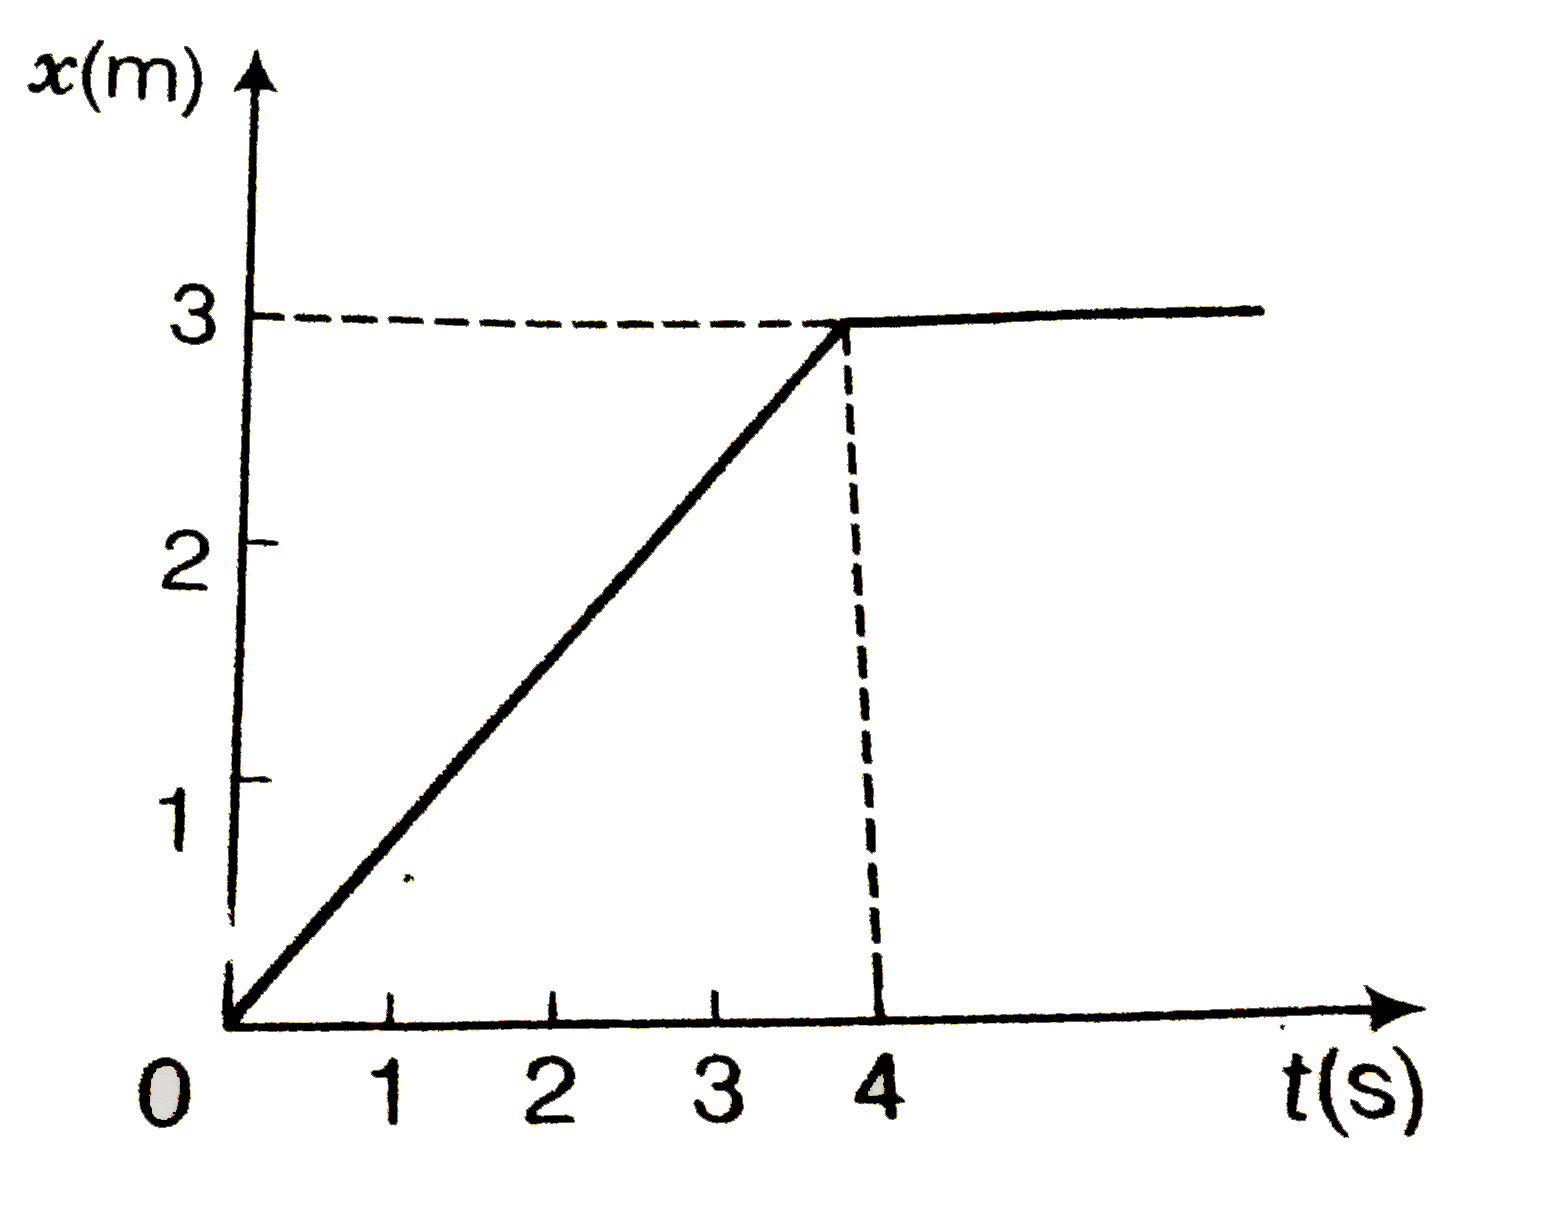
View SolutionThe position-time graph of a body of mass 2 kg is as given in figure . What is the impulse on the body at t = 0 s and t = 4 s .
View SolutionA force-time graph for the motion of a body is shown in fig. change in linear momentum between 0 and 8 s is:-

View SolutionThe velocity of a body of mass 5 kg changes from 20 m/s to 10 /s. calculate the change of momentum of the body.
View SolutionA force-time graph for the motion of a body is shown in figure. Change in linear momentum between 0 and 8 s is:
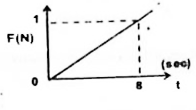
View SolutionA force-time graph for the motion of a body is shown in figure. Change in linear momentum between 0 and 8 s, is:
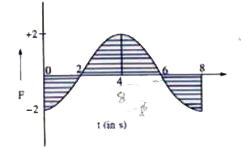
View SolutionF→t graph for a body is shown in the . What is the change in the value of momentum in the intital tie interval of 0.03 sec .
View SolutionThe position-time graph of a body of mass 2 kg is as given in figure . What is the impulse on the body at t = 0 s and t = 4 s .
View Solution2kg द्रव्यमान के किसी पिंड का स्थिति समय ग्राफ चित्र में दर्शाया गया है। t = 0 s और t = 4 s पर पिंड का आवेग कितना है ?
View Solution
