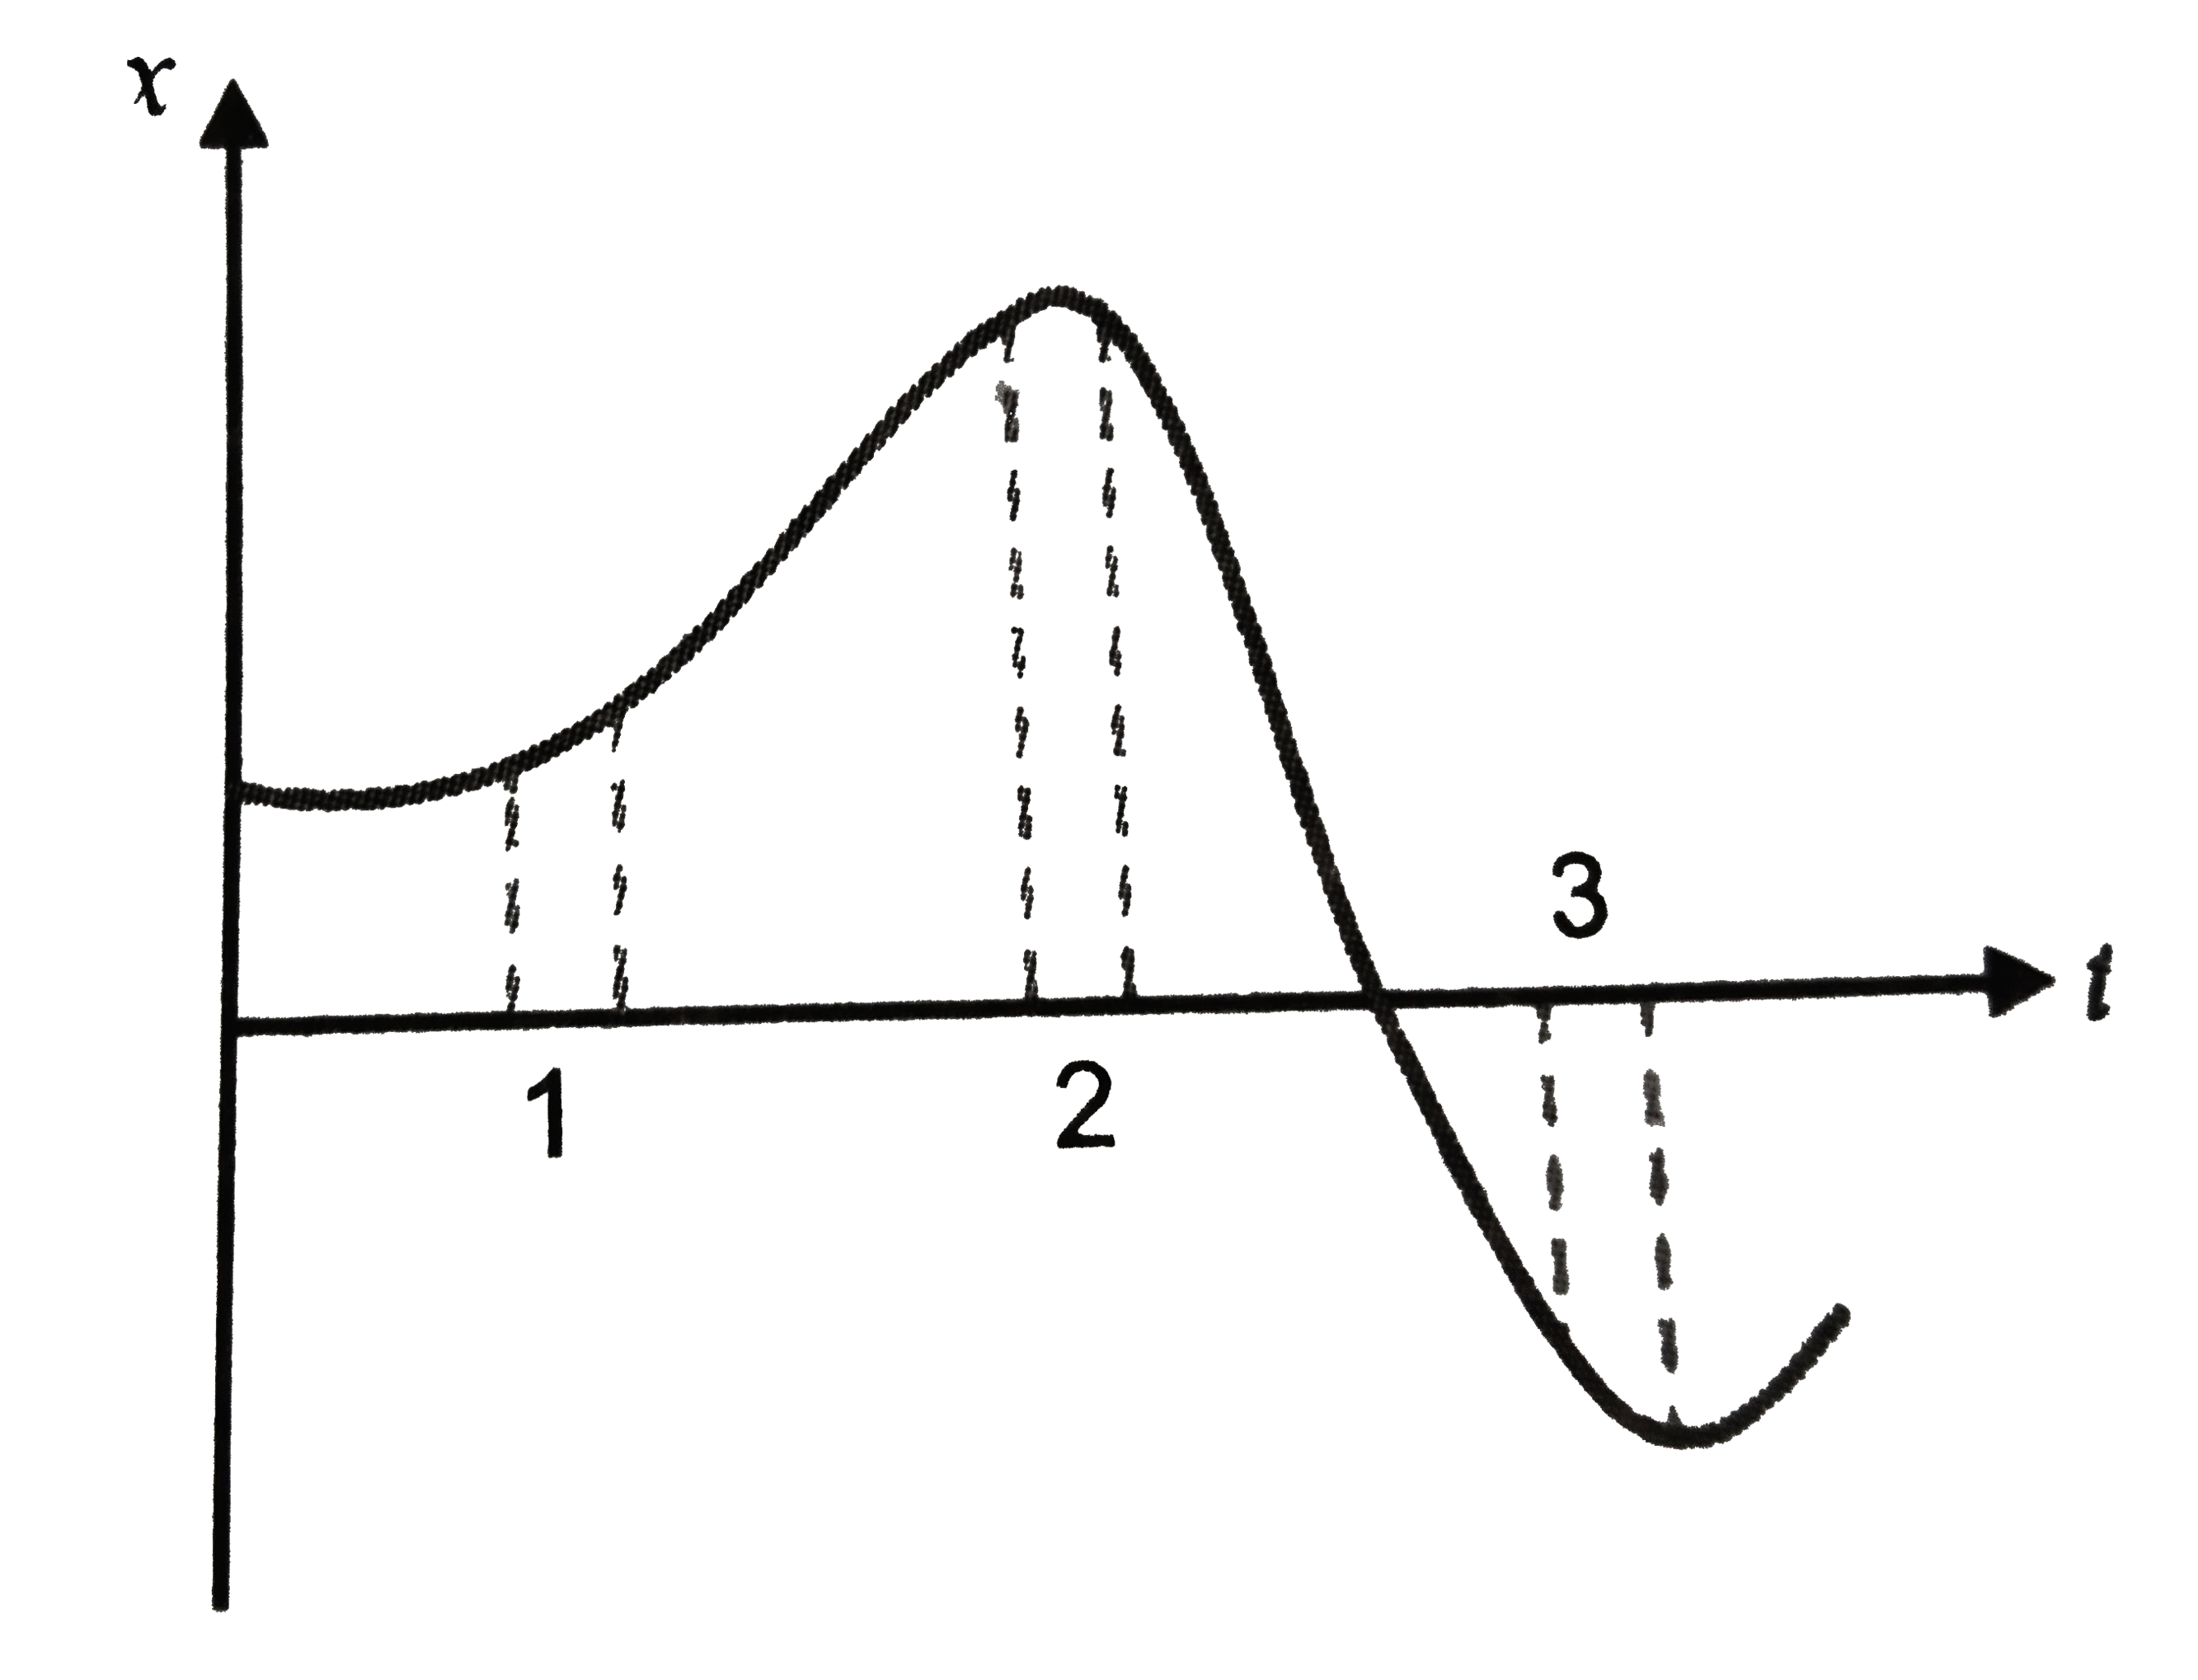
Fig. show the x−t plot of a particle in one dimensional motion. Three different equal intervals of time are shown. In which interval the average speed is greatest and in which it is the least? Give the sign of average speed for each interval.
 .
.
Interval 3 (Greatest), Interval 2 (Least)
Positive (Intervals 1 & 2), Negative (Interval 3)
The average speed of a particle shown in the x–t graph is obtained from the slope of the graph in a particular interval of time.
It is clear from the graph that the slope is maximum and minimum restively in intervals 3 and 2 respectively. Therefore, the average speed of the particle is the greatest in interval 3 and is the least in interval 2. The sign of average velocity is positive in both intervals 1 and 2 as the slope is positive in these intervals. However, it is negative in interval 3 because the slope is negative in this interval
Topper's Solved these Questions
Similar Questions
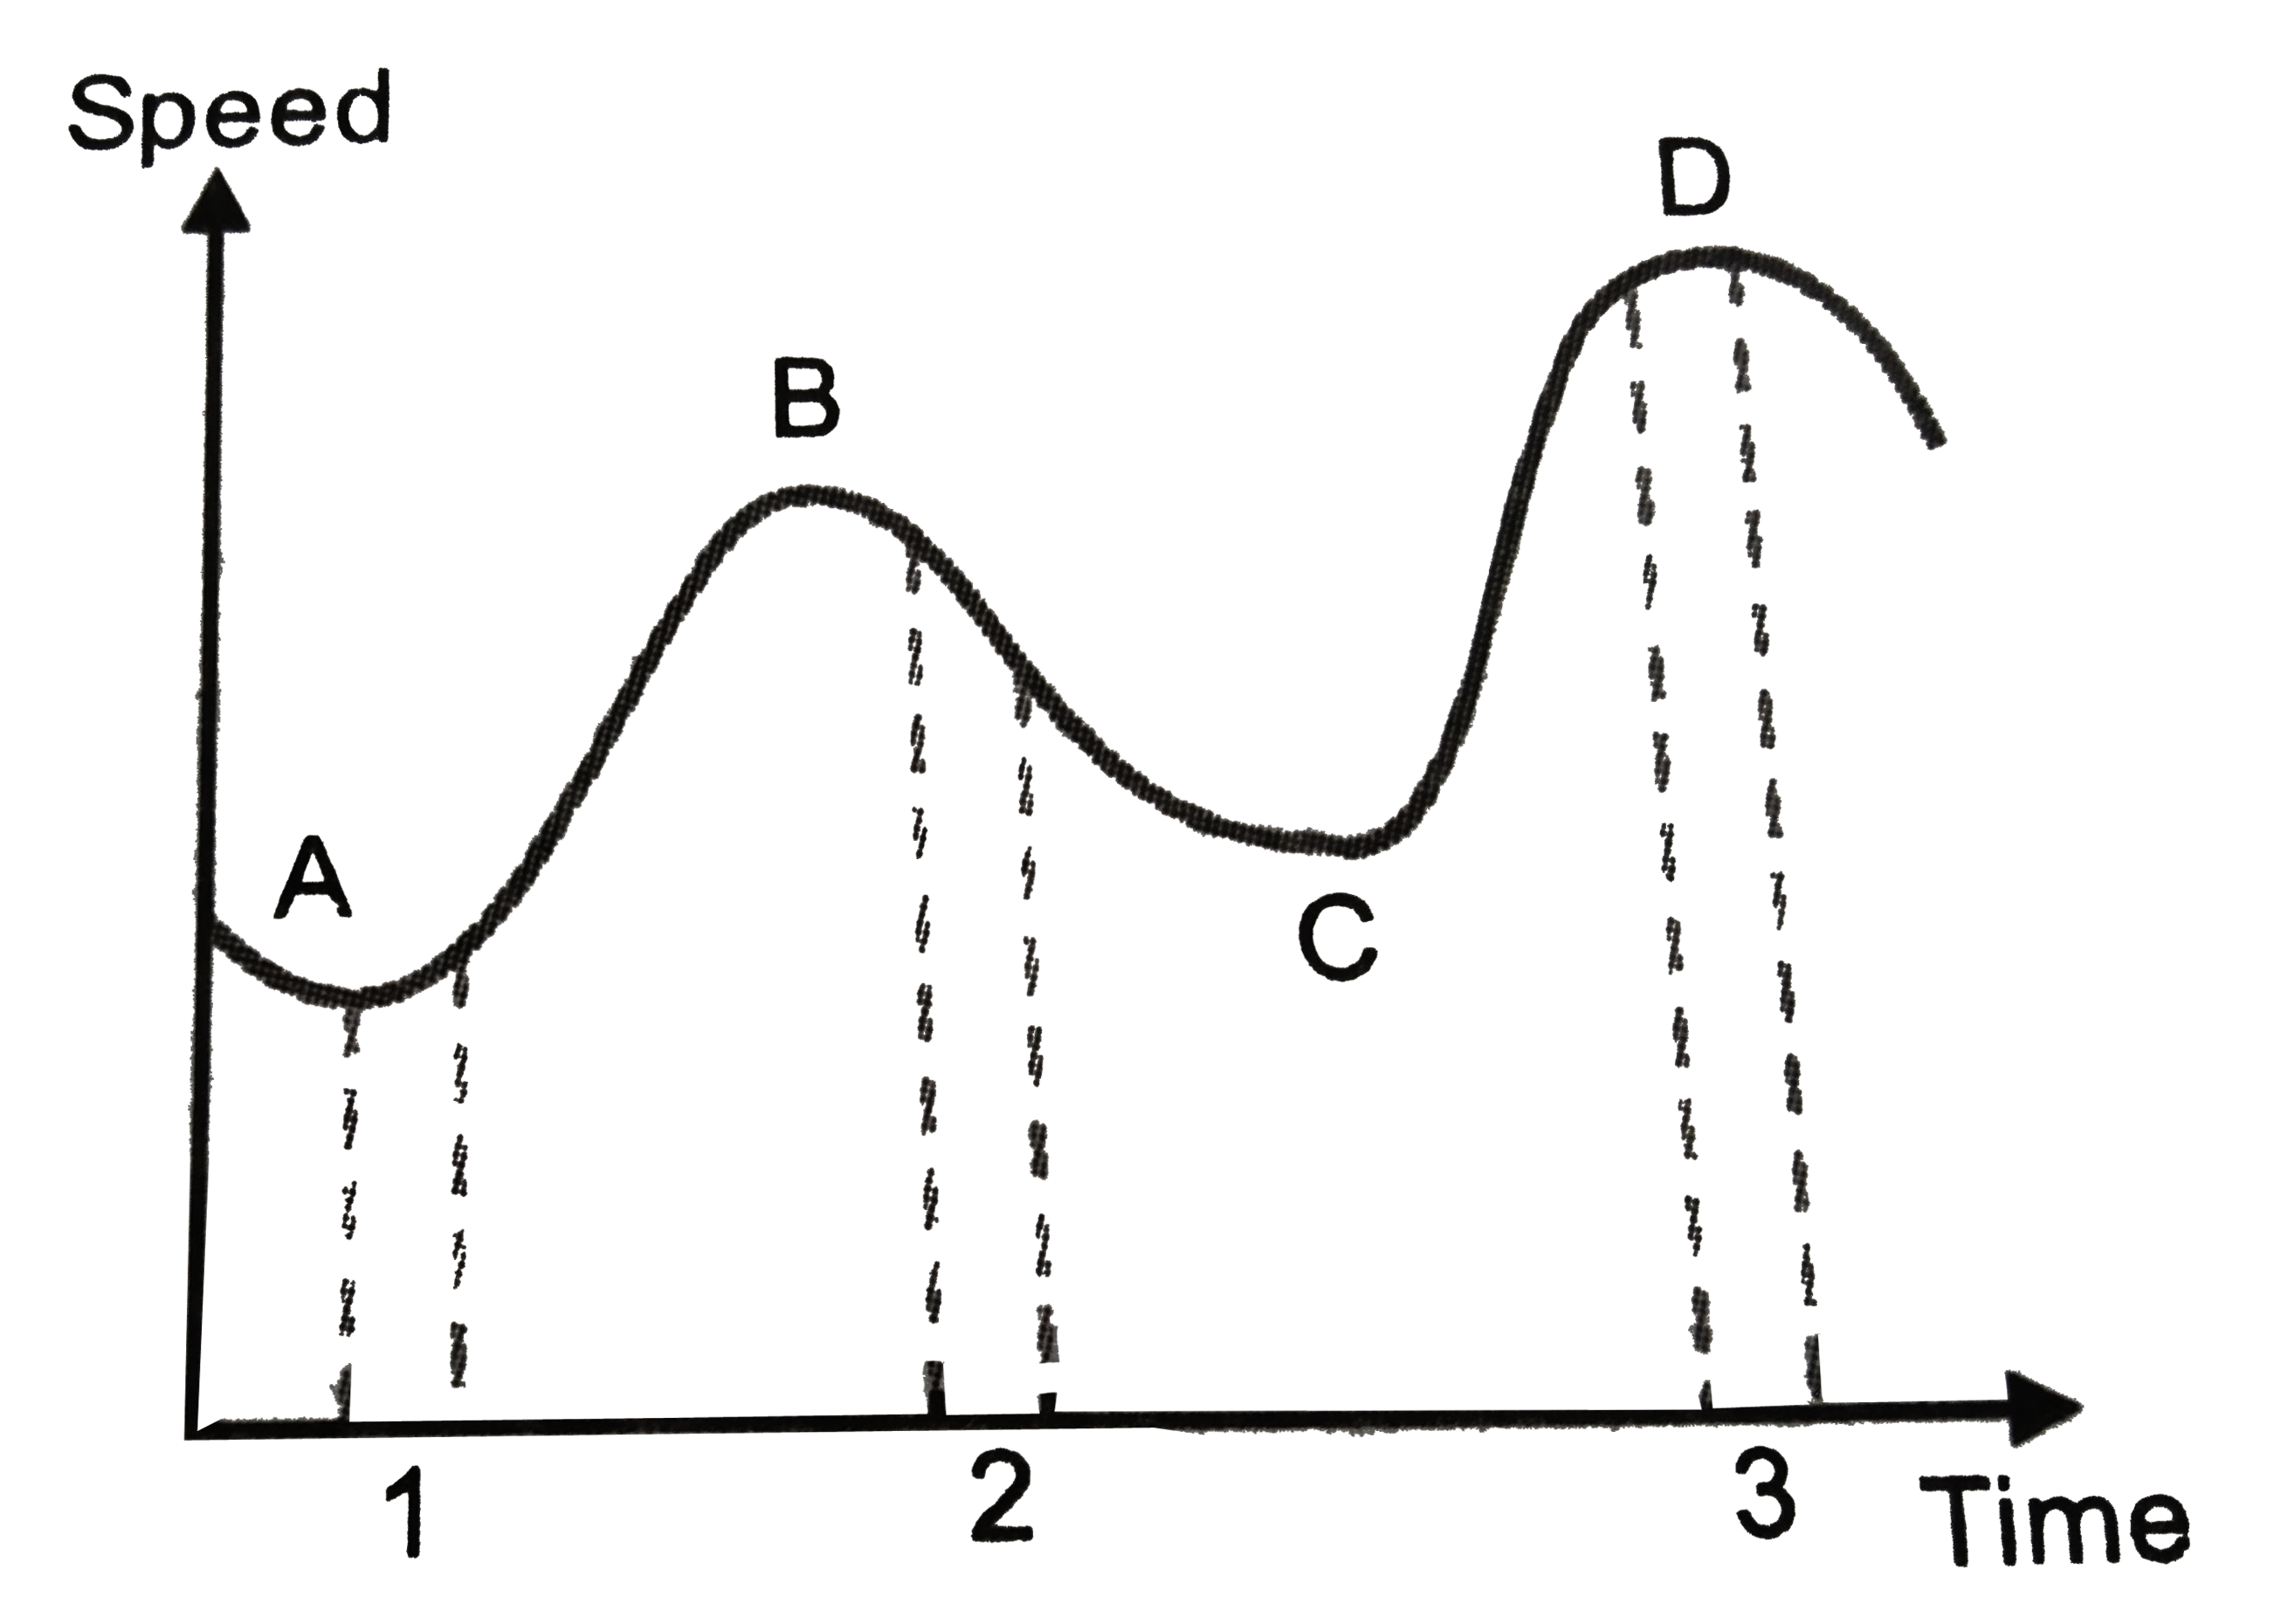
Given a speed-time graph of a particle in motion along a constant direction. Three equal intervals of time are shown. In which interval is the average acceleration greatest in magnitude? In which interval is the average speed greatest? Choosing the positive direction as the constant direction of motion, give the signs of v and a in the three intervals. What are the accelerations at the points A,B,C and D ?
 .
.
View SolutionFigure shows the velocity of a particle moving on x-axis.
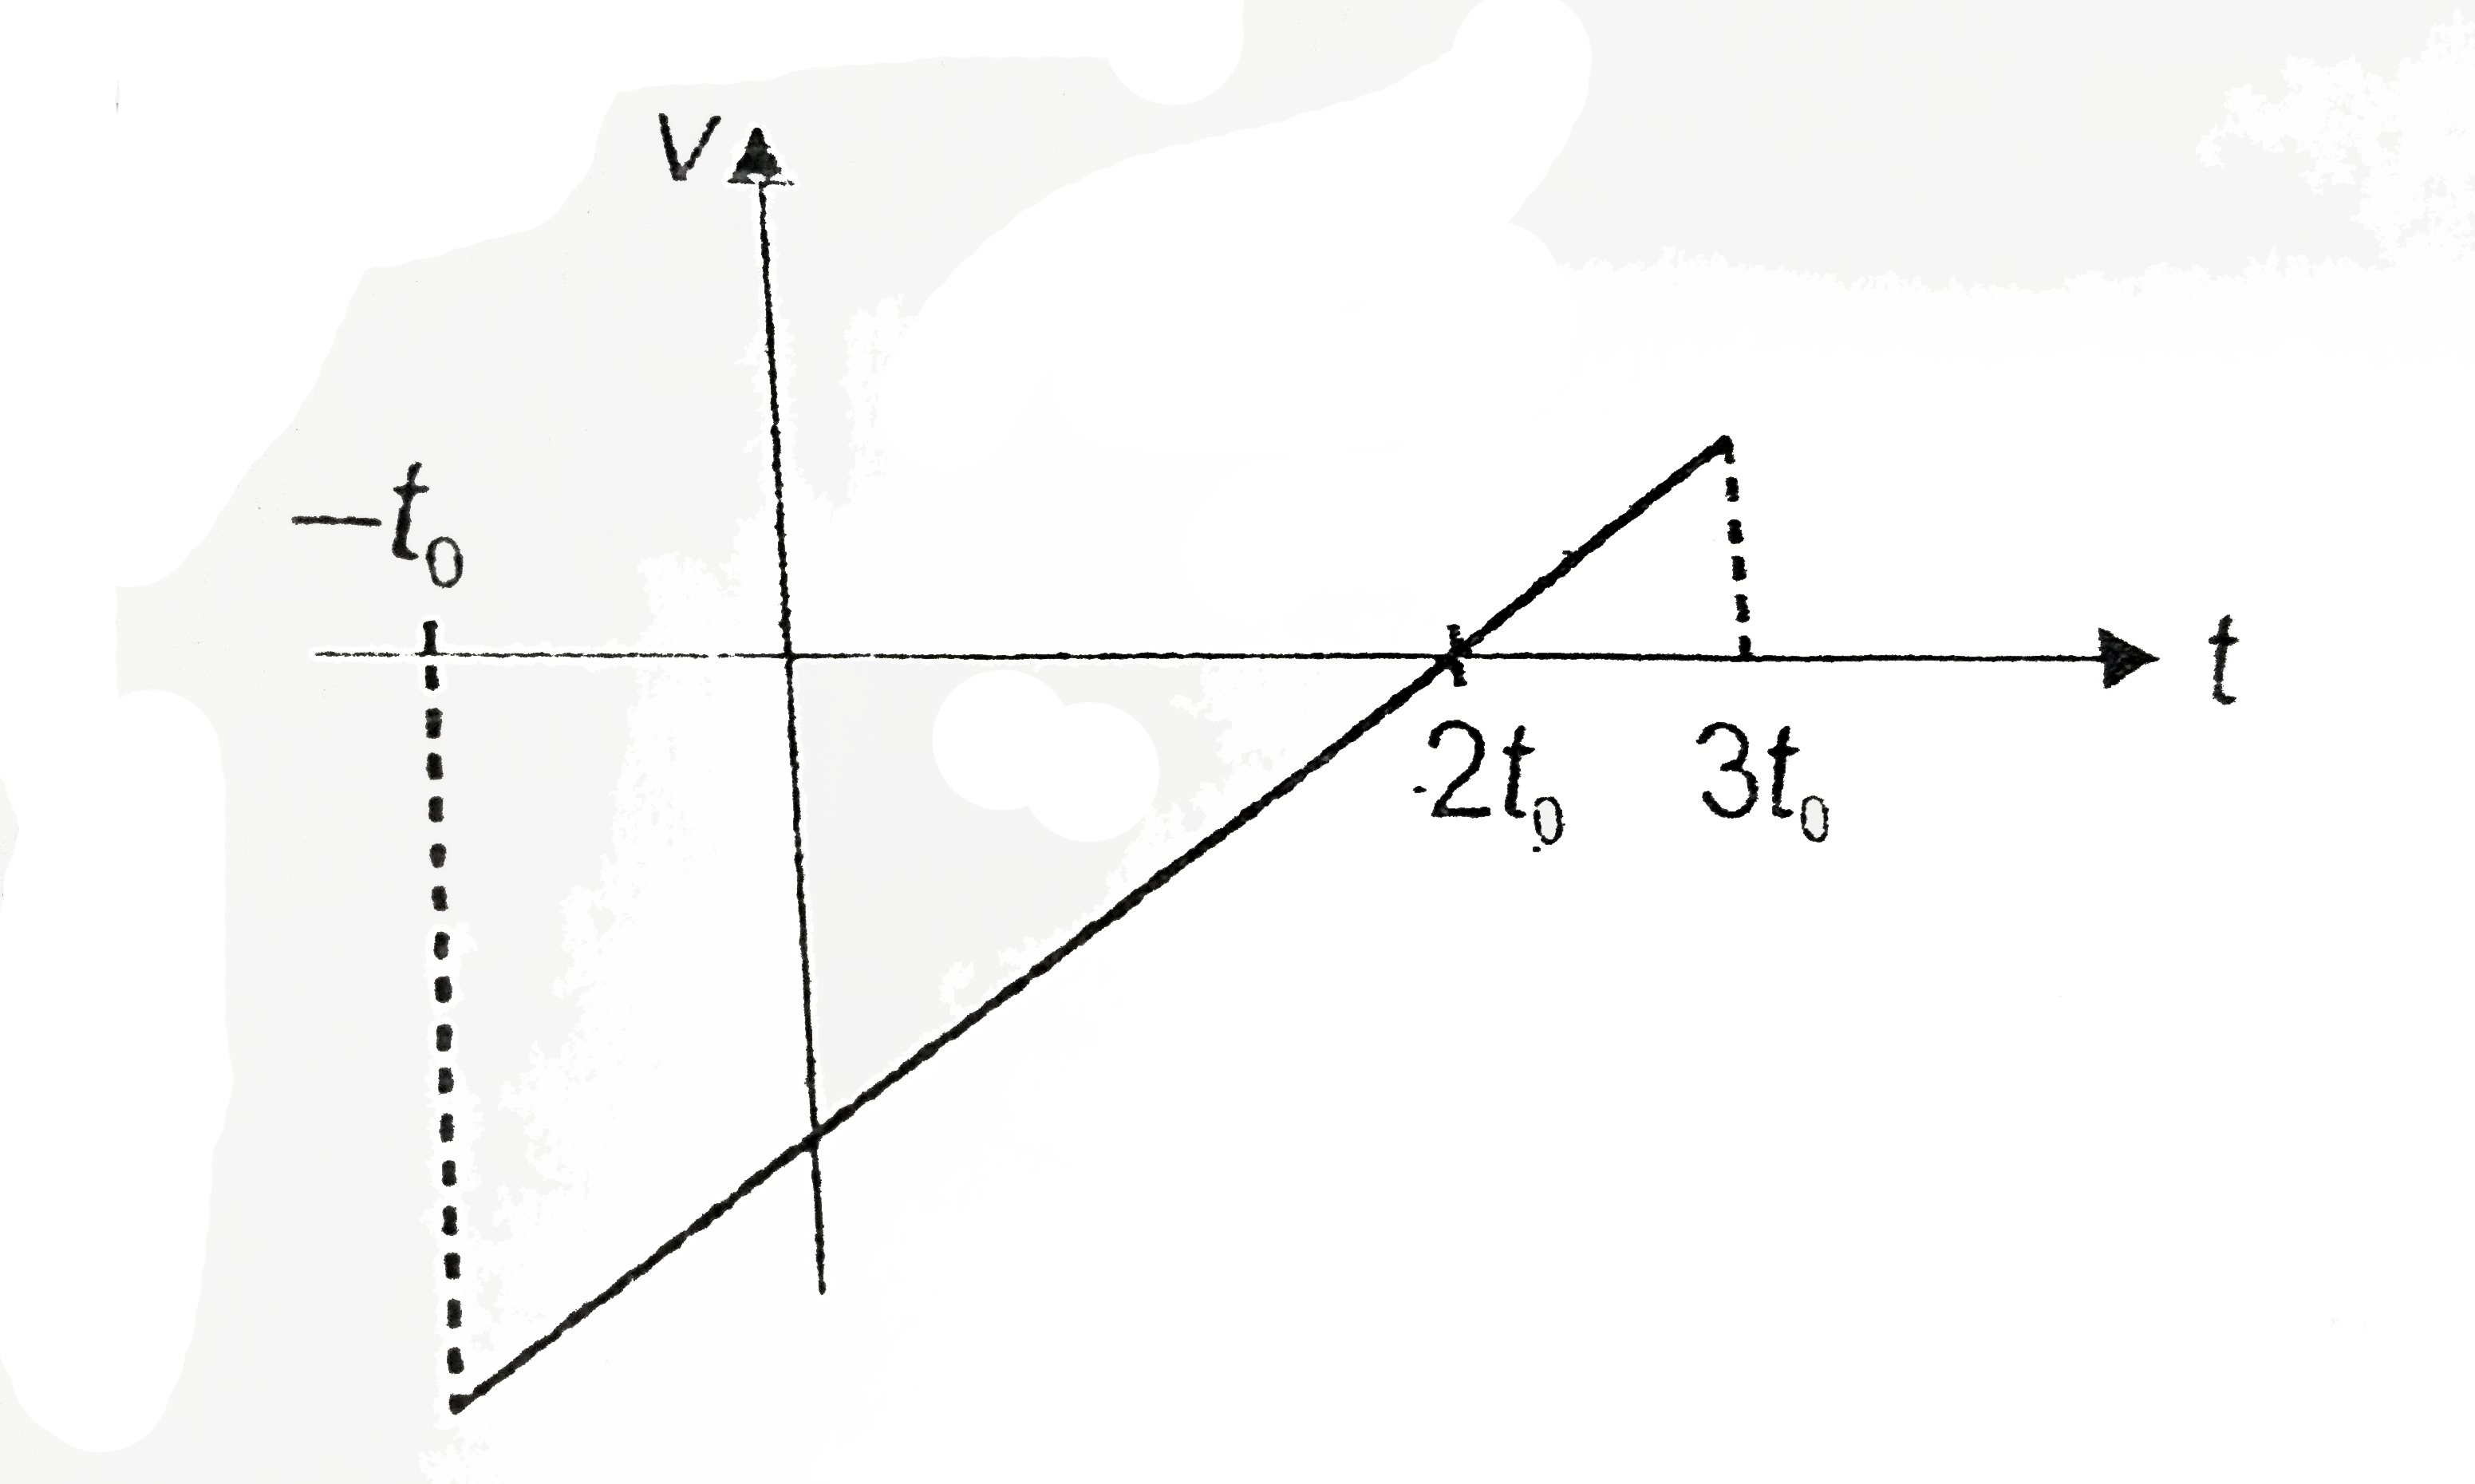
Which of the following statement is correct for the interval shown in graph?
View Solution
Knowledge Check
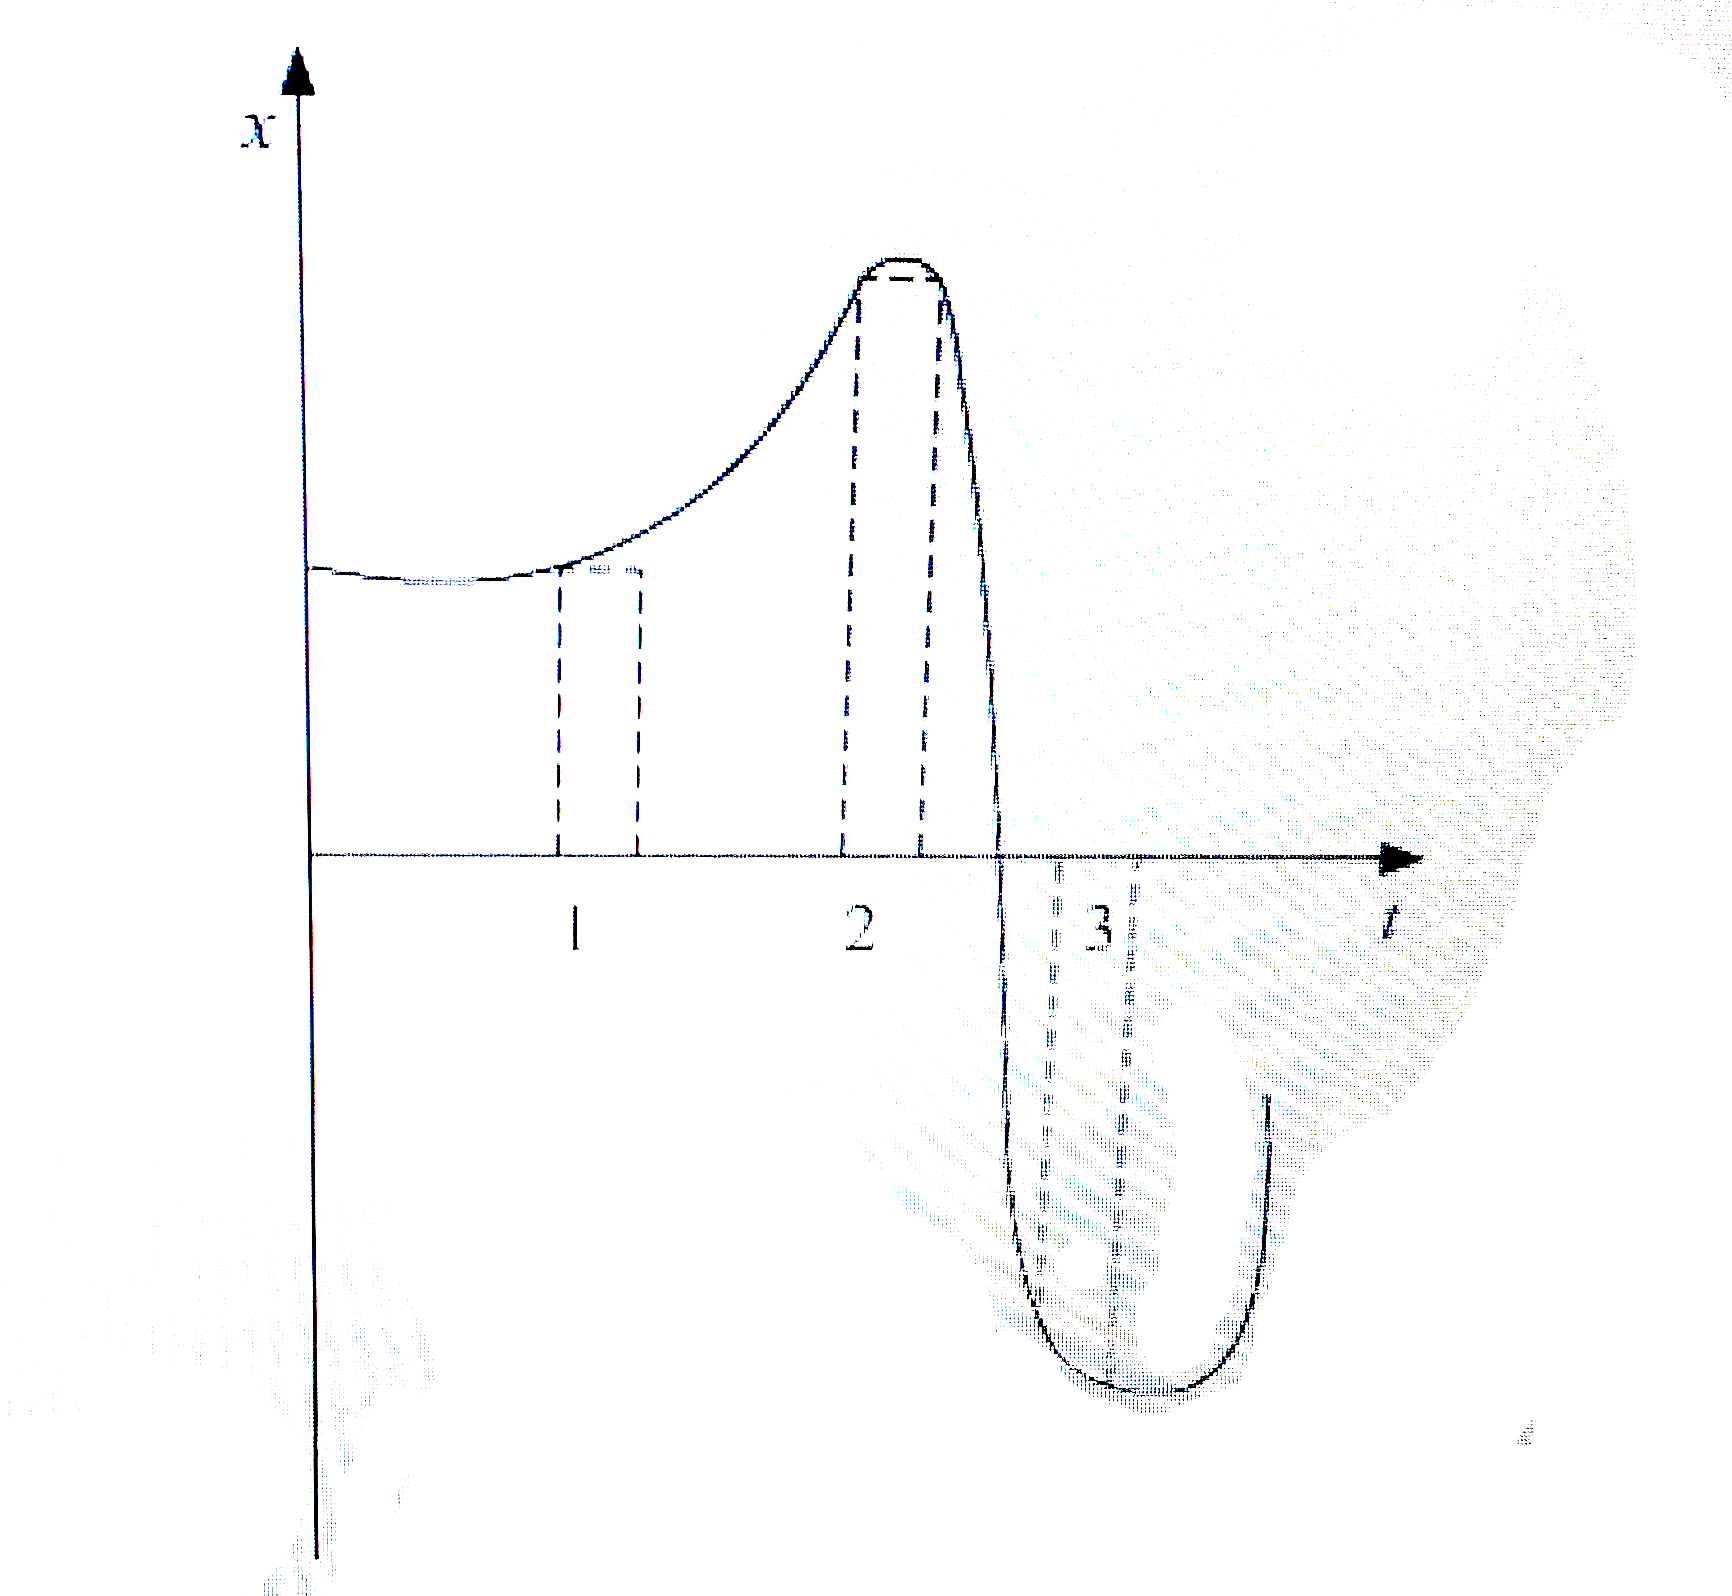
Figure 3.24 gives the x−t plot of a particle in one-dimensional motion. Three different equal intervals of time are shown. In which interval is the average speed greatest, and in which is it the least ? Give the sign of average velocity for each interval.
 Aν1 gt ν2Bν2>ν1Cν1=ν2Ddata is insufficient
The velocity-time graph of a particle in one-dimensional motion is shown in the figure. Which of the following formulae is correct for describing the motion of the particle over the time interval t1 to t2?
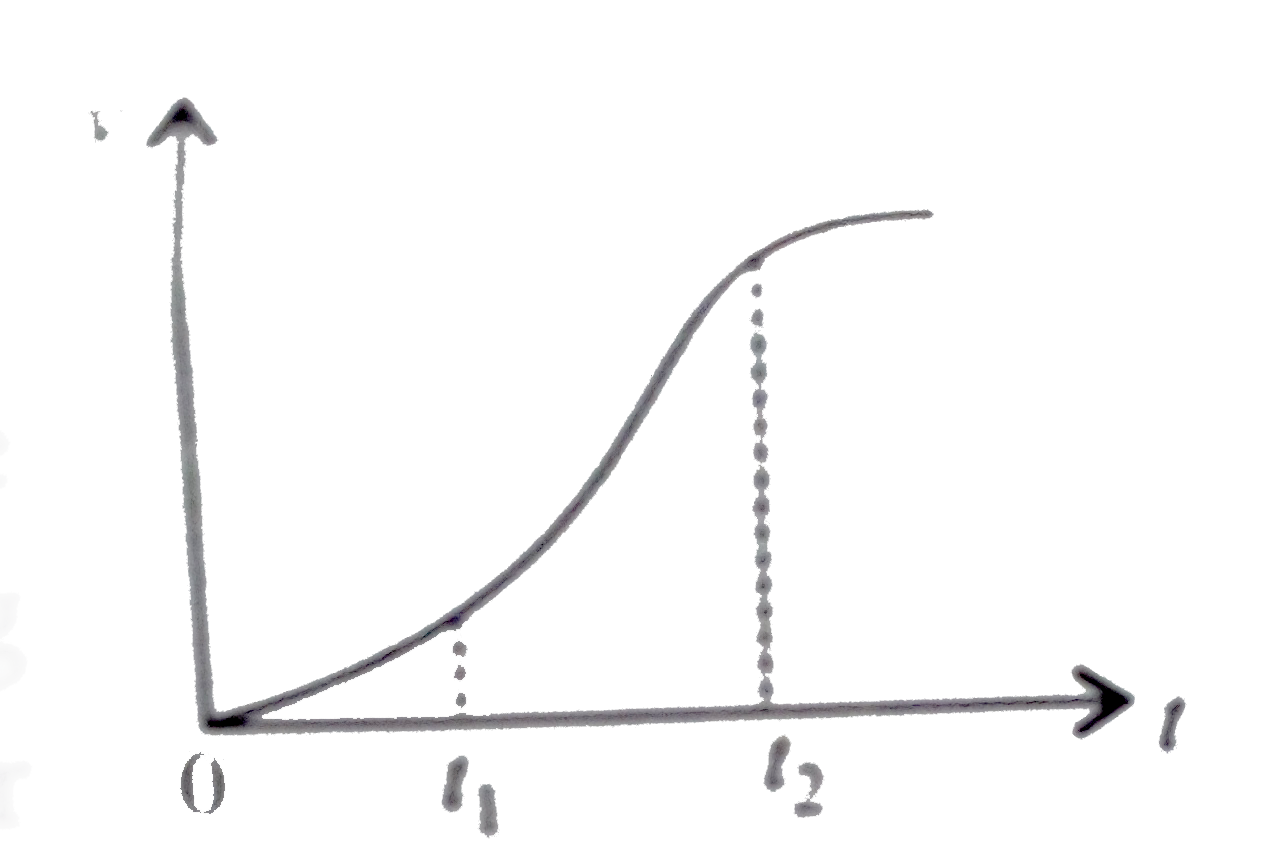 Ax(t2)=x(t1)+v(t1)(t2−t1)+(12)a(t2−t1)2Bv(t2)=v(t1)+a(t2−t1)Cvaverage=x(t2)+x(t1)t2−t1Daaverage=v(t2)−v(t1)t2−t1
s-t graph of a particle in motion is shown in Fig. Calculate
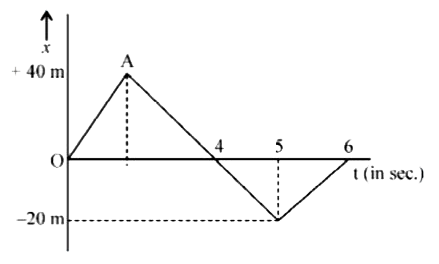
Average speed
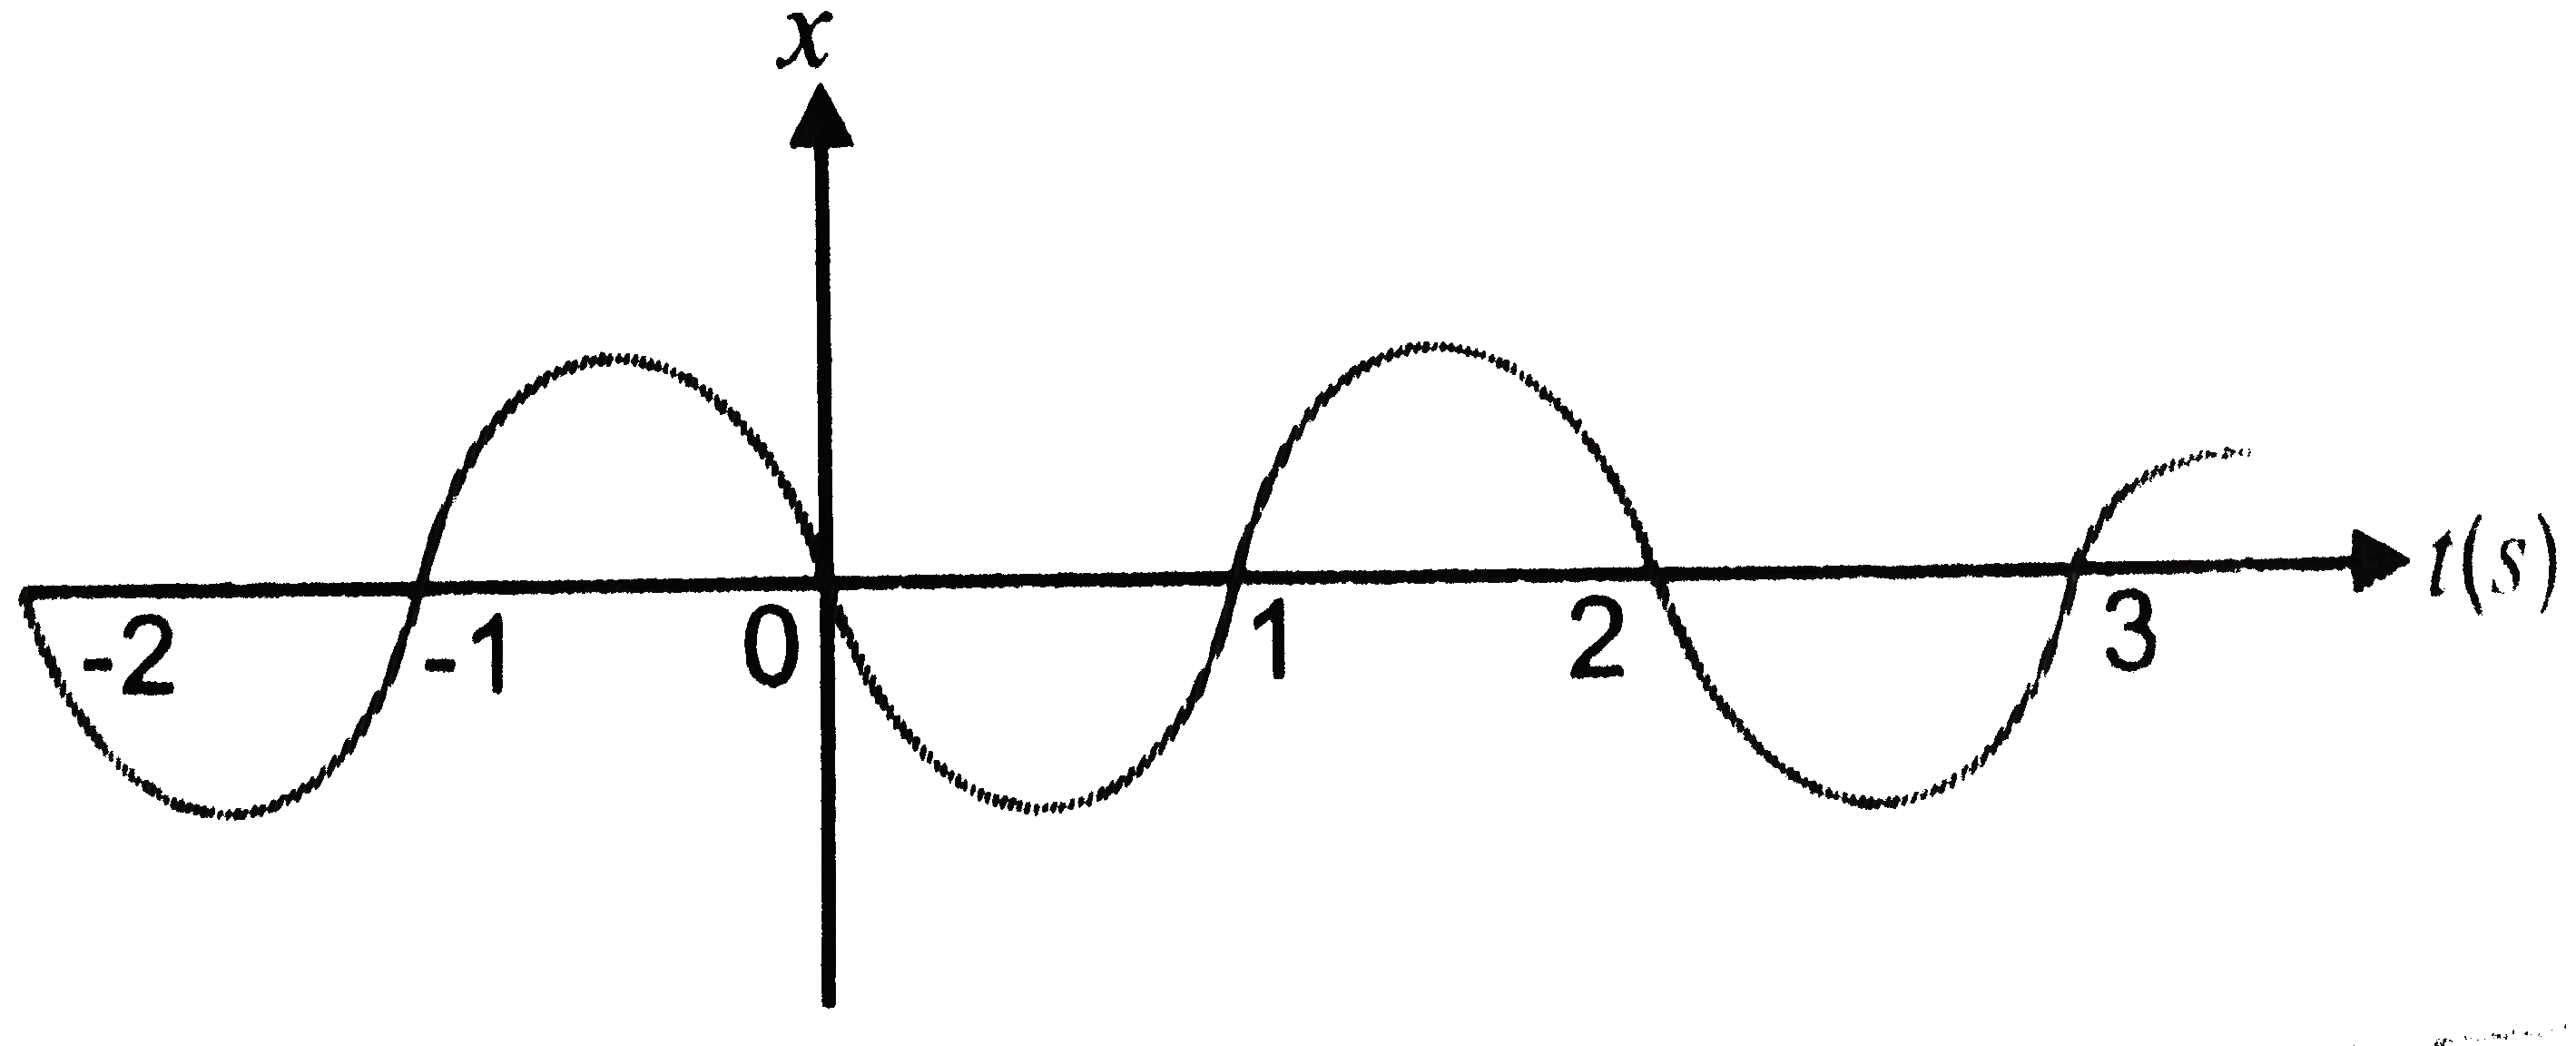
View SolutionFig gives the x−t plot of a particle executing one dimensional simple harmonic motion. Give the signs of position, velocity and acceleration variables of the particles at t=0.3s, 1.2s,−1.2s,
View SolutionAssertion: The average velocity of a particle is zero in a time interval. It is possible that the instantaneous acceleration is never zero in the interval.
Reason: The magnitude of average velocity in an interval is equal to its average speed in that interval.
View SolutionThe speed-time graph of a particle moving along a fixed direction is shown in the Fig. The distance traversed by the particle between (a) t=0s→10s .
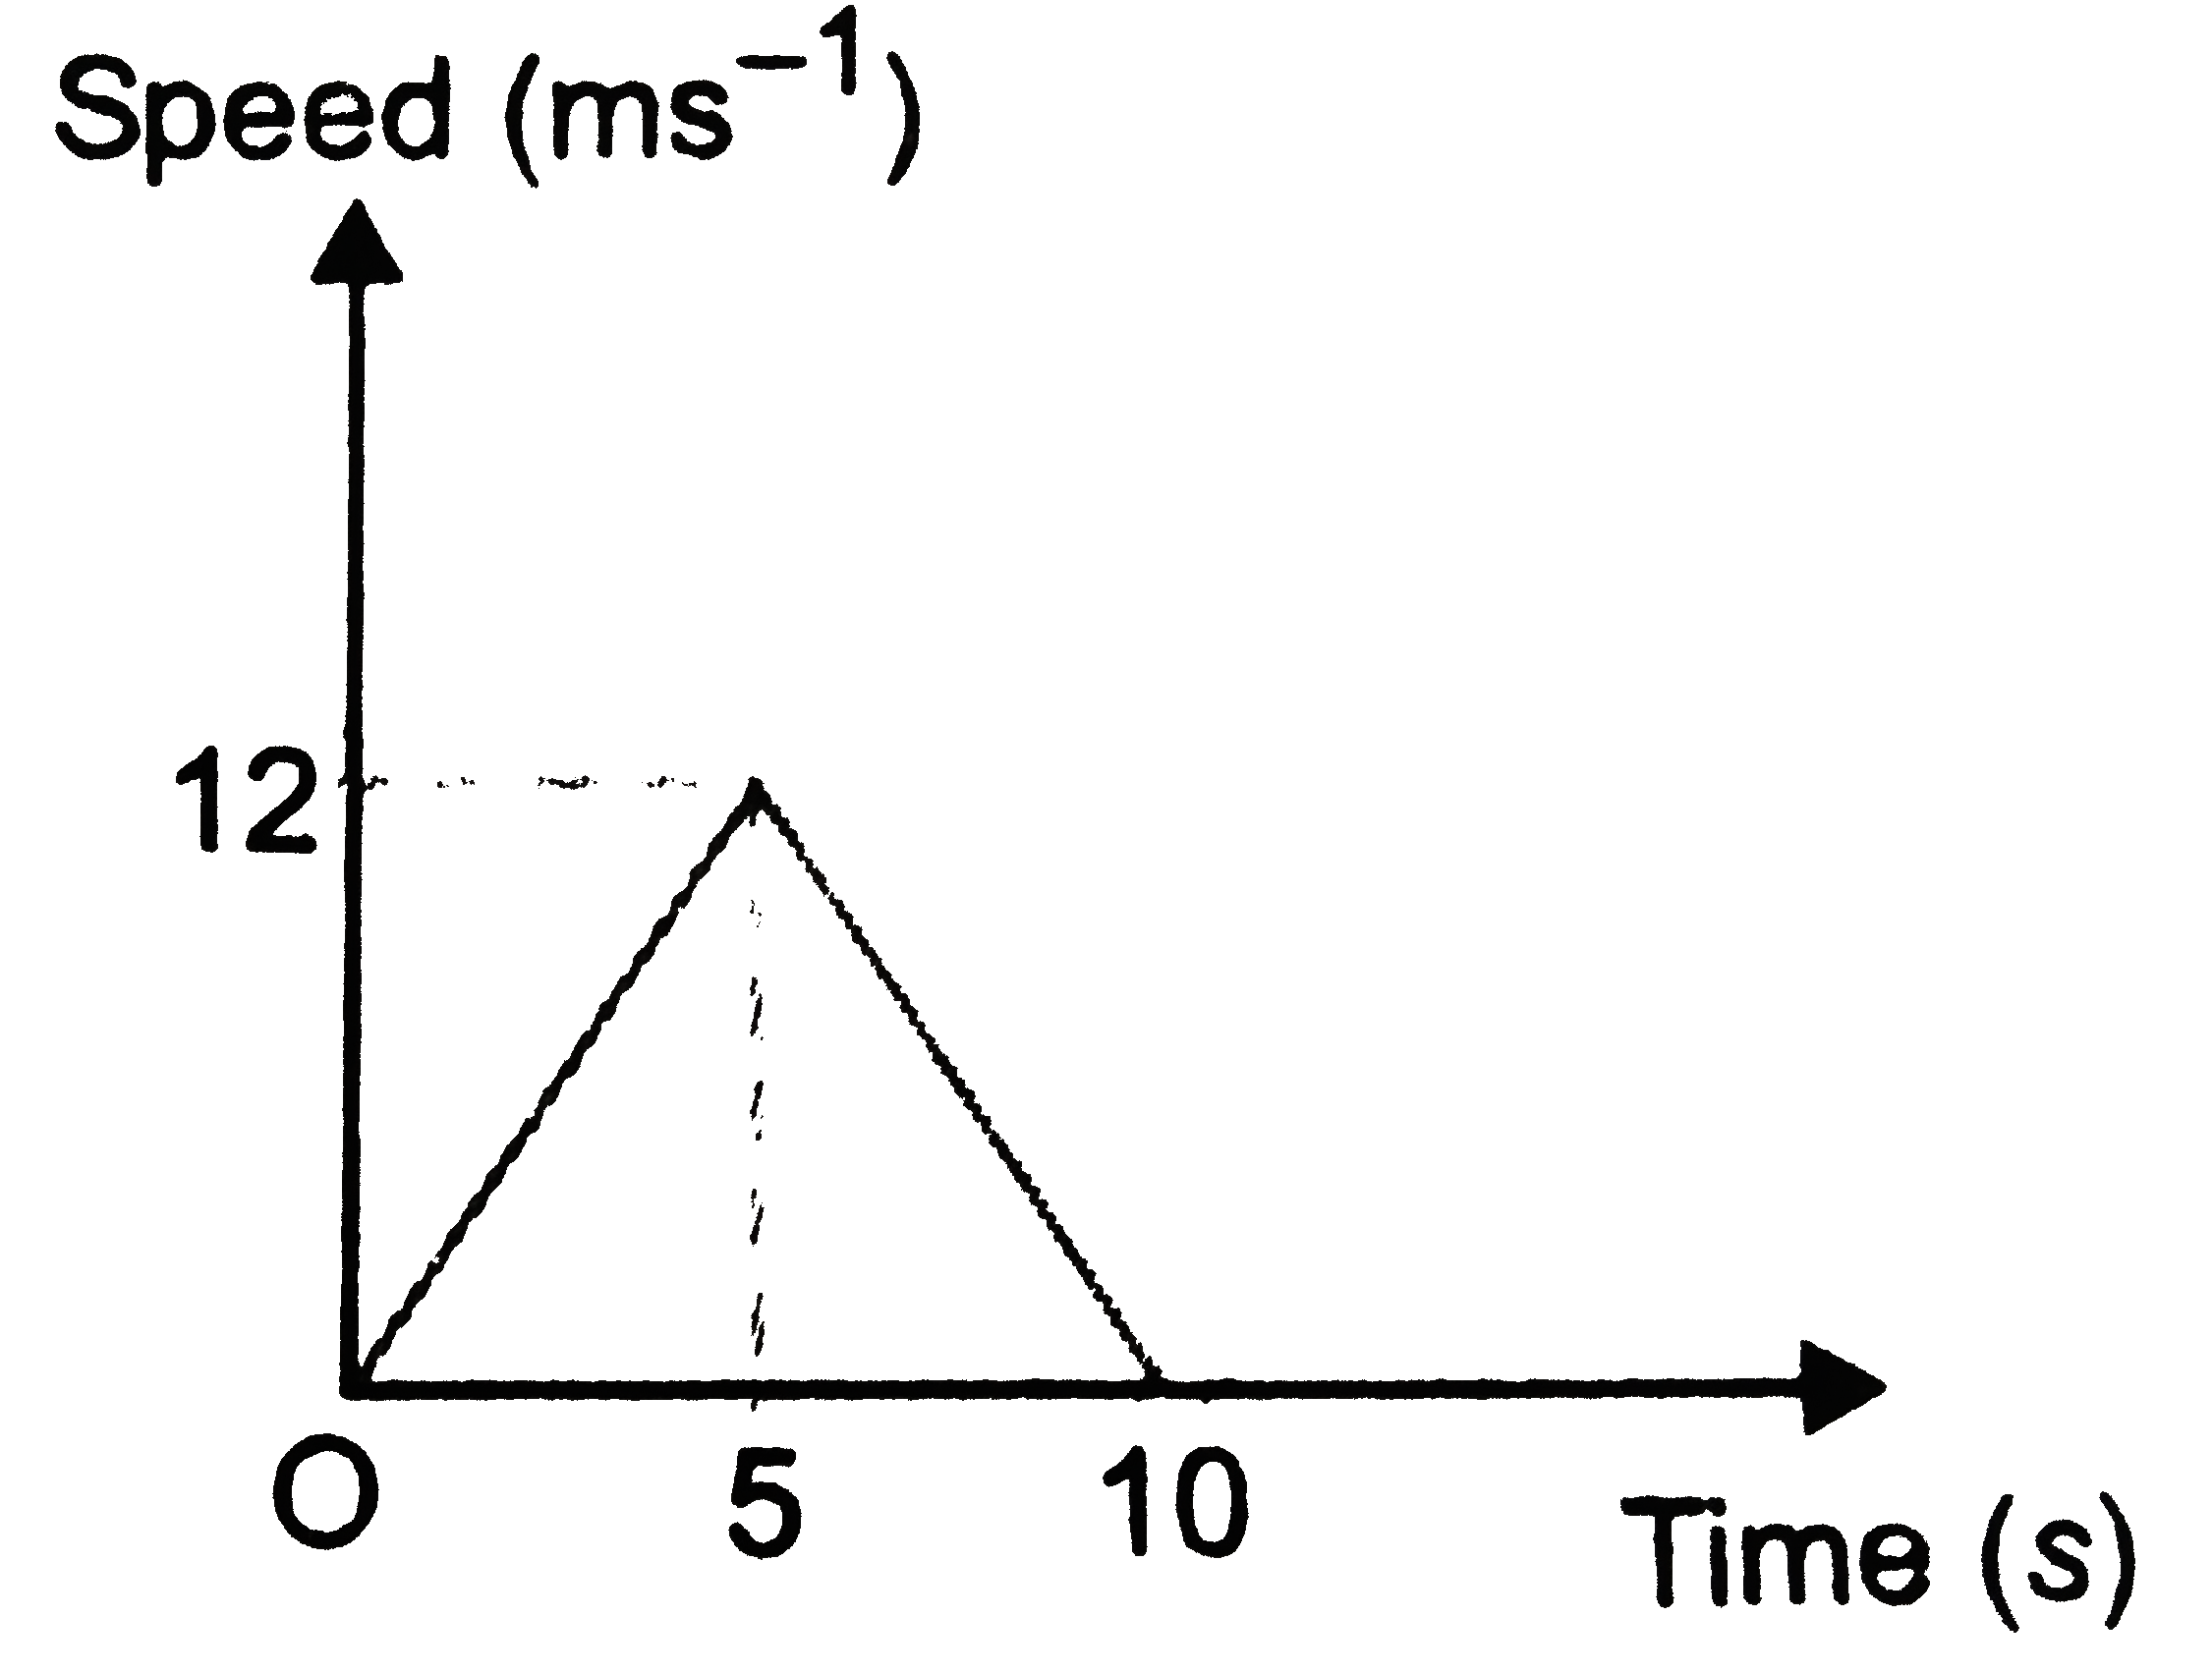 .
what is the average speed of the particle over the intervals?
View SolutionIf the object is moving with uniform velocity in a given interval of time, then the average speed and instantaneous velocity are equal, why?
View SolutionUnder what condition is the magnitude of the average velocity of a particle moving in onbe dimension smaller than the average speed over same time interval?
View Solution
