A three wheeler starts from rest, accelerates uniformly with 1ms−2 on a straight road for 10s and then moves with uniform velocity. Plot a graph between the distance covered by the vehicle during the nth second ( n = 1,2,3, ……..) versus n. What do you expect the plot to be during accelerated motion: a straight line or a parabola?
 .
.
Straight line
Distance covered by a body in nth second is given by the relation
Dn=u+a2(2n−1)…(i)
Where , u=initial velocity
a=Acceleration
n=Time=1,2,3,….,n
In the given case,
u =0 and a=1m/s2
∴Dn=12(2n−1) (ii)
This relation shows that:
Dn∝n...(iii)
Now , substituting different values of n in equation (iii), we get the following table
n12345678910Dn0.51.52.53.54.55.56.57.58.59.5
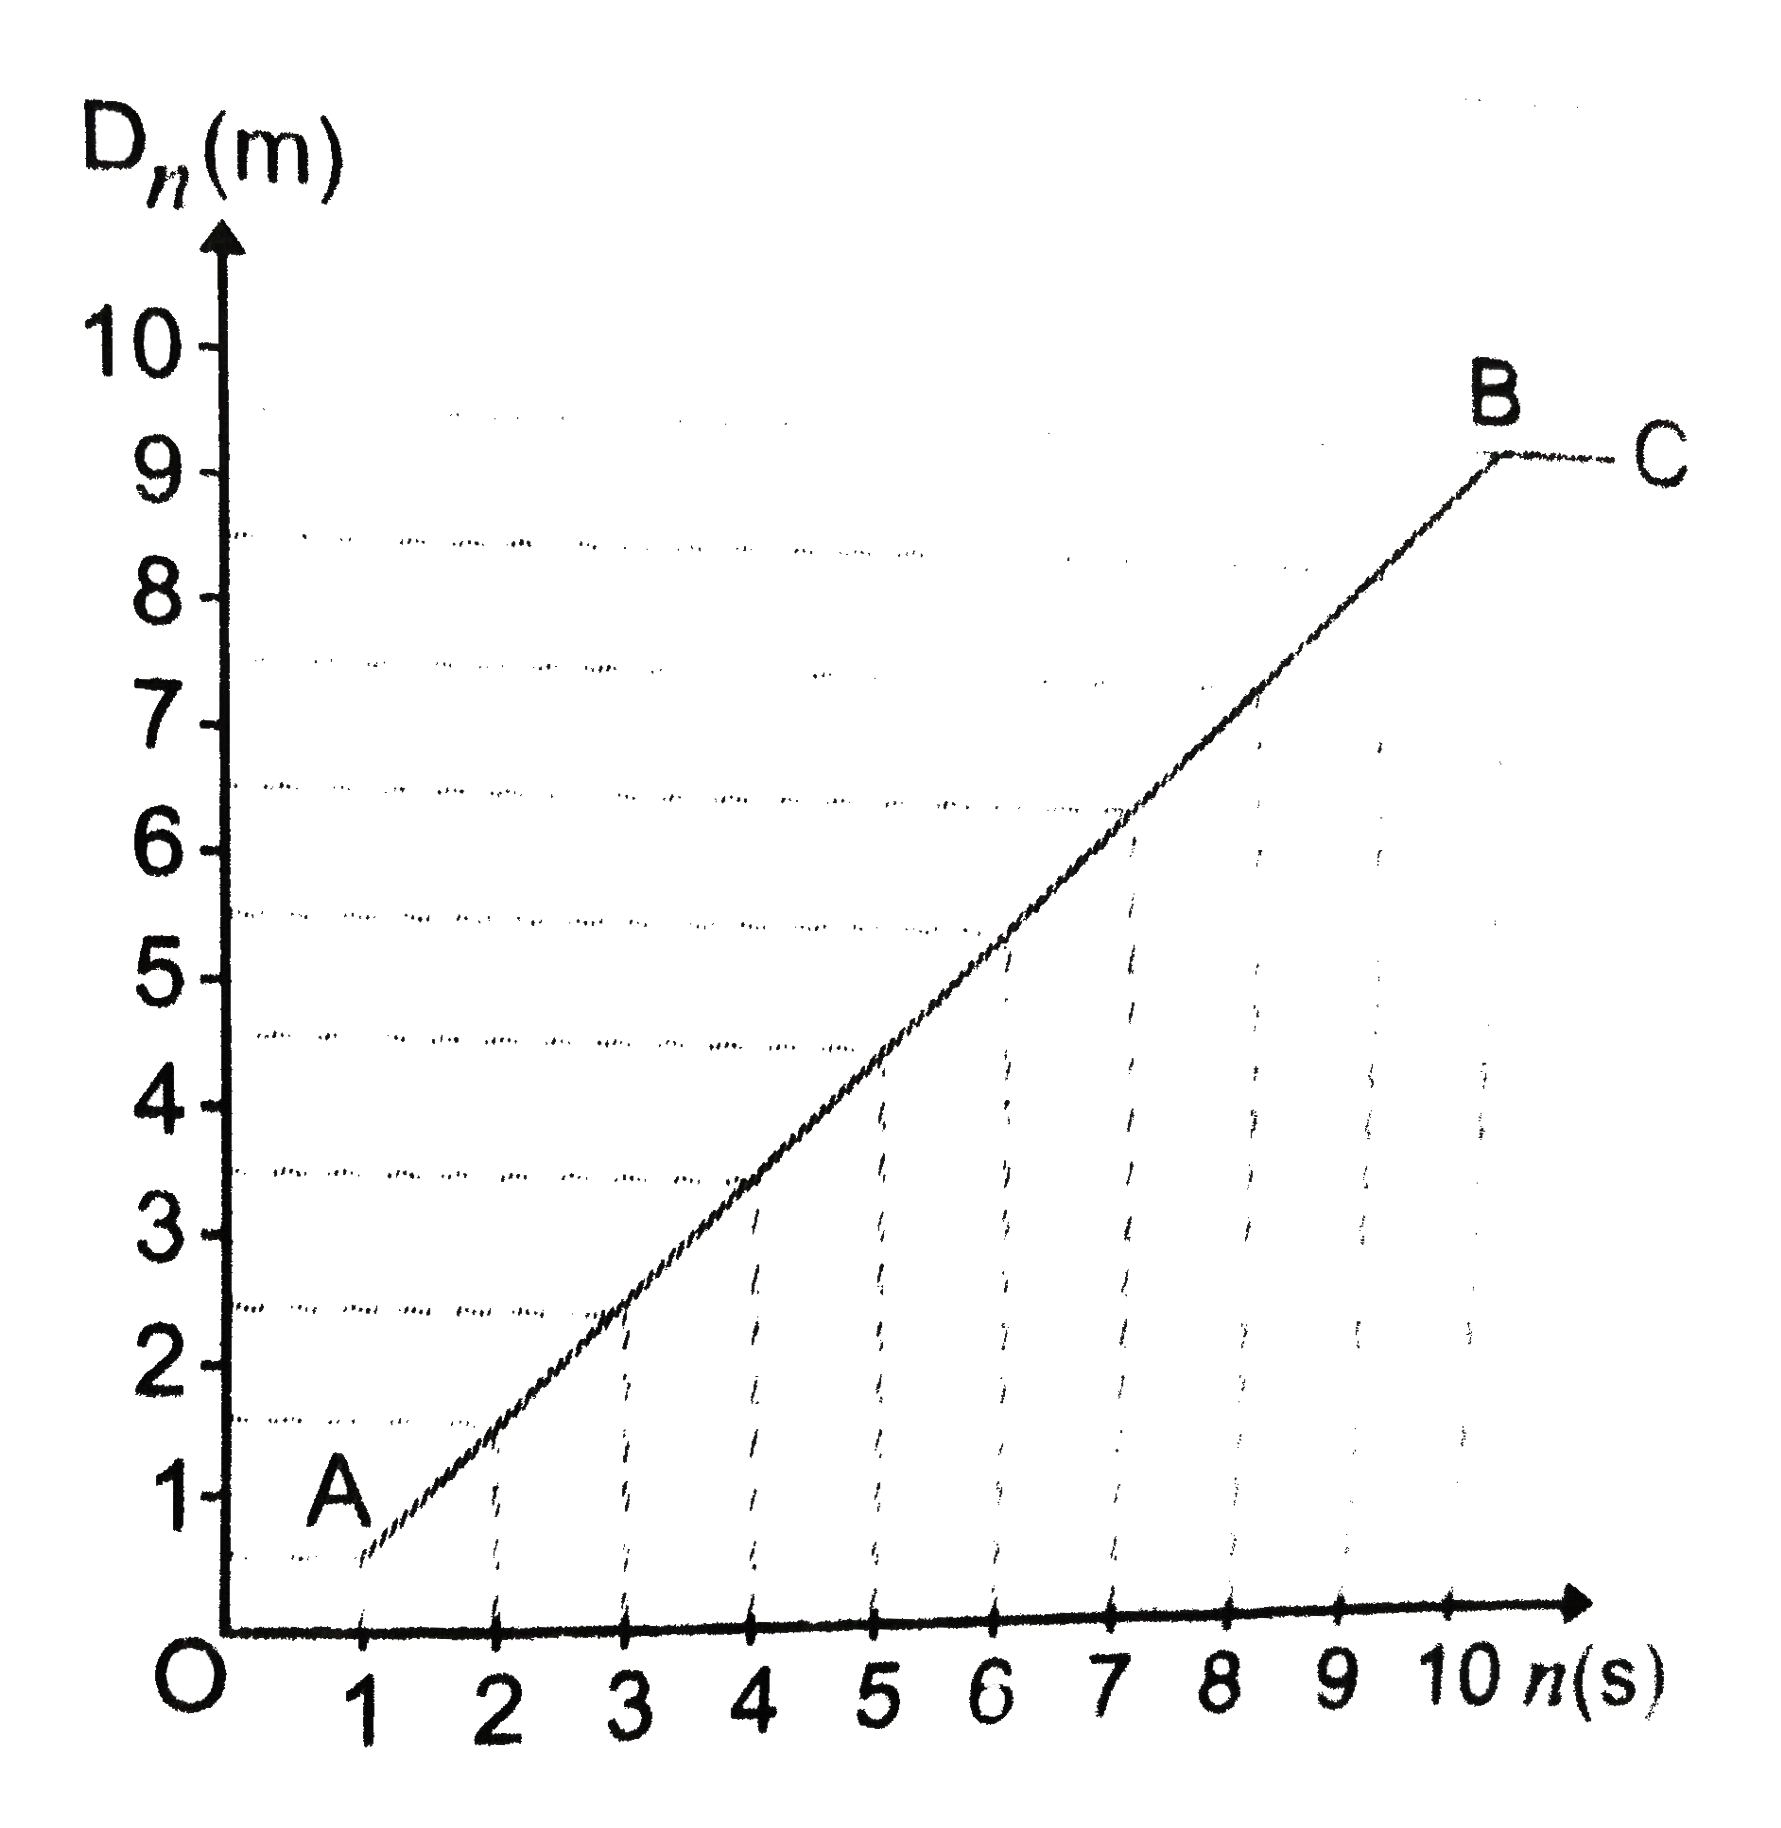
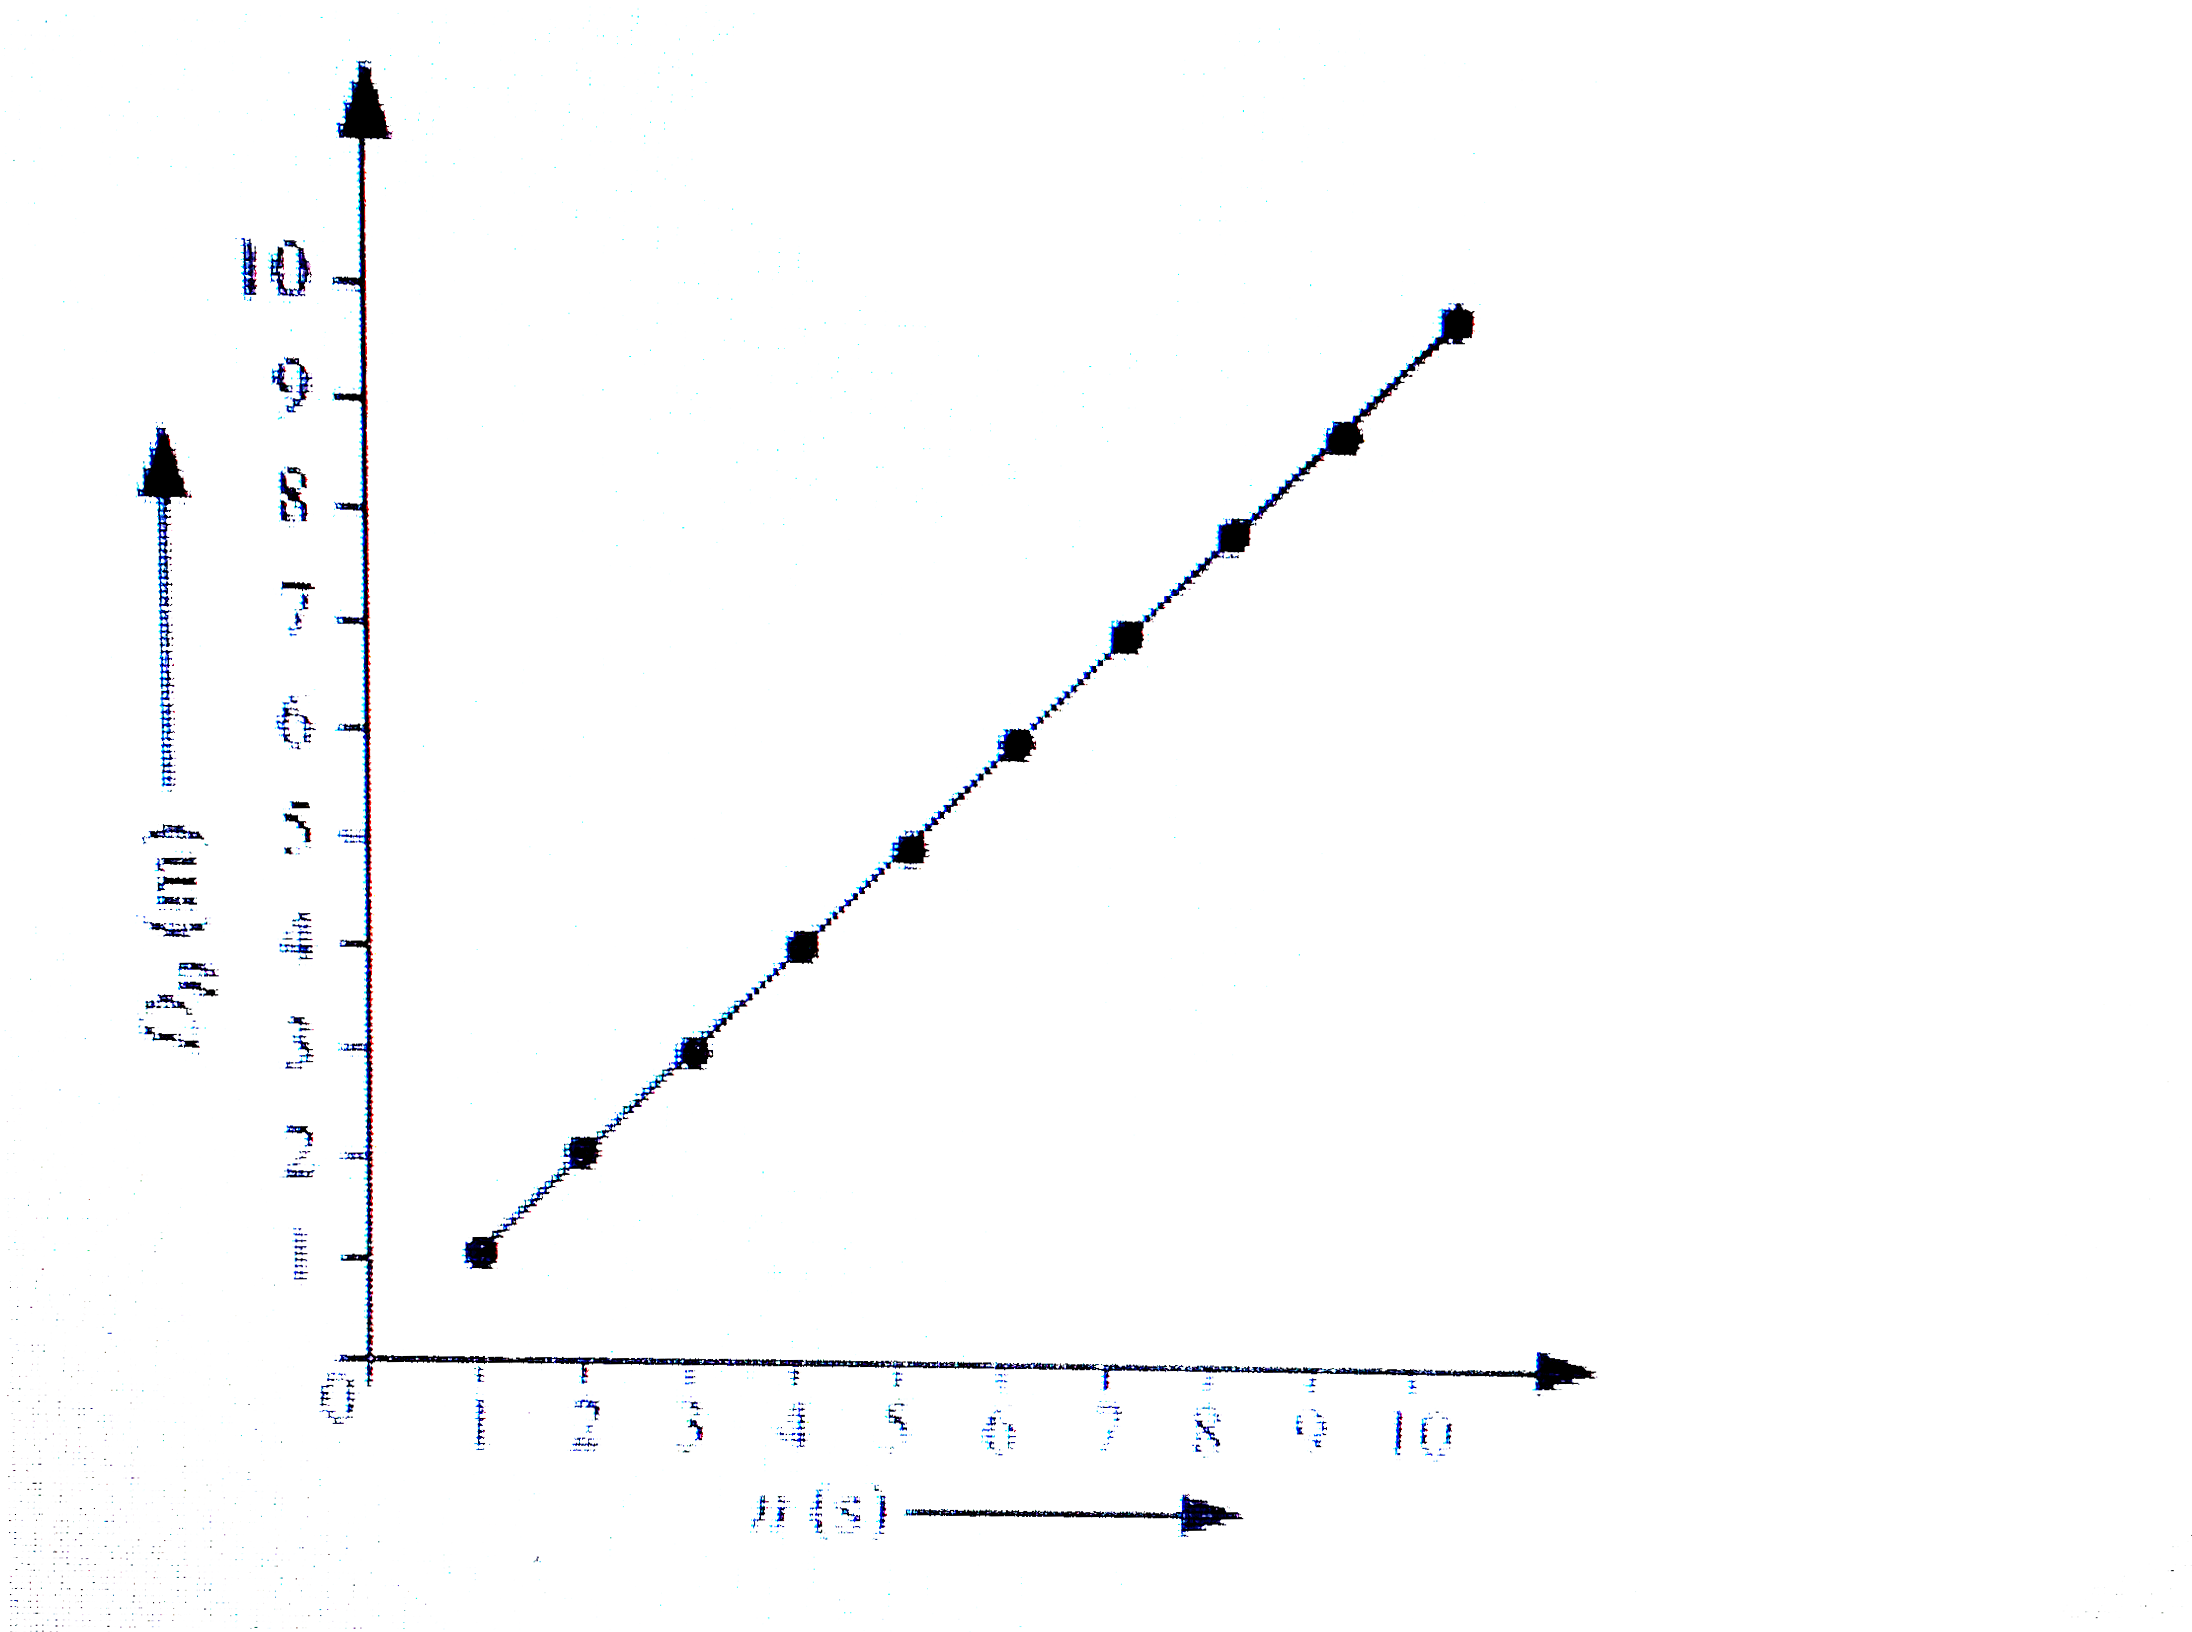
The plot between n and Dn will be a straight line as shown :

Since the given three-wheeler acquires uniform velocity after 10 s, the line will be parallel to the time-axis after n = 10 s.
Topper's Solved these Questions
Similar Questions
A body starts from rest and moves with a uniform acceleration of 10ms−2 for 5 seconds. During the next 10 seconds it moves with uniform velocity. Find the total distance travelled by the body (Using graphical analysis).
View SolutionA body starts from rest and moves with a uniform acceleration of 10ms−2 for 5 seconds. During the next 10 seconds it moves with uniform velocity. Find the total distance travelled by the body (Using graphical analysis).
View SolutionA body starts from rest with a uniform acceleration of 2 m s−1 . Find the distance covered by the body in 2 s.
View SolutionThe initial velocity of a body moving along a straight lines is 7m/s. It has a uniform acceleration of 4m/s2 the distance covered by the body in the 5th second of its motion is-
View SolutionThe distance travelled by a particle in nth second is Sn=u+a2(2n−1) where u is the velocity and a is the acceleration. The equation is
View SolutionA body starting from rest is moving with a uniform acceleration of 8ms2. Then the distance travelled by it in 5th second will be
View SolutionA particle at rest starts moving in a horizontal straight line with a uniform acceleration. The ratio of the distances covered during the fourth and third seconds is
View SolutionA particle moving along a straight line with initial velocity u and acceleration a continues its motion for n seconds. What is the distance covered by it in the last nth second ?
View SolutionA car accelerates from rest with 2m/s2 on a straight line path and then comes to rest after applying brakes. Total distance travelled by the car is 100 m in 20 seconds. Then, the maximum velocity attained by the car is
View SolutionA truck starts from rest and accelerate uniformly with 2ms−2. At t = 10 s a stone is dropped by a person standing on the top of the truck (6 m high from ground). What are the (a) velocity and (b) acceleration of the stone at t = 11 s ? Neglect air resistance.
View Solution
