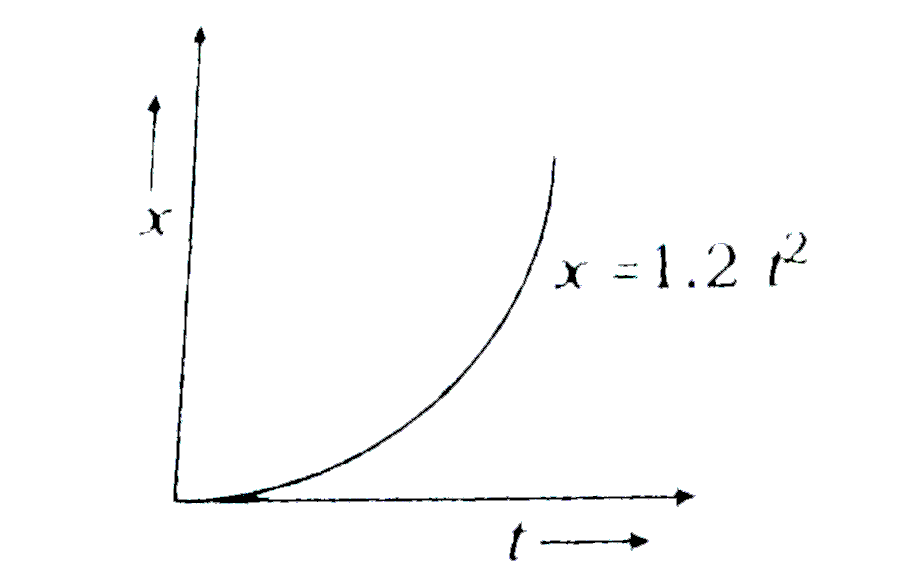
Figure given shows the distance - time graph of the motion of a car. It follows from the graph that the car is
at rest
in uniform motion
in non-uniform acceleration
uniformly accelerated
The correct Answer is:D
Since x=1.2t2, comparing if with equation of motion x=12at2.
Thus the motion is uniformly accelerated.
Topper's Solved these Questions
- MOTION IN A PLANEBOOK - DC PANDEY ENGLISHCHAPTER - MOTION IN A PLANEEXERCISE - (B) Meical entrance special format questions (Assertion and reason)
19 Videos
- MOTION IN A PLANEBOOK - DC PANDEY ENGLISHCHAPTER - MOTION IN A PLANEEXERCISE - (B) Meical entrance special format questions (Mathch the columns)
6 Videos
- MOTION IN A PLANEBOOK - DC PANDEY ENGLISHCHAPTER - MOTION IN A PLANEEXERCISE - Check point 3.7
15 Videos
- MOTIONBOOK - DC PANDEY ENGLISHCHAPTER - MOTIONEXERCISE - Medical entrances gallery
19 Videos
- PROJECTILE MOTIONBOOK - DC PANDEY ENGLISHCHAPTER - PROJECTILE MOTIONEXERCISE - Level - 2 Subjective
10 Videos
Similar Questions
Figure shows the displacement time graph of a particle moving on the X-axis

View SolutionFigure shows the displacement-time graph of a particle moving on the X-axis

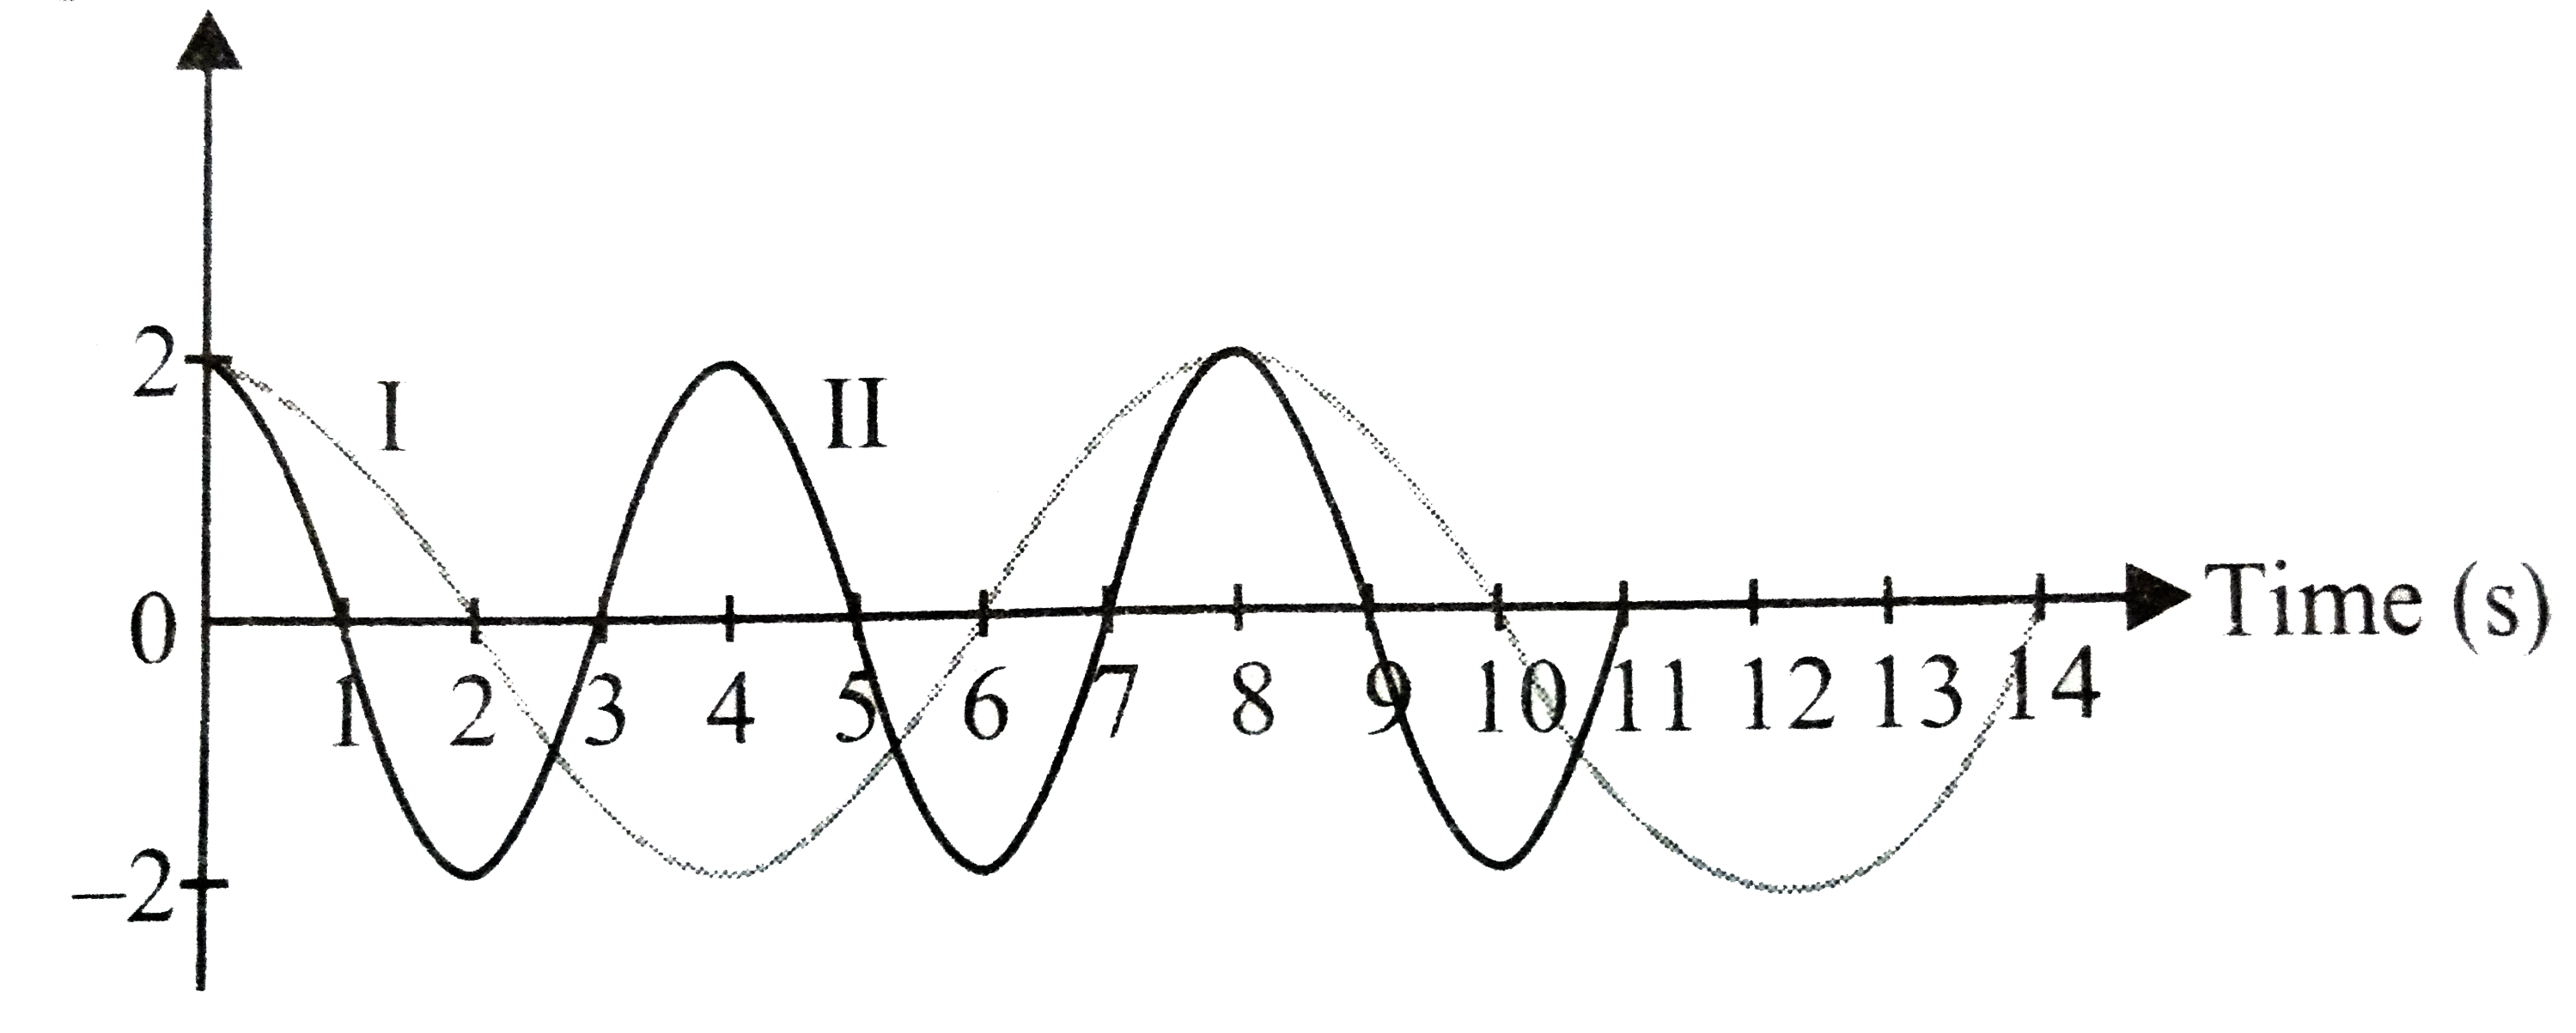
View SolutionFigure shows the displacement-time graphs of two simple harmonic motions I and II. From the graph it follows that
View SolutionFig. 2.42 given below shows a velocity-time graph for a car starting from rest. The graph has three parts AB, BC and CD.
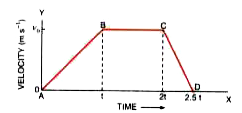
(i) State how is the distance travelled in any part determined from this graph.
(ii) Compare the distance travelled in part BC with the distance travelled in part AB.
(iii) Which part of graph shows motion with uniform (a) velocity (b) acceleration (c) retardation ?
(iv) (a) Is the magnitude of acceleration higher or lower than that of retardation ? Give a reason. (b) Compare the magnitude of acceleration and retardation.
View SolutionFigure shows the stress-strain graphs for materials .A and B. From the graph it follows that
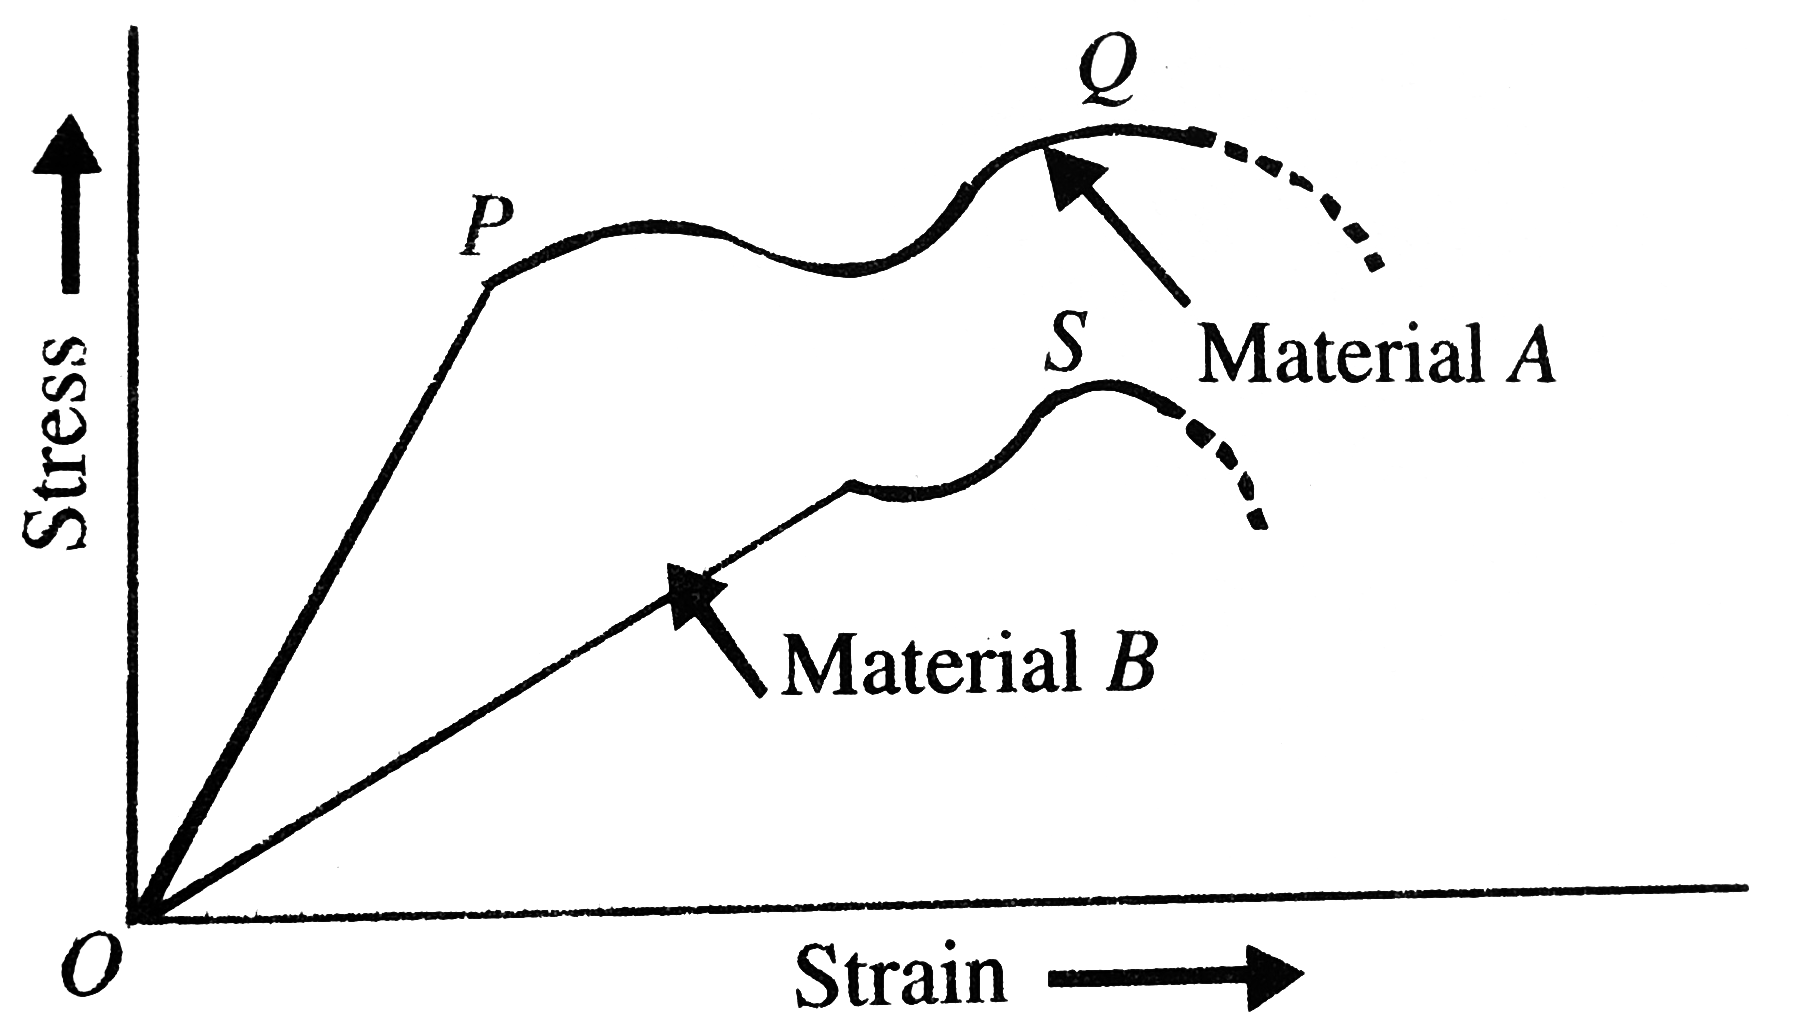
View SolutionFigure shows the stress-strain graphs for materials .A and B. From the graph it follows that

View SolutionFigure below shows the velocity-time graph of a one dimensional motion. Which of the following characteristic of the particle is represented by the shaded area?

View SolutionFigure given here shows the displacement time graph for a particle. Is it practically possible ? Explain.
View SolutionThe figure shows the displacement-time graph of a particle executing SHM. If the time period of oscillation is 2s, then the equation of motion is given by
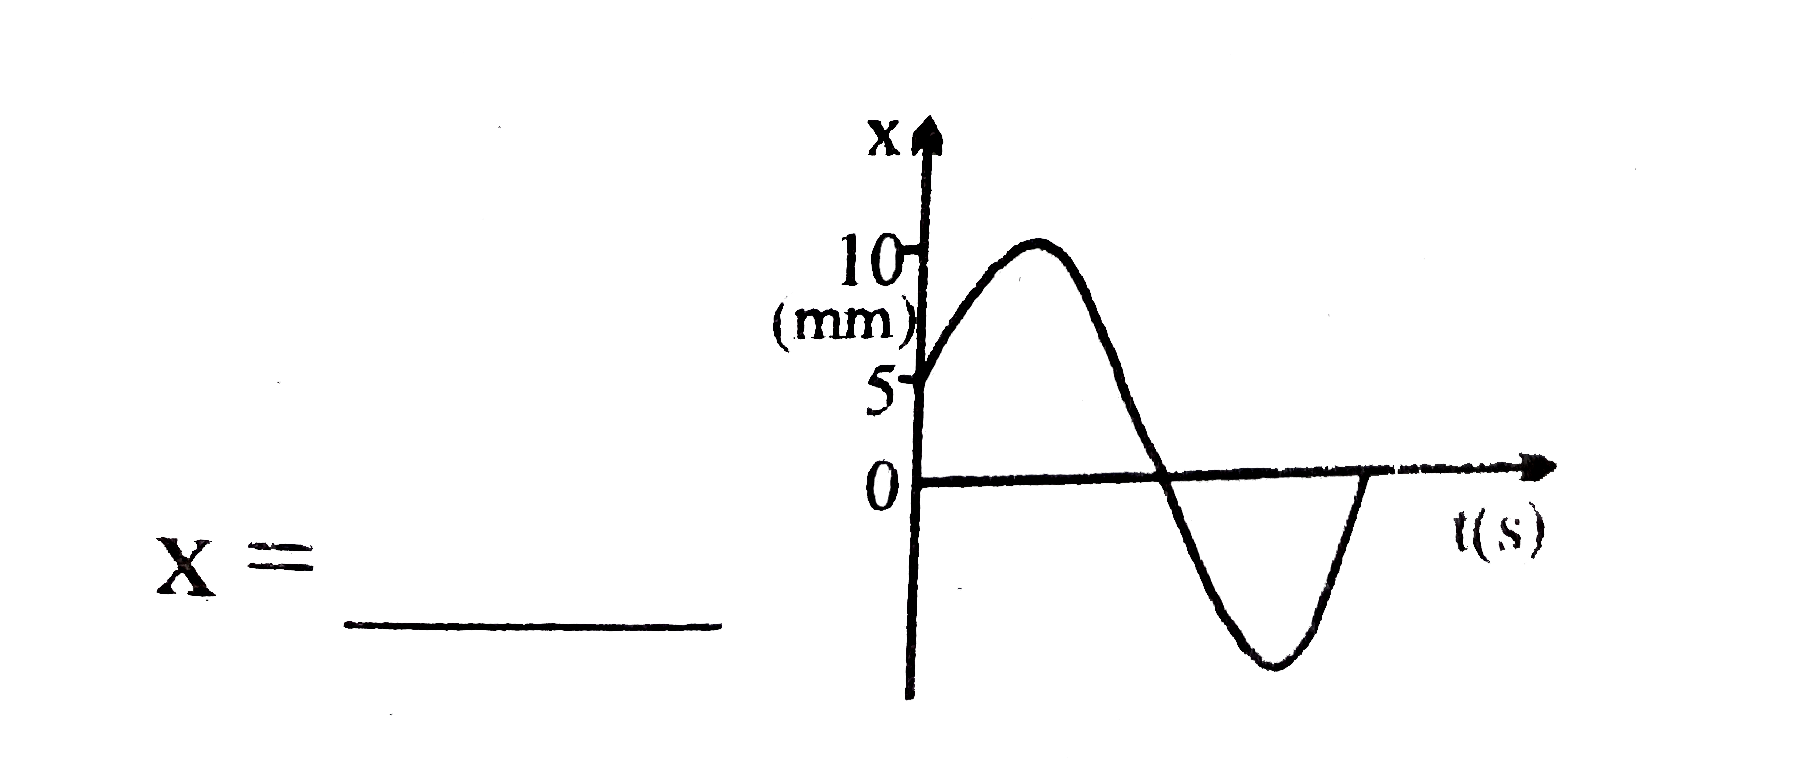
View SolutionThe figure shows the displacement-time graph of a particle executing SHM. If the time period of oscillation is 2s, then the equation of motion is given by

View Solution