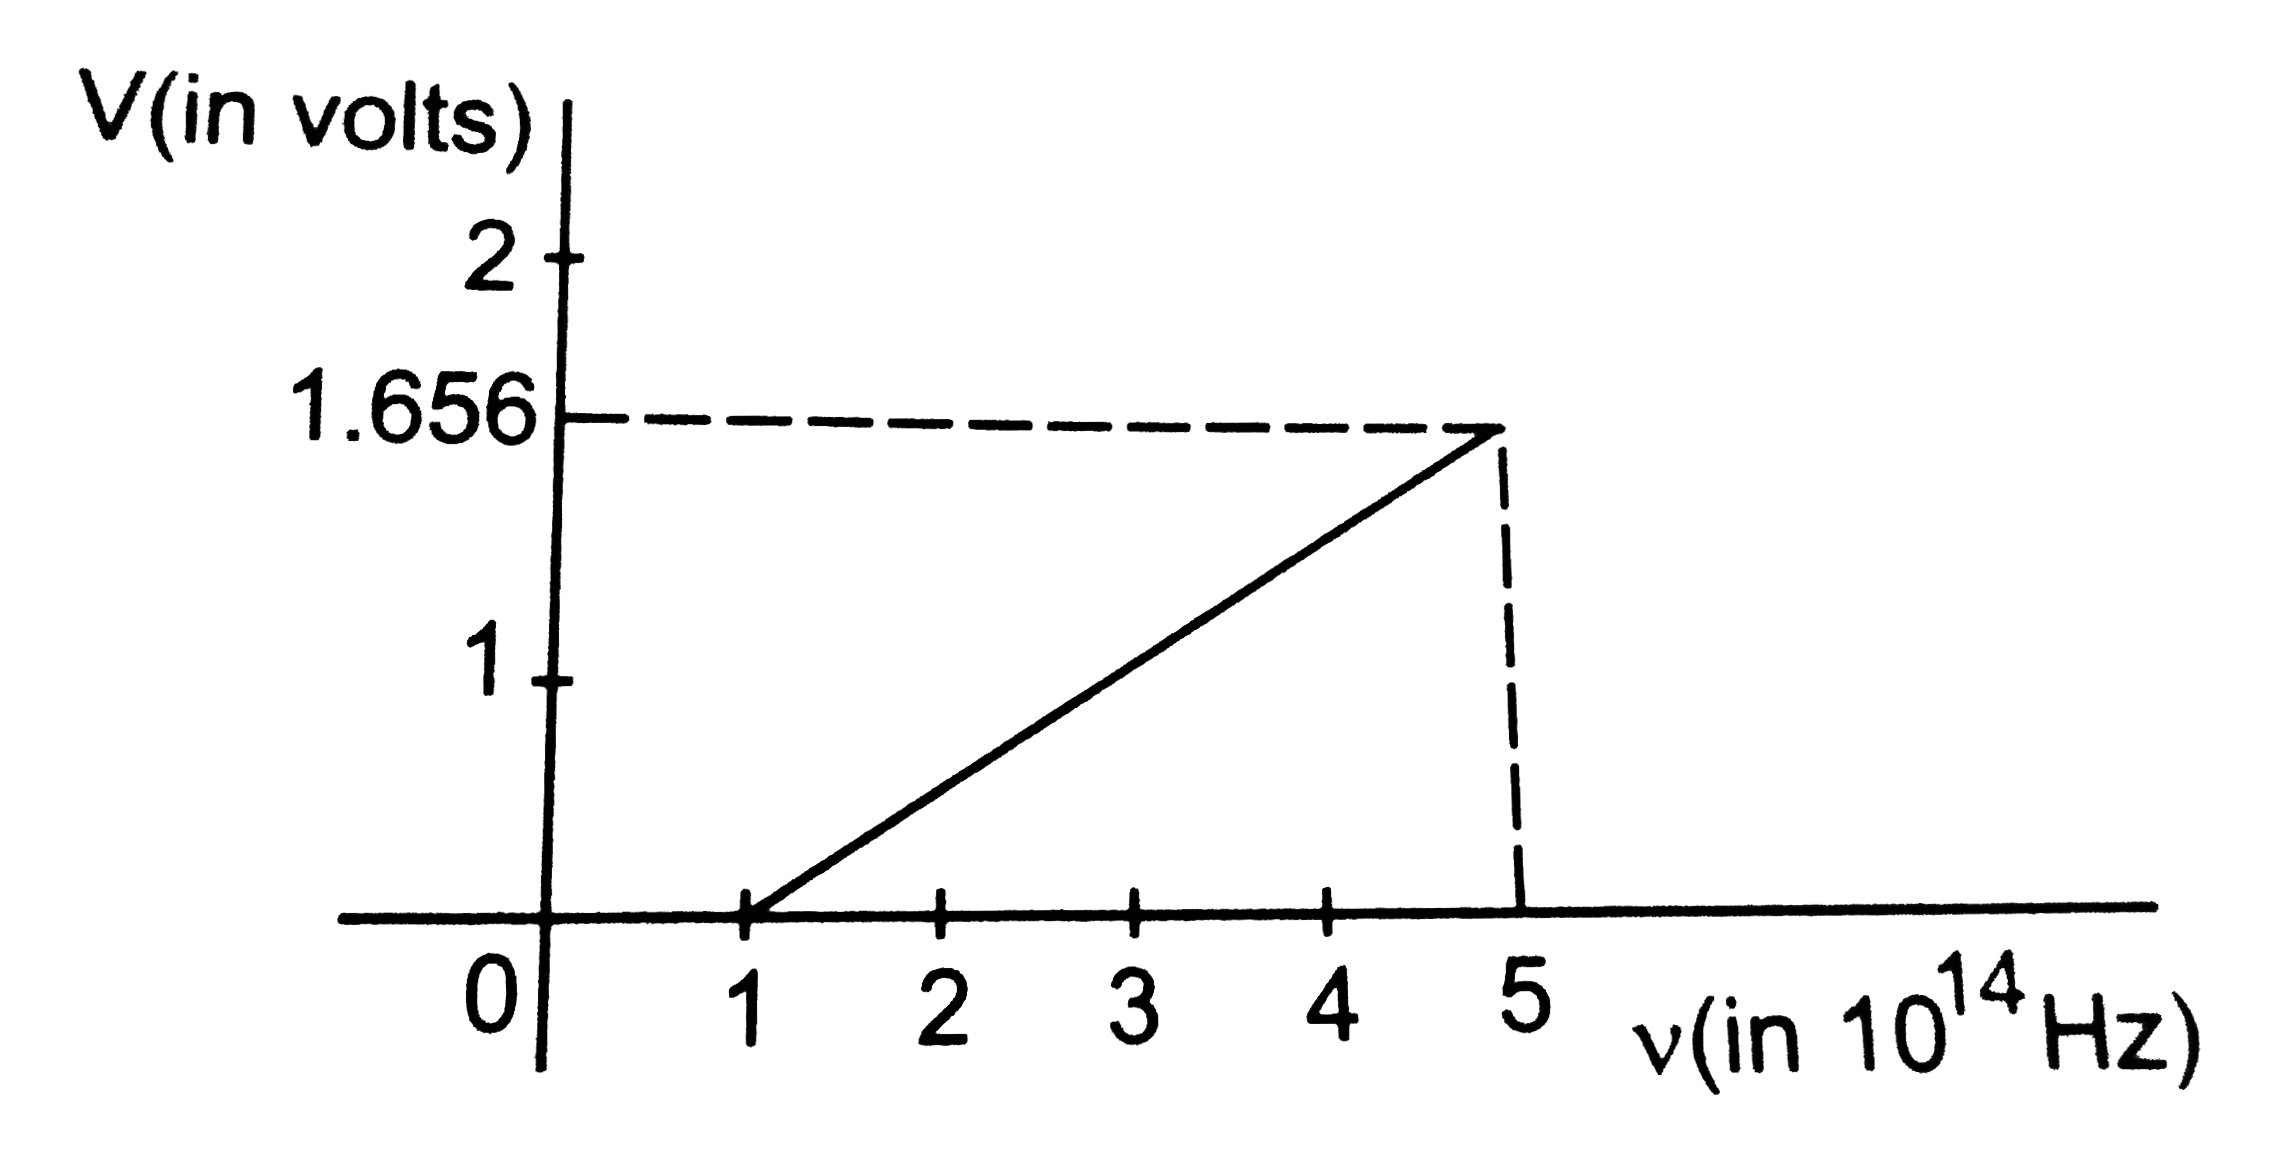
Figure is the plot of the stopping potential versus the frequency of the light used in an experiment on photoelectric effect. Find (a) the ratio h/e and (b) the work function.

10−15Vs−15Vs
2×10⁻¹⁵Vs
3×10⁻¹⁵Vs
4.14×10⁻¹⁵Vs
The correct Answer is:D
eVS=hc−ϕ0
VS=hev−ϕ0e
Now, he=slope=1.6564×1014
=0.414×10⁻¹⁴Vs
4.14×10⁻¹⁵Vs
Topper's Solved these Questions
- PHOTOELECTRIC EFFECTBOOK - CENGAGE PHYSICS ENGLISHCHAPTER - PHOTOELECTRIC EFFECTEXERCISE - Multiple Correct
10 Videos
- PHOTOELECTRIC EFFECTBOOK - CENGAGE PHYSICS ENGLISHCHAPTER - PHOTOELECTRIC EFFECTEXERCISE - Linked Comprehension
44 Videos
- PHOTOELECTRIC EFFECTBOOK - CENGAGE PHYSICS ENGLISHCHAPTER - PHOTOELECTRIC EFFECTEXERCISE - Subjective
16 Videos
- NUCLEAR PHYSICSBOOK - CENGAGE PHYSICS ENGLISHCHAPTER - NUCLEAR PHYSICSEXERCISE - ddp.5.5
14 Videos
- RAY OPTICSBOOK - CENGAGE PHYSICS ENGLISHCHAPTER - RAY OPTICSEXERCISE - DPP 1.6
12 Videos
Similar Questions
A non-monochromatic light is used in an experiment on photoelectric effect. The stopping potential
View SolutionThe electric field associated with a light wave is given by E=E0sin[(1.57×10⁷m−1(x−ct)]. Find the stopping potential when this light is used in an experiment on photoelectric effect with a metal having work - function 1.9 eV.
View Solution
Knowledge Check
The stopping potential as a function of the frequency of the incident radiation is plotted for two different photoelectric surfaces A and B . The graphs show that work function of A is
 AlessBmoreCequalDnothing can be said
The electric field associated with a light wave is given by E=E0sin[(1.57x10⁷m−1(x−ct)]. Find the stopping potential when this light is used in an experiment on photoelectric affect with a metal having work - function 1.9 eV.
View SolutionWhen stopping potential is applied in an experiment on photoelectric effect, no photo current is observed. This means that
View SolutionThe electric field associated with a light wave is given by E=E0sin[(1.57×10⁷m−1)(ct−x)]. Find the stopping potential when this light is used in an experiment on a photoelectric effect with the emitter having work function 2.1eV. h=6.62×10⁻³⁴Js.
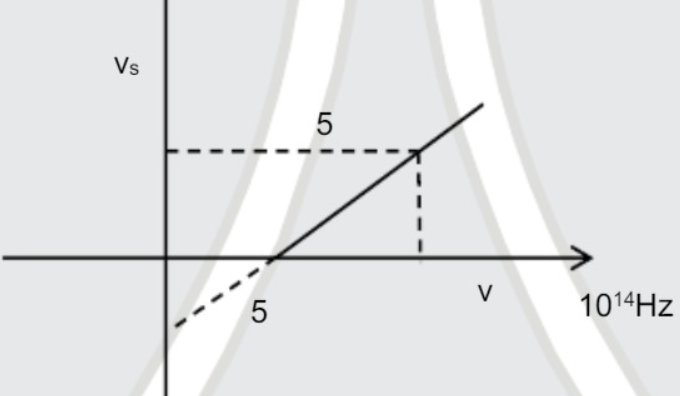
View SolutionGraph between stopping potential and frequency of light as shown find the work function

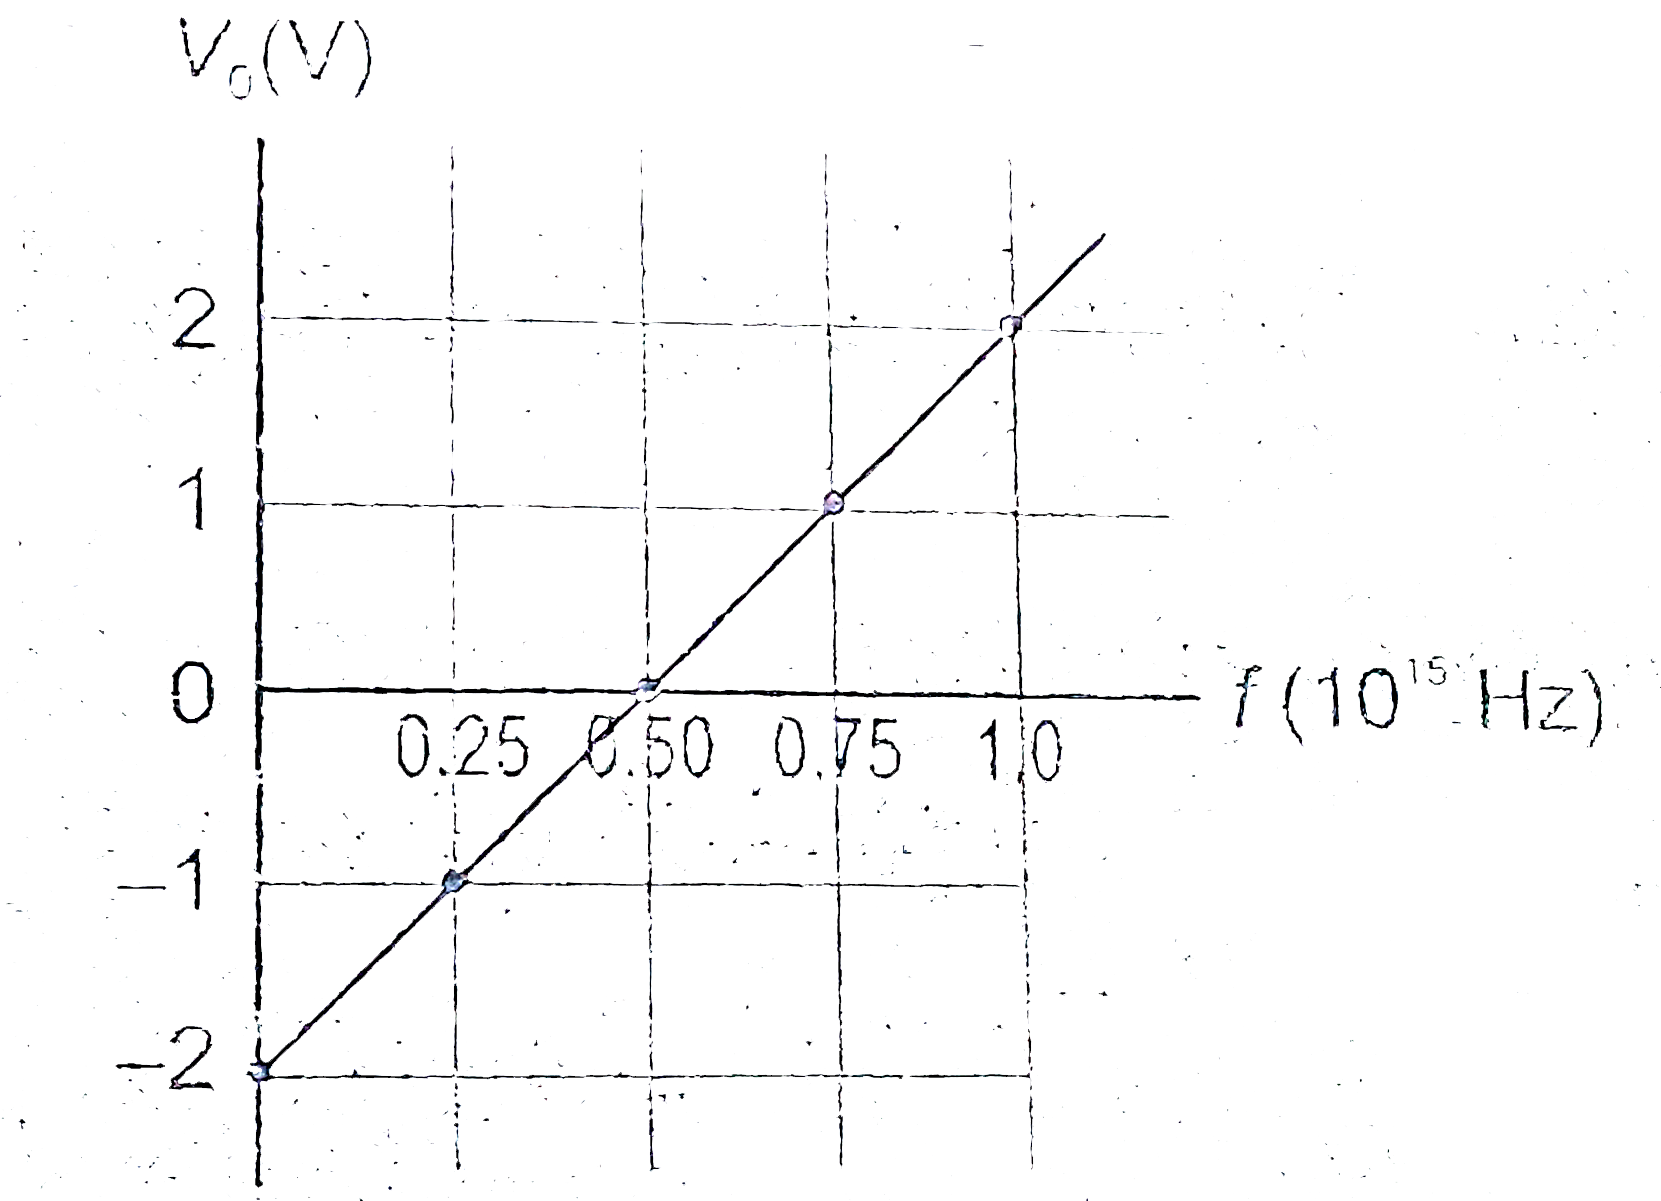
View SolutionFigure shows the graph of stopping potential verus that frequency of a photosensitive metal. The plank's constant and work funcation of the metal are
_S01_035_Q01.png)
View SolutionThe following figure shows a graph for the stopping potential as a function of the frequency of incident light illuminating a metal surface. Find the photoelectric work function for this surface.

View SolutionIf the frequency of light in a photoelectric experiment is doubled the stopping potential will
View Solution
