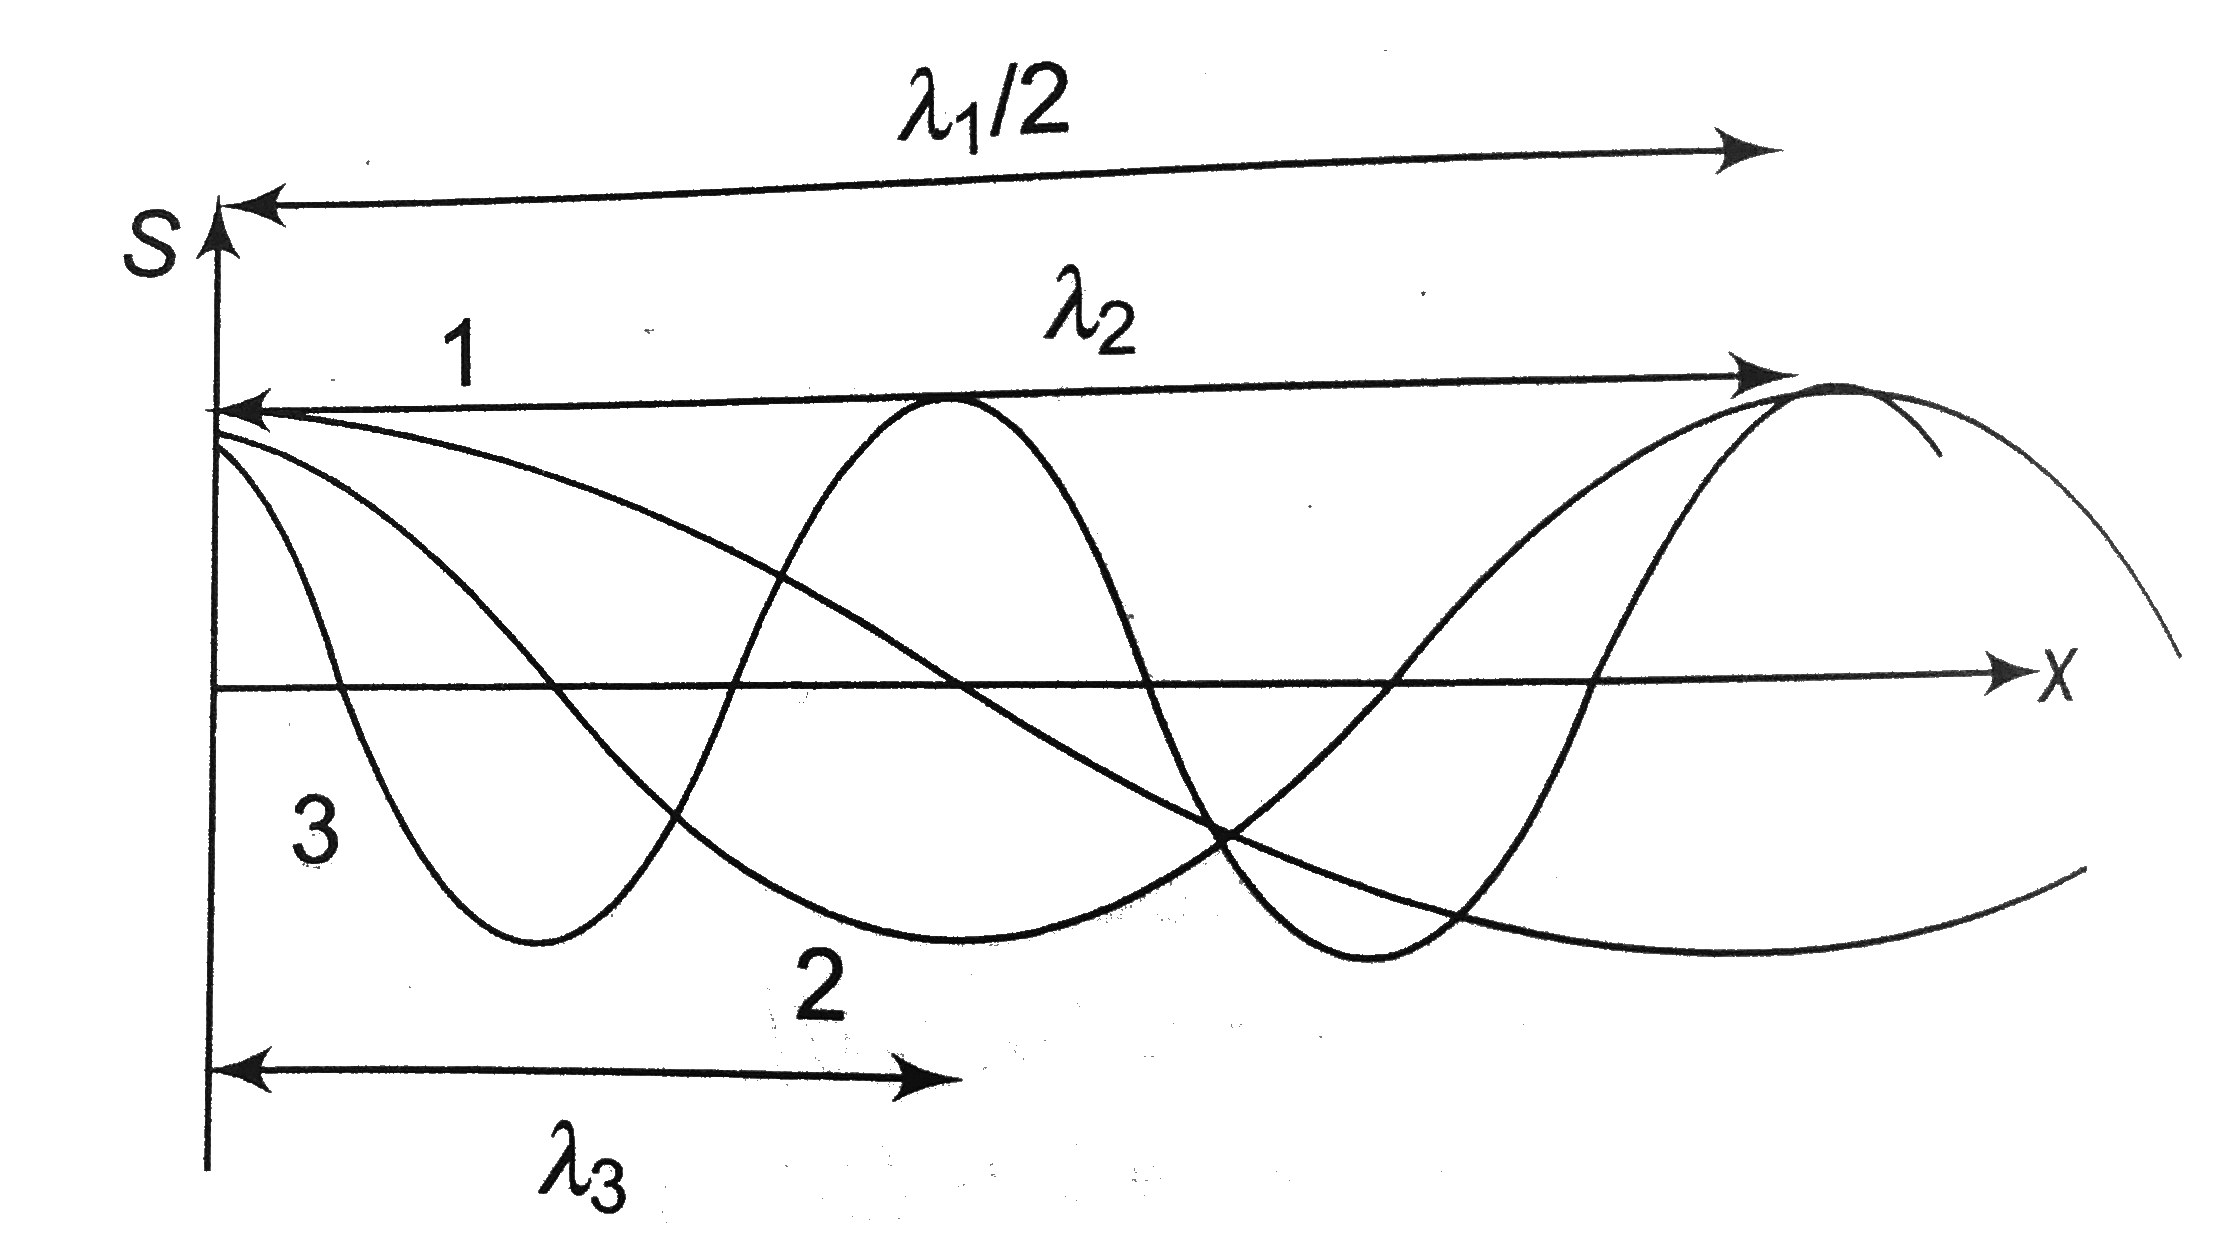
Figure shown is a graph at a certain time t, of the displacement function S(x,t) of three sound waves 1,2 and 3 as marked on the curves that travel along x-axis through air. If P1,P2 and P3 represent their pressure amplitudes respectively then contact relation between them is:
P1>P2>P3
P3>P2>P1
P1=P2=P3
P2>P2>P1
The correct Answer is:B
P0=B.K.S0=B(2πλ)S0⇒P0∝1λ
Thus, pressure amplitude is highest for minimum wavelength, other parameters B and S0 being same for all. From given graphs
λ3<λ2<λ1. Hence (b)
Topper's Solved these Questions
- BOOK - A2ZCHAPTER - WAVES AND ACOUSTICSEXERCISE - Doppler Effect25videos
WAVES AND ACOUSTICS
- BOOK - A2ZCHAPTER - WAVES AND ACOUSTICSEXERCISE - Problems Based On Mixed Concepts15videos
WAVES AND ACOUSTICS
- BOOK - A2ZCHAPTER - WAVES AND ACOUSTICSEXERCISE - Vibration Of Air Column23videos
WAVES AND ACOUSTICS
- BOOK - A2ZCHAPTER - VECTORSEXERCISE - Chapter Test29videos
VECTORS
- BOOK - A2ZCHAPTER - WORK, ENERGY, POWER AND COLLISIONEXERCISE - Chapter Test29videos
WORK, ENERGY, POWER AND COLLISION
Similar Questions
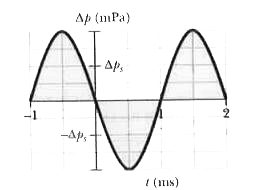
Figure shows the output from a pressure monitor mounted at a point along the path taken by a sound wave of a single frequency traveling at 343 m/s through air with a uniform density of 1.21kg/m3. The vertical axis scale is set by Δp=5.0mPa . If the displacement function of the wave is s(.x, t) = smcos(kx−ωt) , what are (a) sm(b) k, and (c) ω? The air is then cooled so that its density is 1.35 kg/m and the speed of a sound wave through it is 320 m/s. The sound source again emits the sound wave at the same frequency and same pressure amplitude. What now are (d)sm,(c)k,and(f)ω?
 View Solution
Figure shows four isotropic point sources of sound that are uniformly spaced on an x axis. The sources emit sound at the same wavelength λ and same amplitudes sm and they emit in phase. A point P is shown on the x axis. Assume that as the sound waves travel to P, the decrease in their amplitude is negligible. What multiple of sm is the amplitude of the net wave at P if distance d in the figure is (a)λ/4(b)λ/2and(c)λ ?
 View Solution
Knowledge Check
- Question 1 - Select One
The equation y=4+2sin(6t−3x) represents a wave motion. Then, wave speed and amplitude, respectively are
Awave speed 1 unit, amplitude 6 unitBwave speed 2 unit, amplitude 2 unitCwave speed 4 unit, amplitude 1/2 unitDwave speed 1/2 unit, amplitude 5 unit - Question 2 - Select One
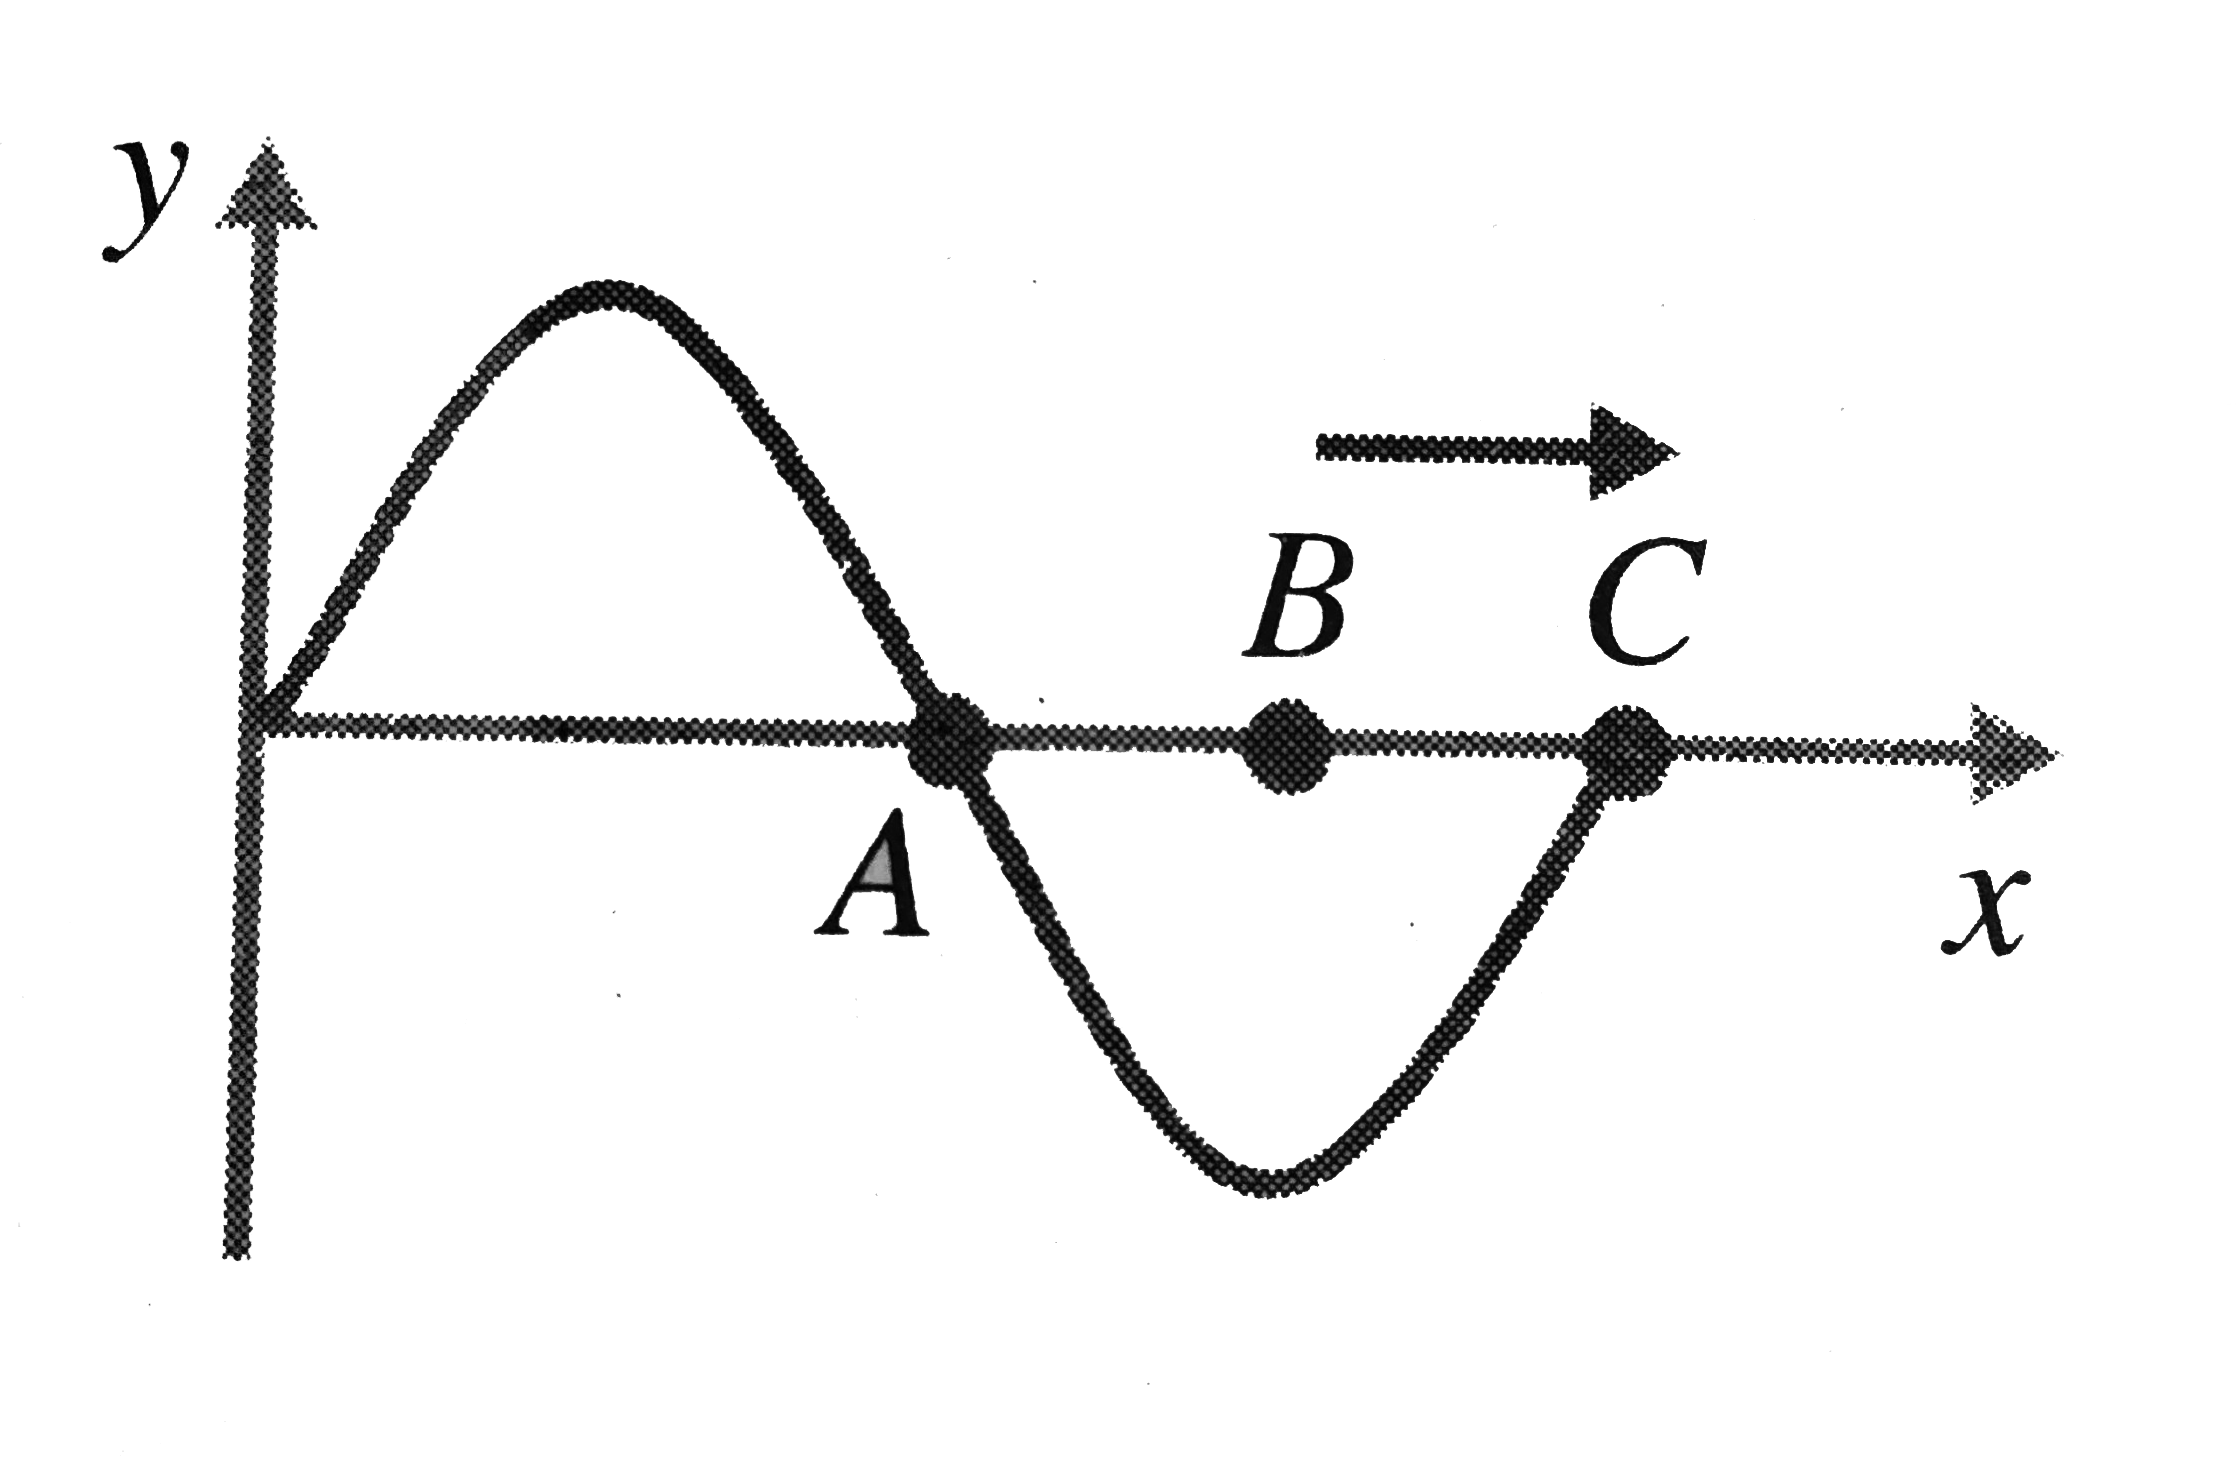
The figure shows an instantaneous displacement position graph of a sound wave travelling along the positive x-axis Identify the points of
i.Maximum pressure,
ii. Minimum pressure and
iii. Atmospheric pressure (or normal pressure.)A(i) A, (ii) C, (iii)BB(i) A, (ii) B, (iii)CC(i) B, (ii) A, (iii)CD(i) B, (ii) C, (iii)A - Question 3 - Select One
For a certain mass of gas, the isothermal curves between P and V at T1andT2. temperatures are 1 and 2 as shown in figure, then
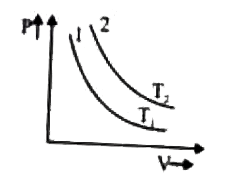 AT1>T2BT1=T2CT2>T1DT1>2T2
P-V curve is shown for a Carnot engine. Answer the question from the graph.
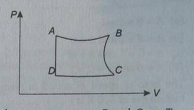
If the temperature at B and C are T1 and T2 respectively, then it can be concluded :View SolutionP-V curve is shown for a Carnot engine. Answer the question from the graph.

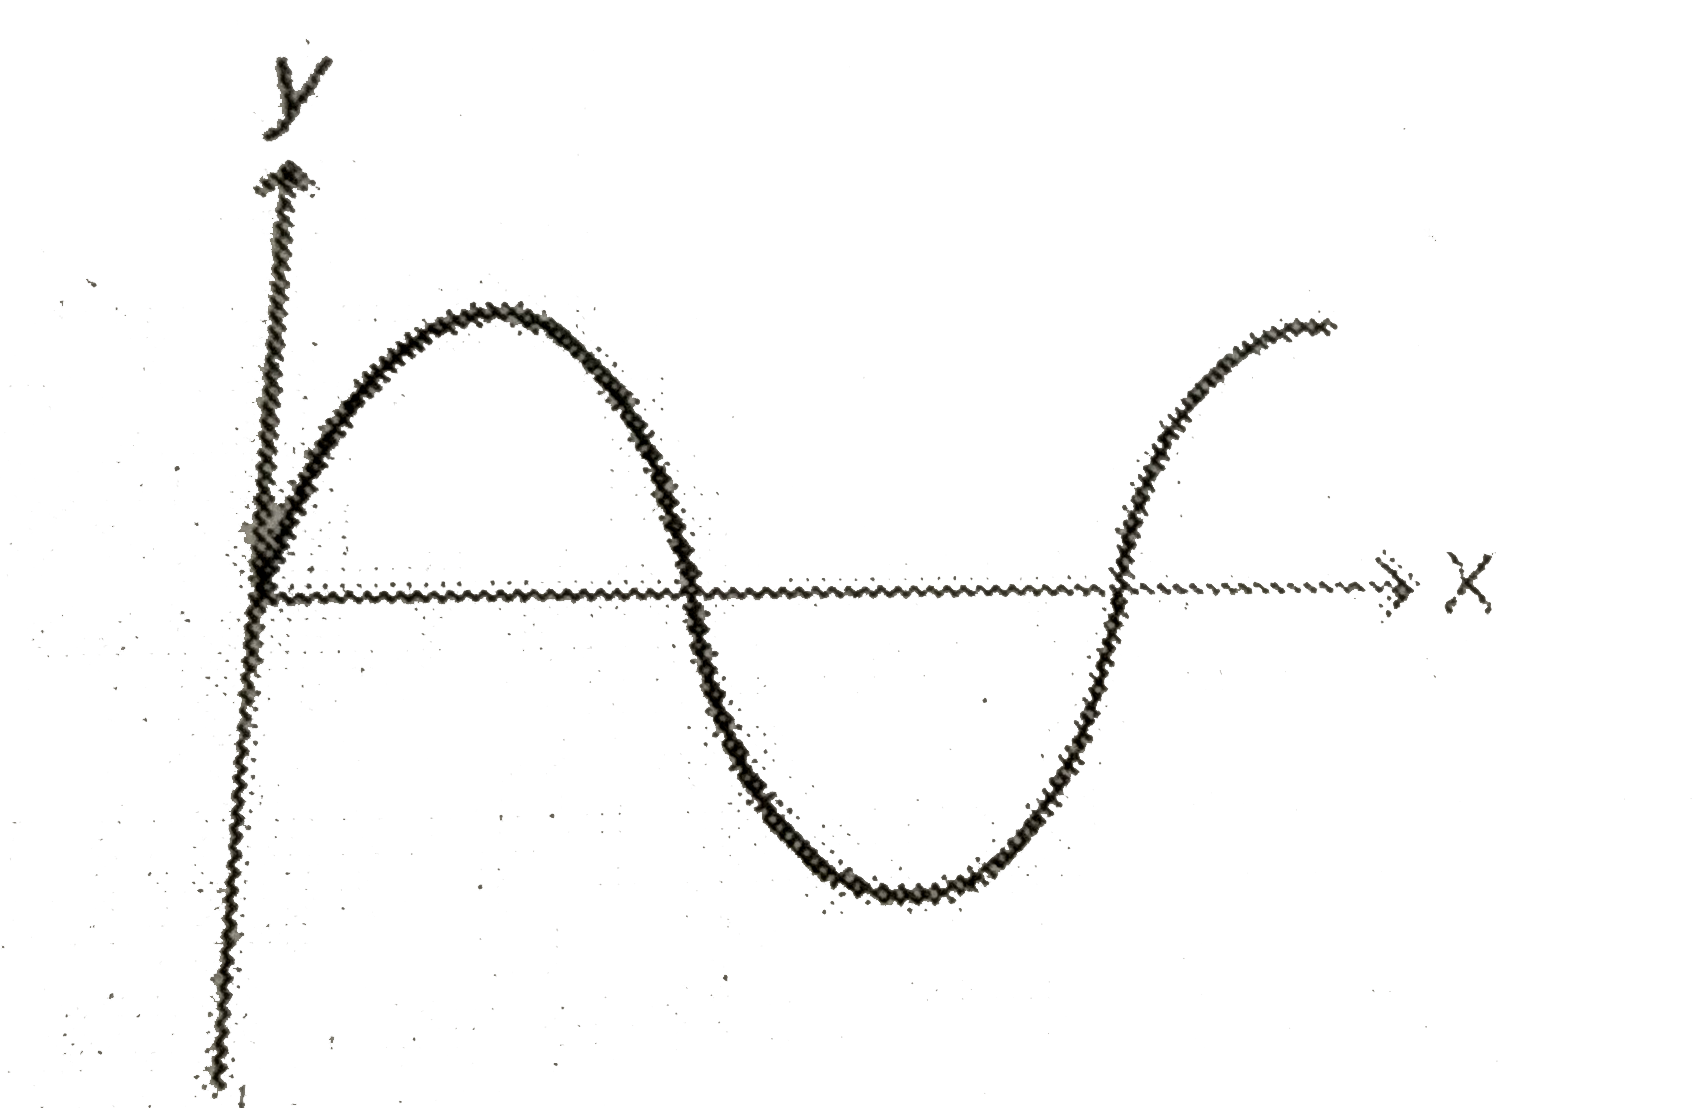
If the temperature at B and C are T1 and T2 respectively, then it can be concluded :View Solutionin a sine wave ,positive of different particles at time t=0 is shown in figure. The equation for this wave if it is travelling along positive x -axis can be
 View Solution
The position of a particle along X-axis at time t is given by x=2+t−3t2. The displacement and the distance travelled in the interval, t = 0 to t = 1 are respectively
View SolutionWrite the dimensions of a/b in the relation P=a−t2bx , where P is the pressure , x is the distance , and t is the time .
View Solution

