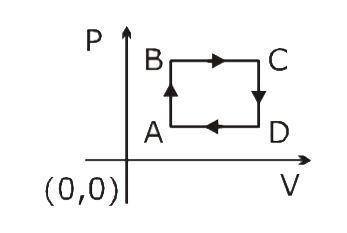
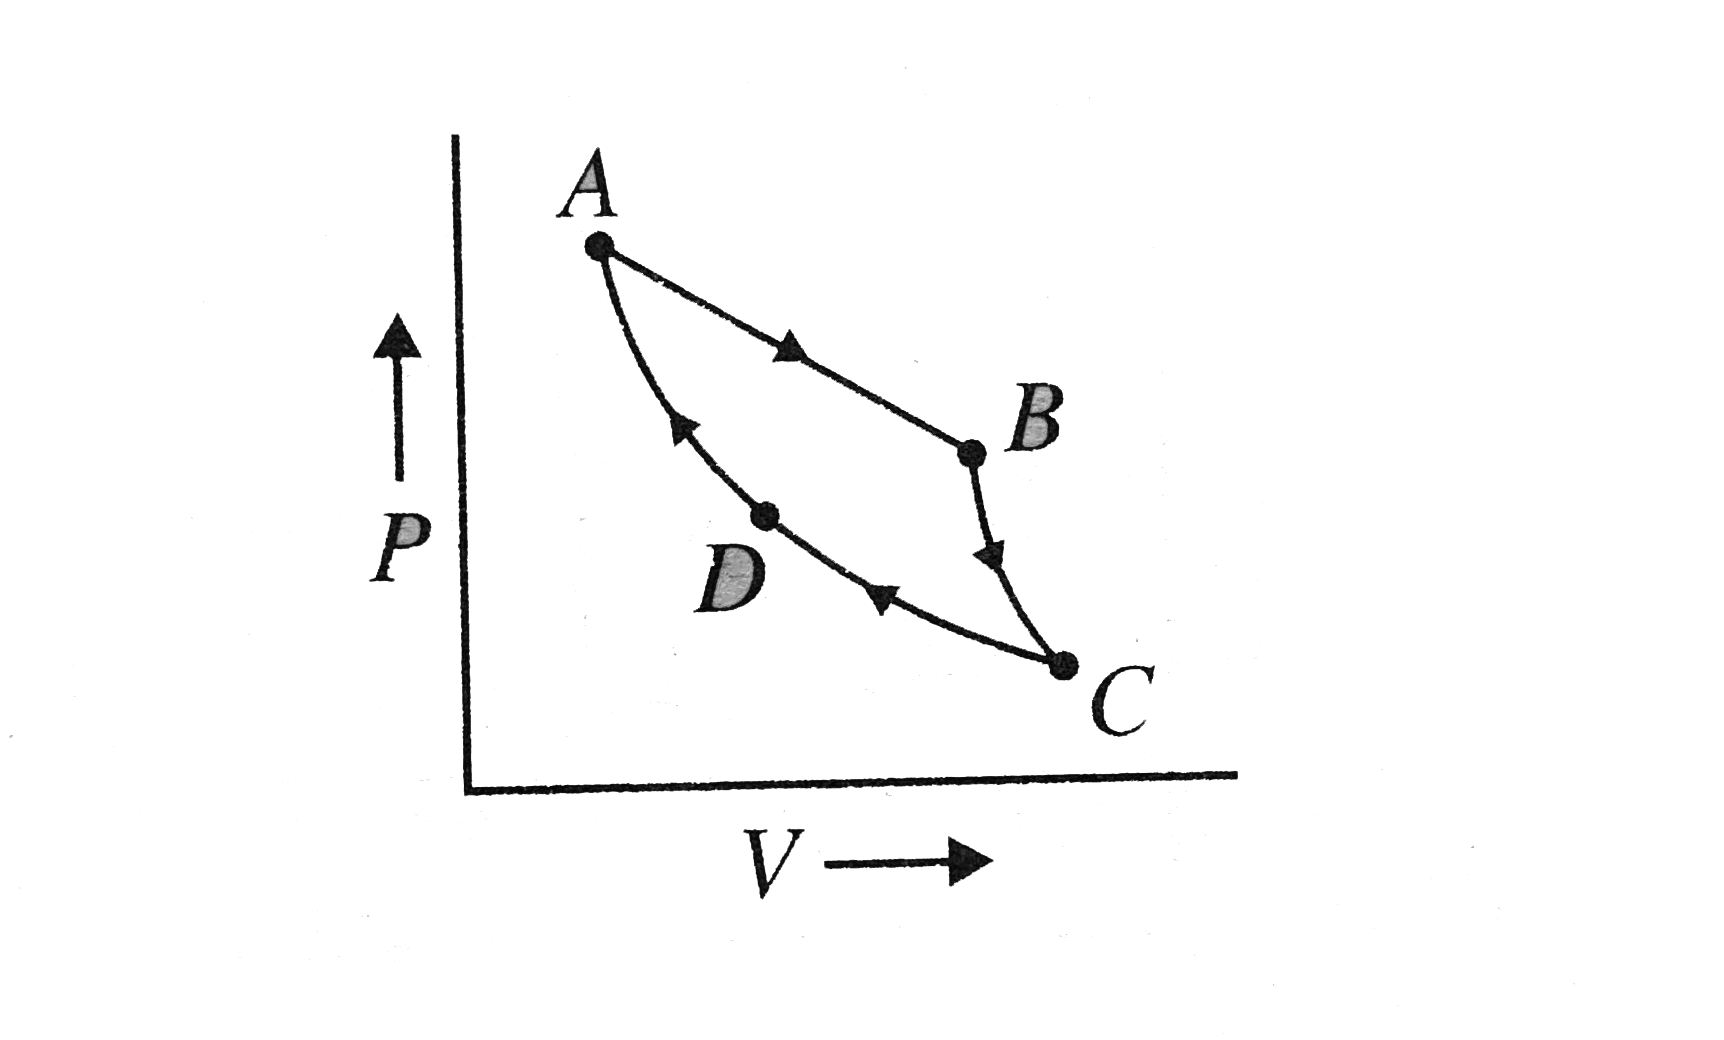
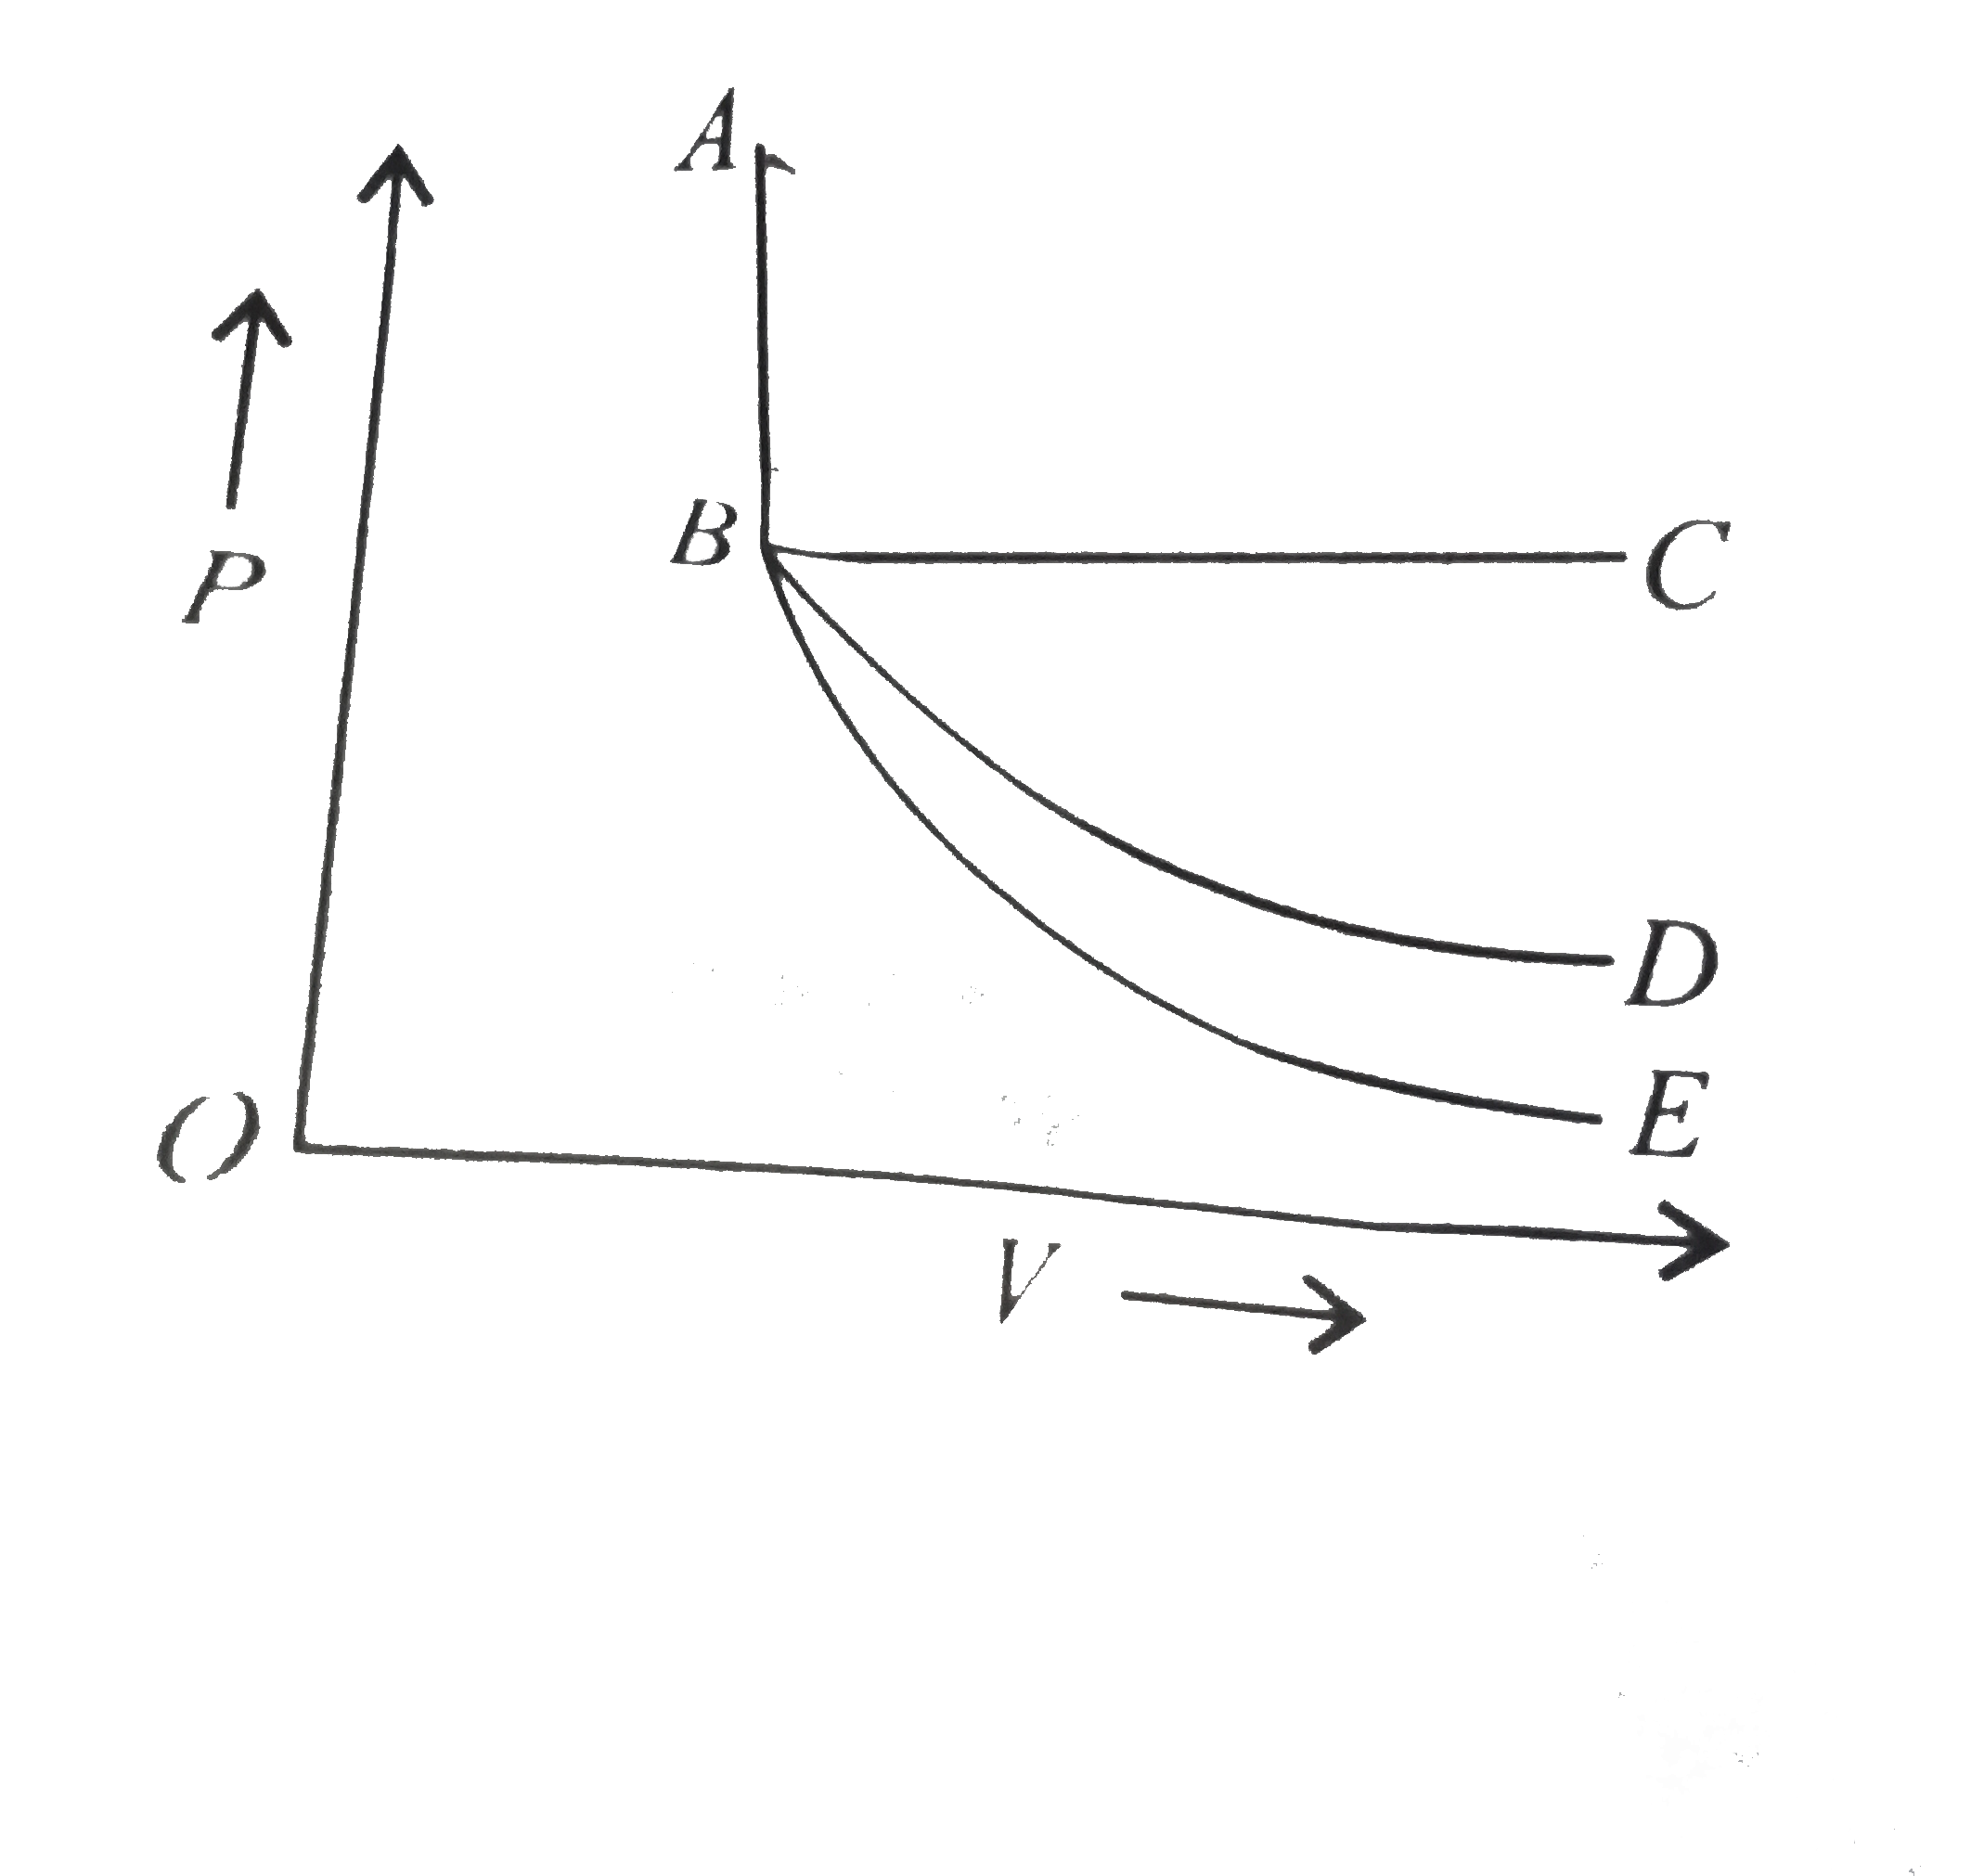
Figure. Shows the diagram for a Carnot cycle. In this diagram
Video Solution
|
Answer
Step by step video solution for Figure. Shows the P-V diagram for a Carnot cycle. In this diagram by Physics experts to help you in doubts & scoring excellent marks in Class 11 exams.
Updated on:21/07/2023
Topper's Solved these Questions
Similar Questions
Knowledge Check
- Question 1 - Select One
The given figure shows the P−Vdiagram for a Camot cycle. In this diagram,
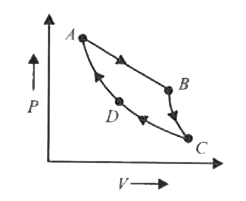 Acurve AB represents isothermal process and BC adiabatic processBcurve AB represents adiabatic process and BC isothermal processCcurve CD represents isothermal process and DA adiabatic processDcurve CD represents adiabatic process and DA isothermal process.
 - Question 2 - Select One
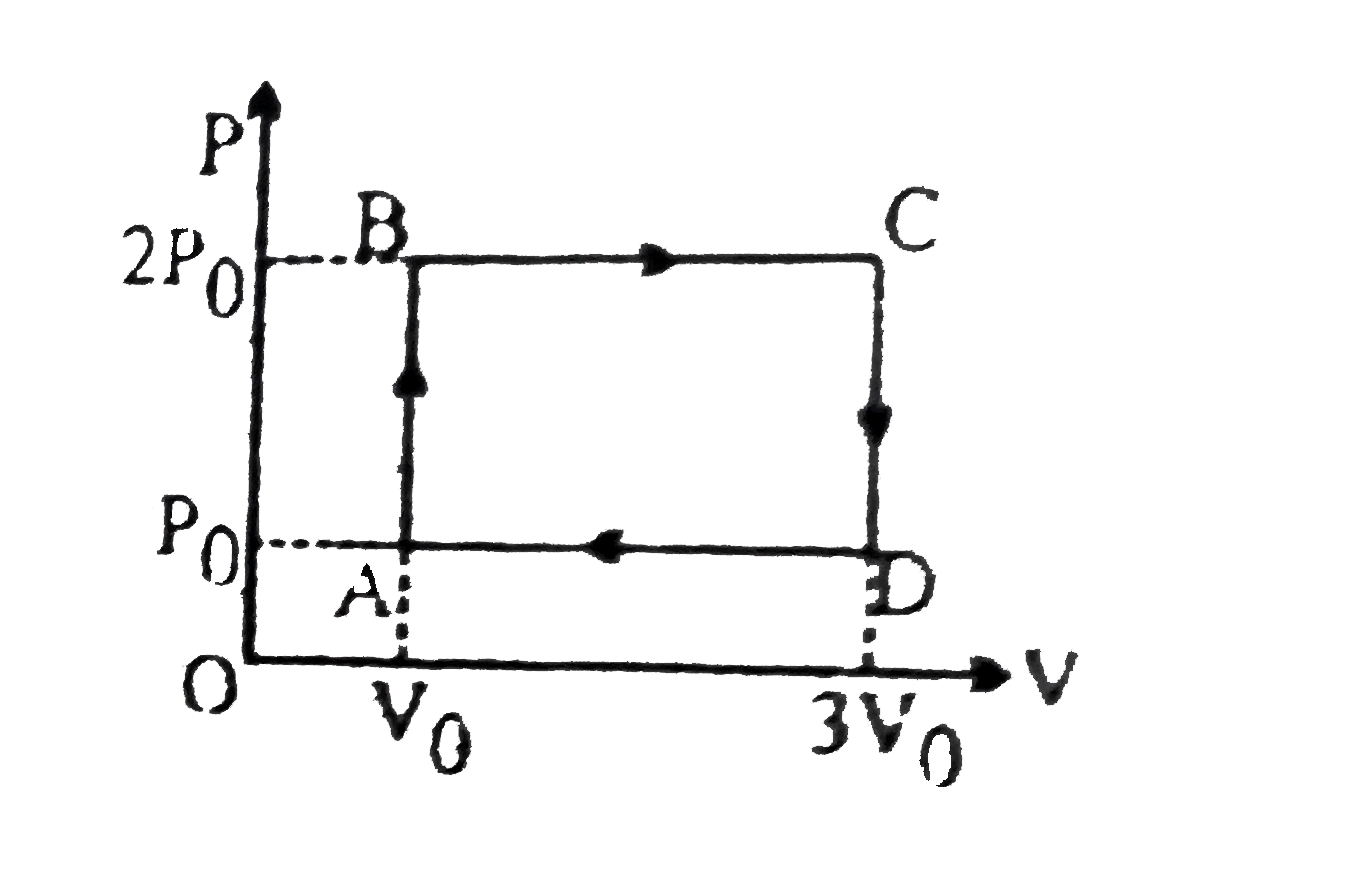
The figure shows P - V diagram of a thermodynamic cycle
Identify the diagram which correctly represents the heat inflow and outflow of the systemA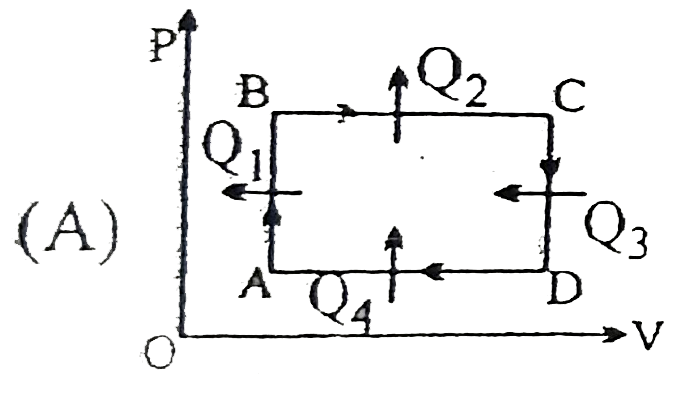 B
B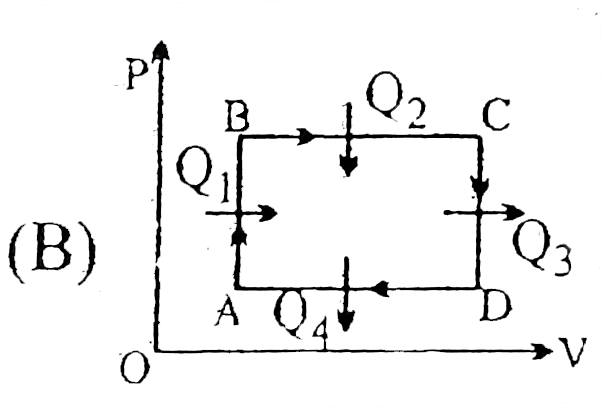 C
C D
D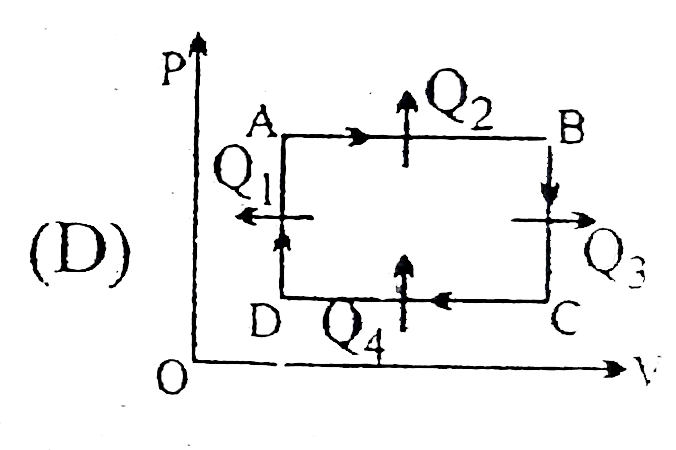
- Question 3 - Select One
The figure shows P - V diagram of a thermodynamic cycle
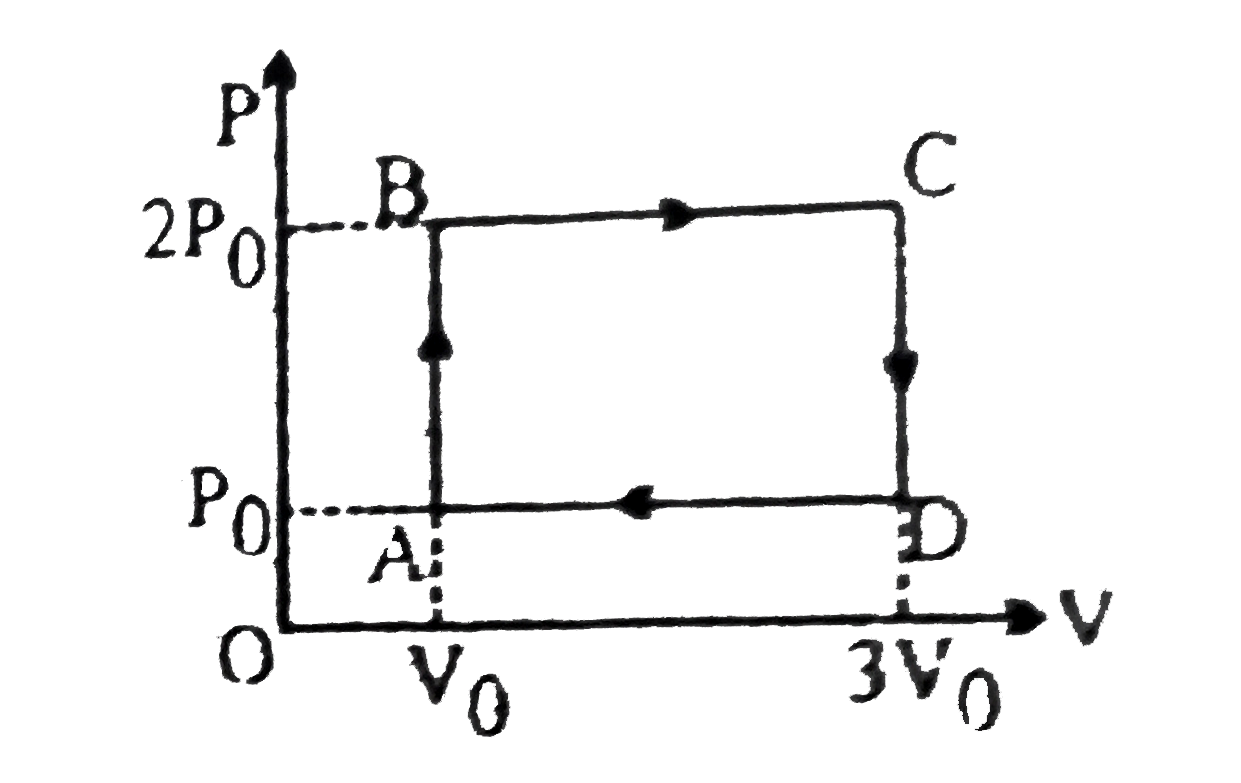
The work done in the cycle isA2P0V0B3P0V0CP0V0D6P0V0
Represent the Carnot cycle on a VT diagram.
View SolutionA thermodynamic cycle xyzx is shown on a V-T diagram.
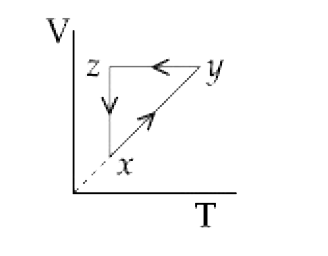
The P-V diagram that best describe this cycle is: (Diagrams are schematic and not to scale).View SolutionThe figure shows P - V diagram of a thermodynamic cycle
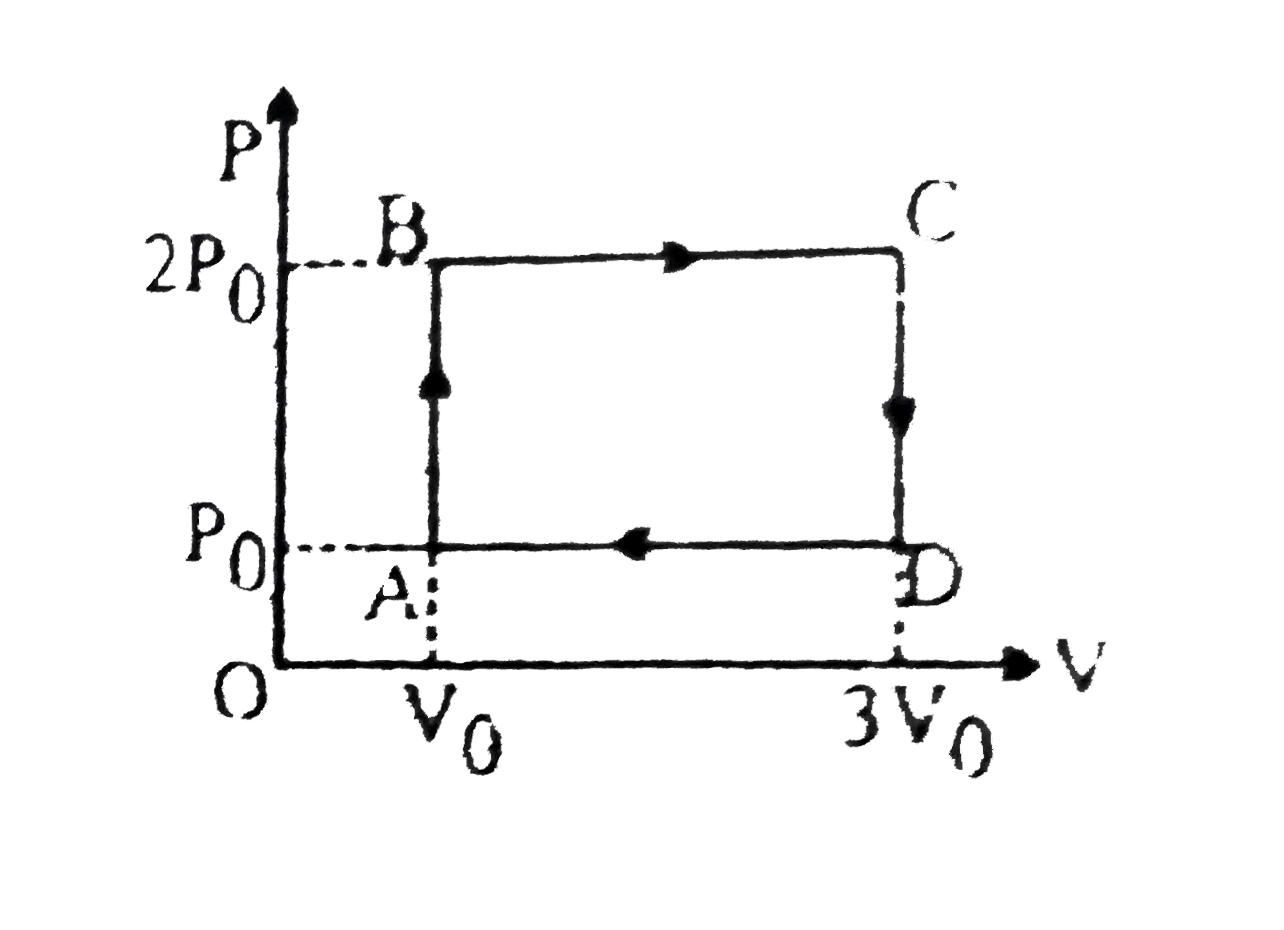
Choose the correct V - T diagram for the given cyclic process.View SolutionThe figure shows P - V diagram of a thermodynamic cycle
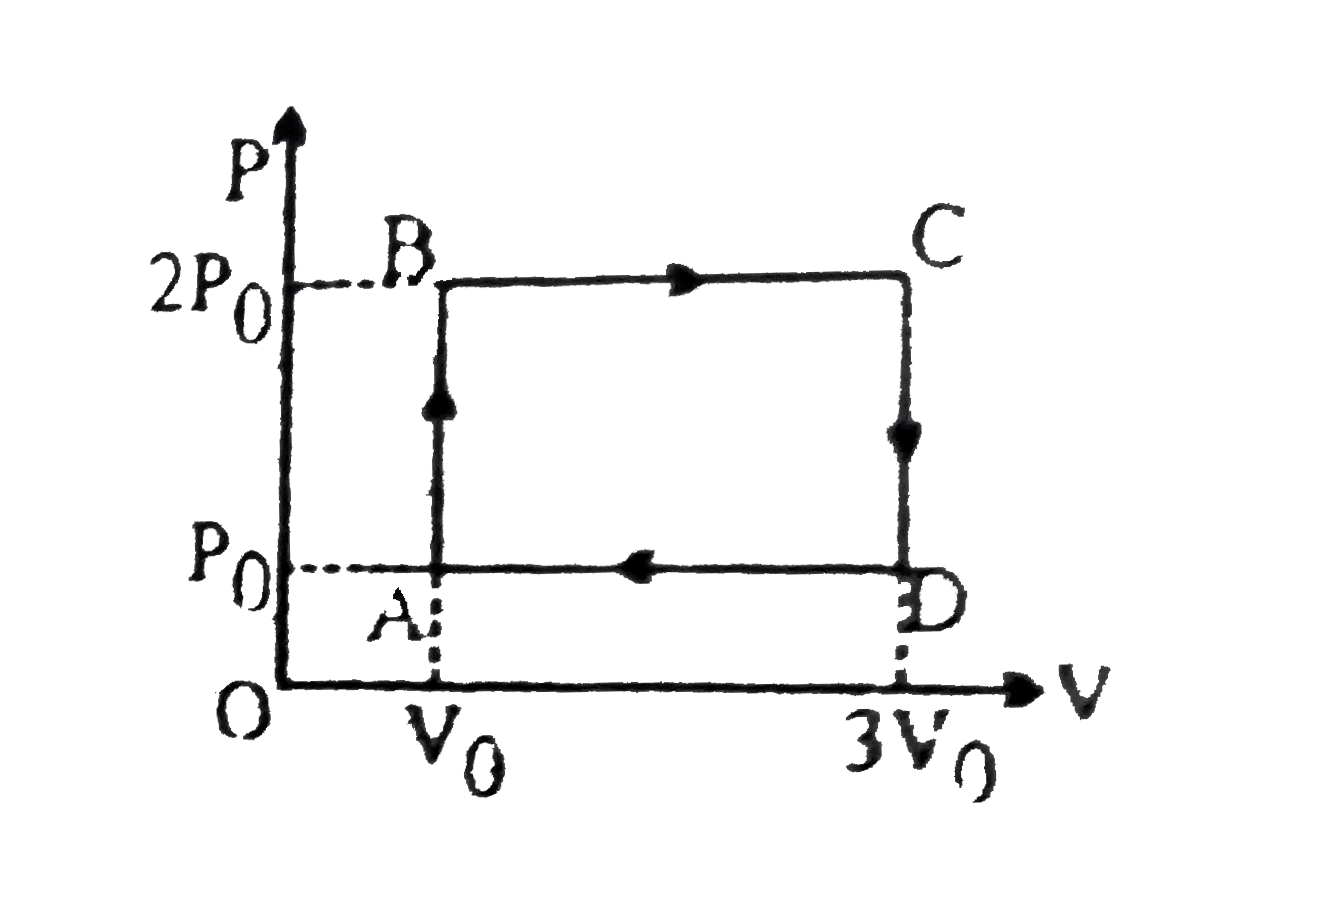
Choose the correct V - T diagram for the given cyclic process.View SolutionIn P−V diagram shown below,
 View Solution


