Figure shows the position of a particle moving on the X-axis as a function of time.
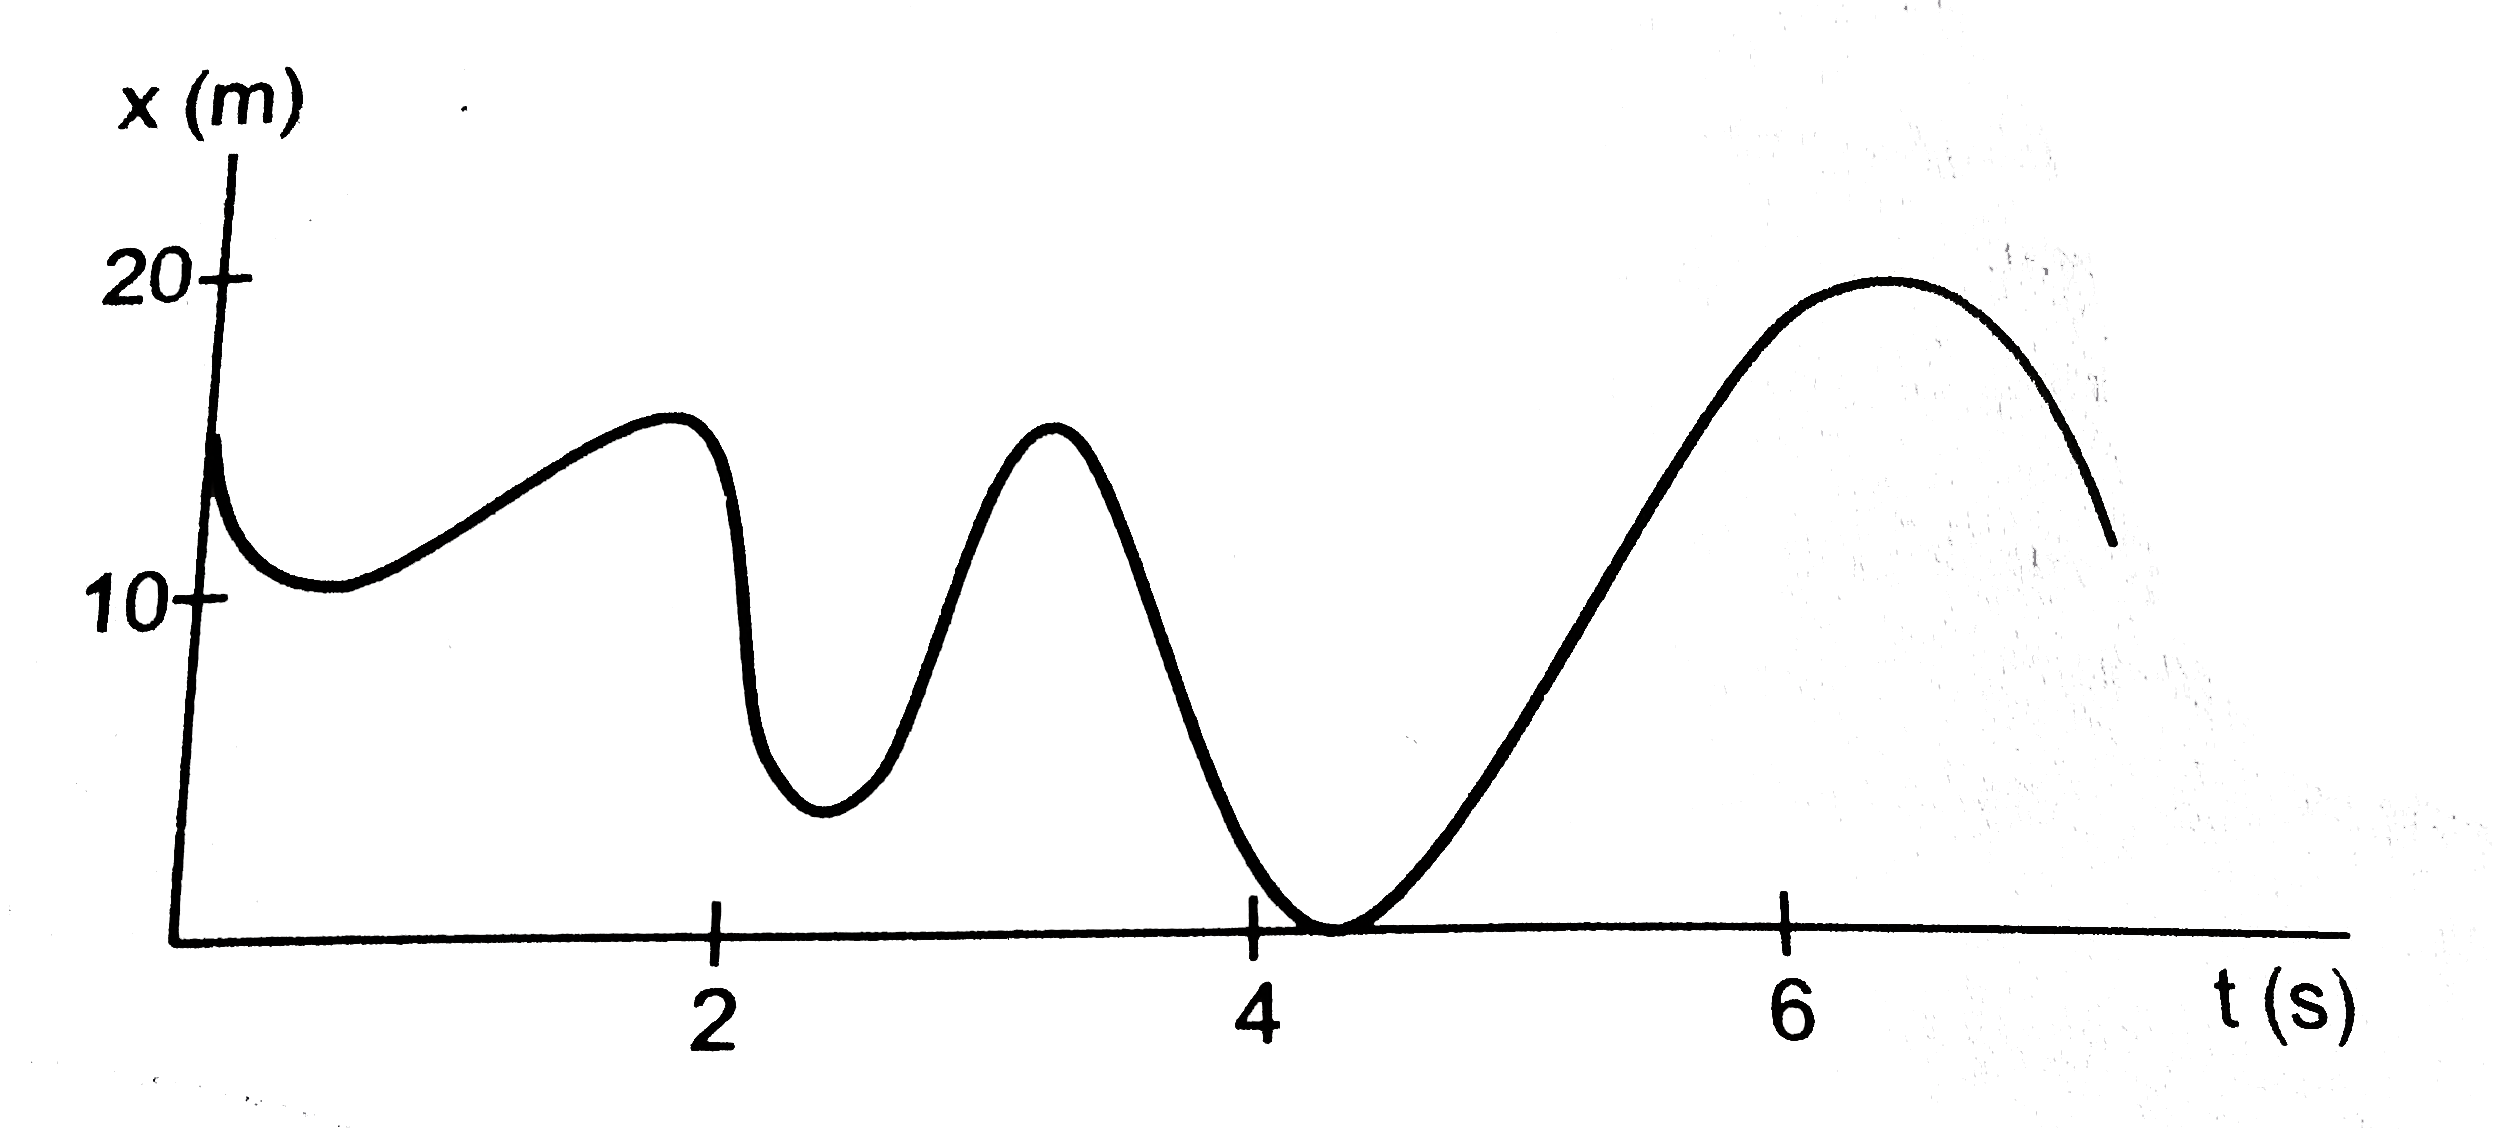
The particle has come to rest 6 times
The maximum speed is at t=6 s.
The velocity remains positive for t=0 to t=6s.
The average velocity for the total period shown is negative
The correct Answer is:A
Step by step video, text & image solution for Figure shows the position of a particle moving on the X-axis as a function of time. by Physics experts to help you in doubts & scoring excellent marks in Class 11 exams.
Updated on:21/07/2023Topper's Solved these Questions
- REST AND MOTION : KINEMATICSBOOK - HC VERMACHAPTER - REST AND MOTION : KINEMATICSEXERCISE - Exercises
51 Videos
- REST AND MOTION : KINEMATICSBOOK - HC VERMACHAPTER - REST AND MOTION : KINEMATICSEXERCISE - Objective 1
13 Videos
- PHYSICS AND MATHEMATICSBOOK - HC VERMACHAPTER - PHYSICS AND MATHEMATICSEXERCISE - Exercises
34 Videos
- ROTATIONAL MECHANICSBOOK - HC VERMACHAPTER - ROTATIONAL MECHANICSEXERCISE - Exercises
86 Videos
Similar Questions
Figure shows the graph of the x-coordinaste of a particle going along the X-axis as a function of time.Find a. te average velocity during 0 to 10s, b. instantaneous velocity at 2,5,8 and 12s.
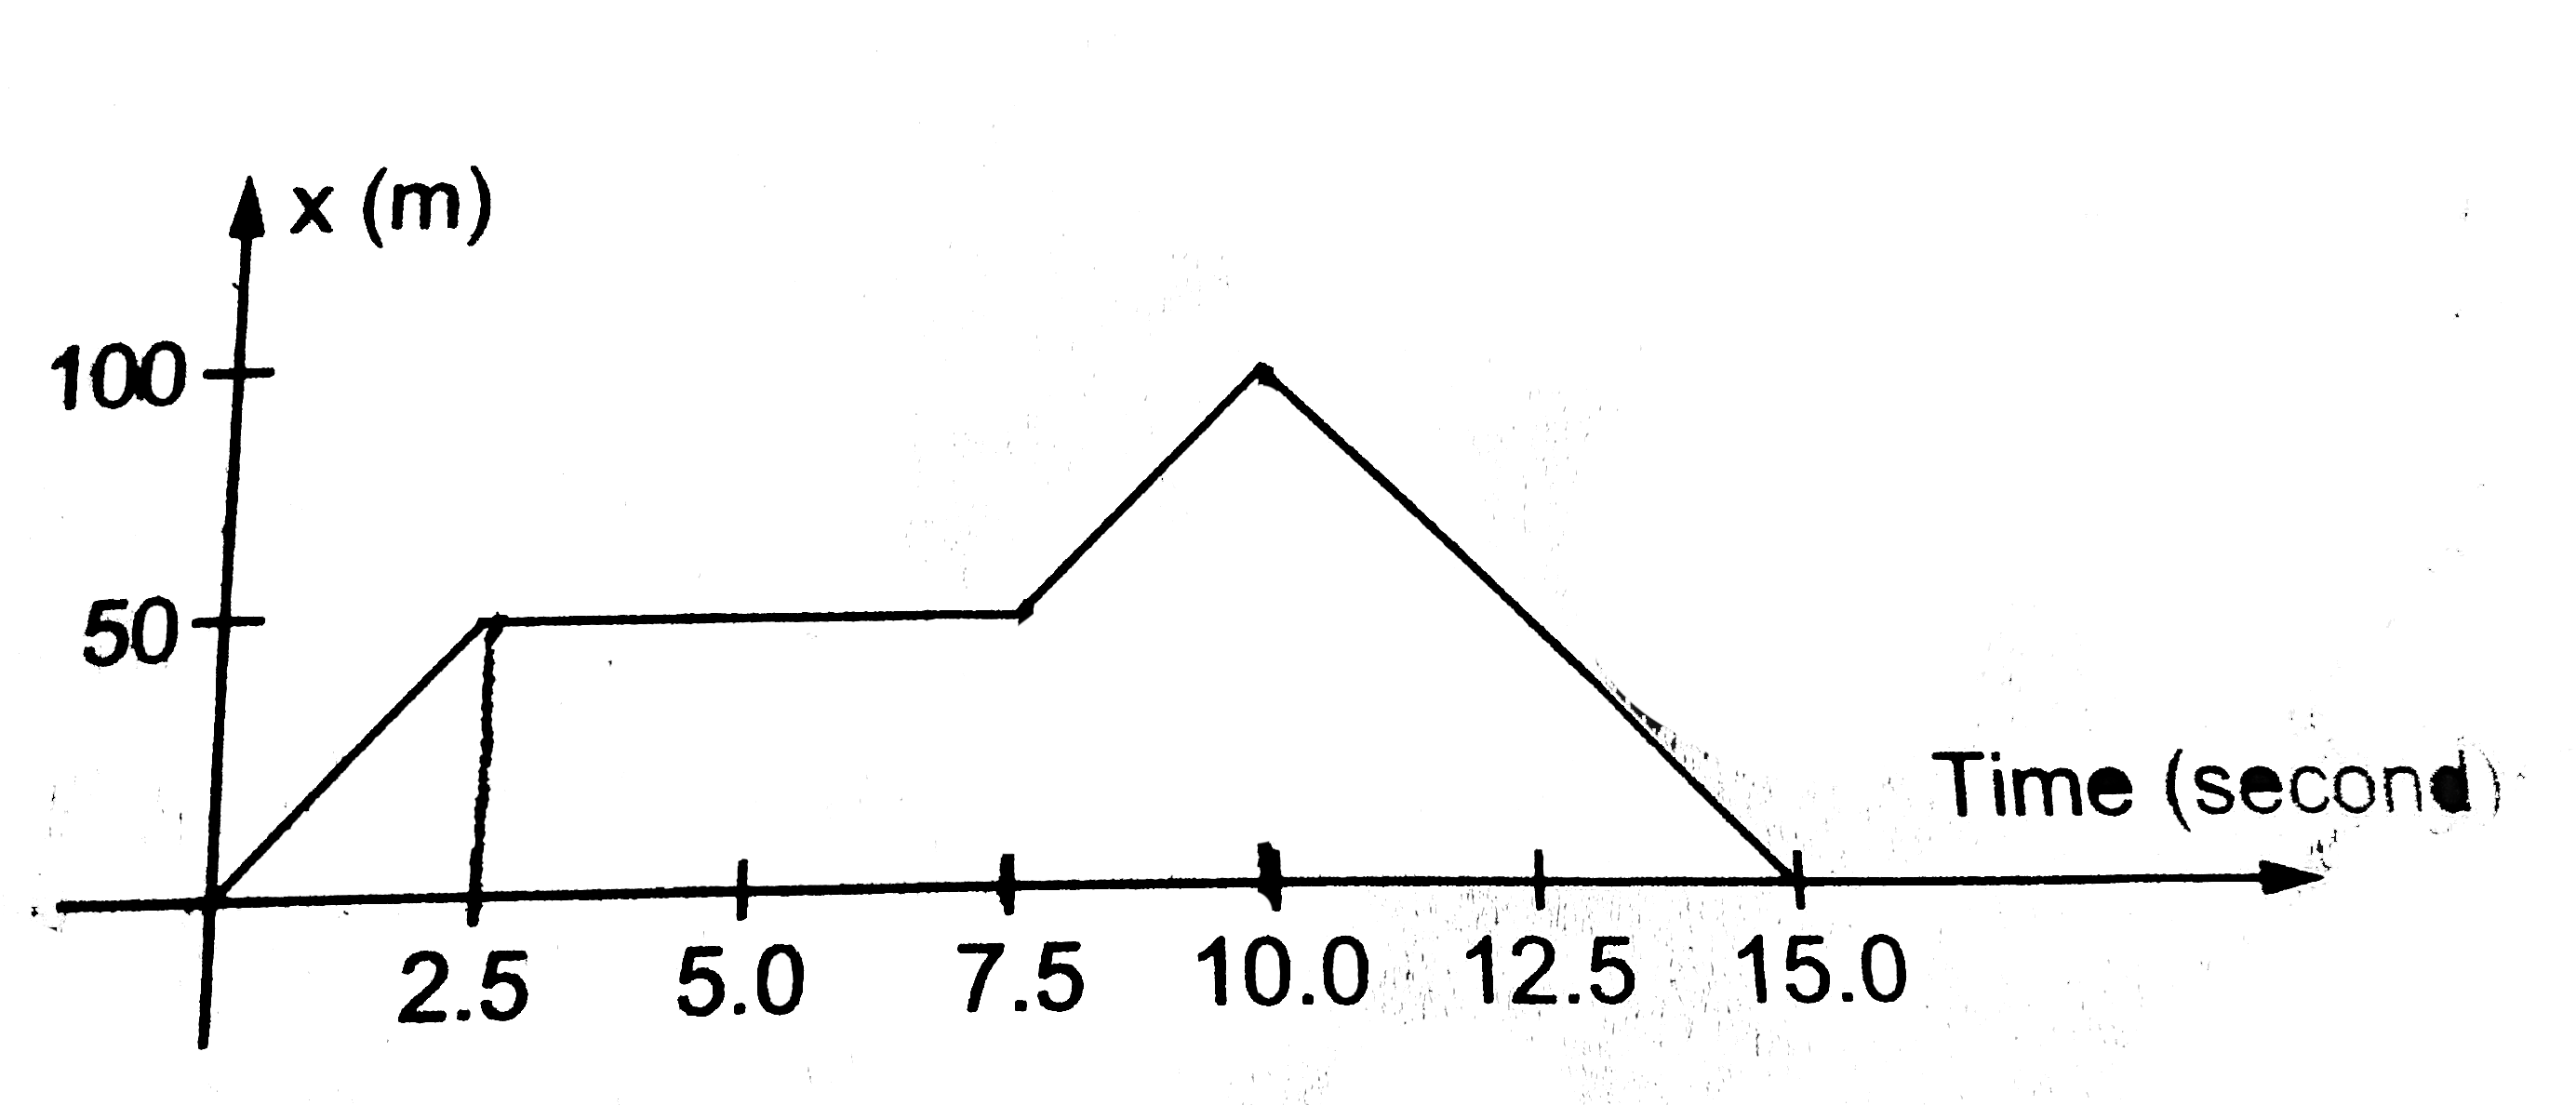
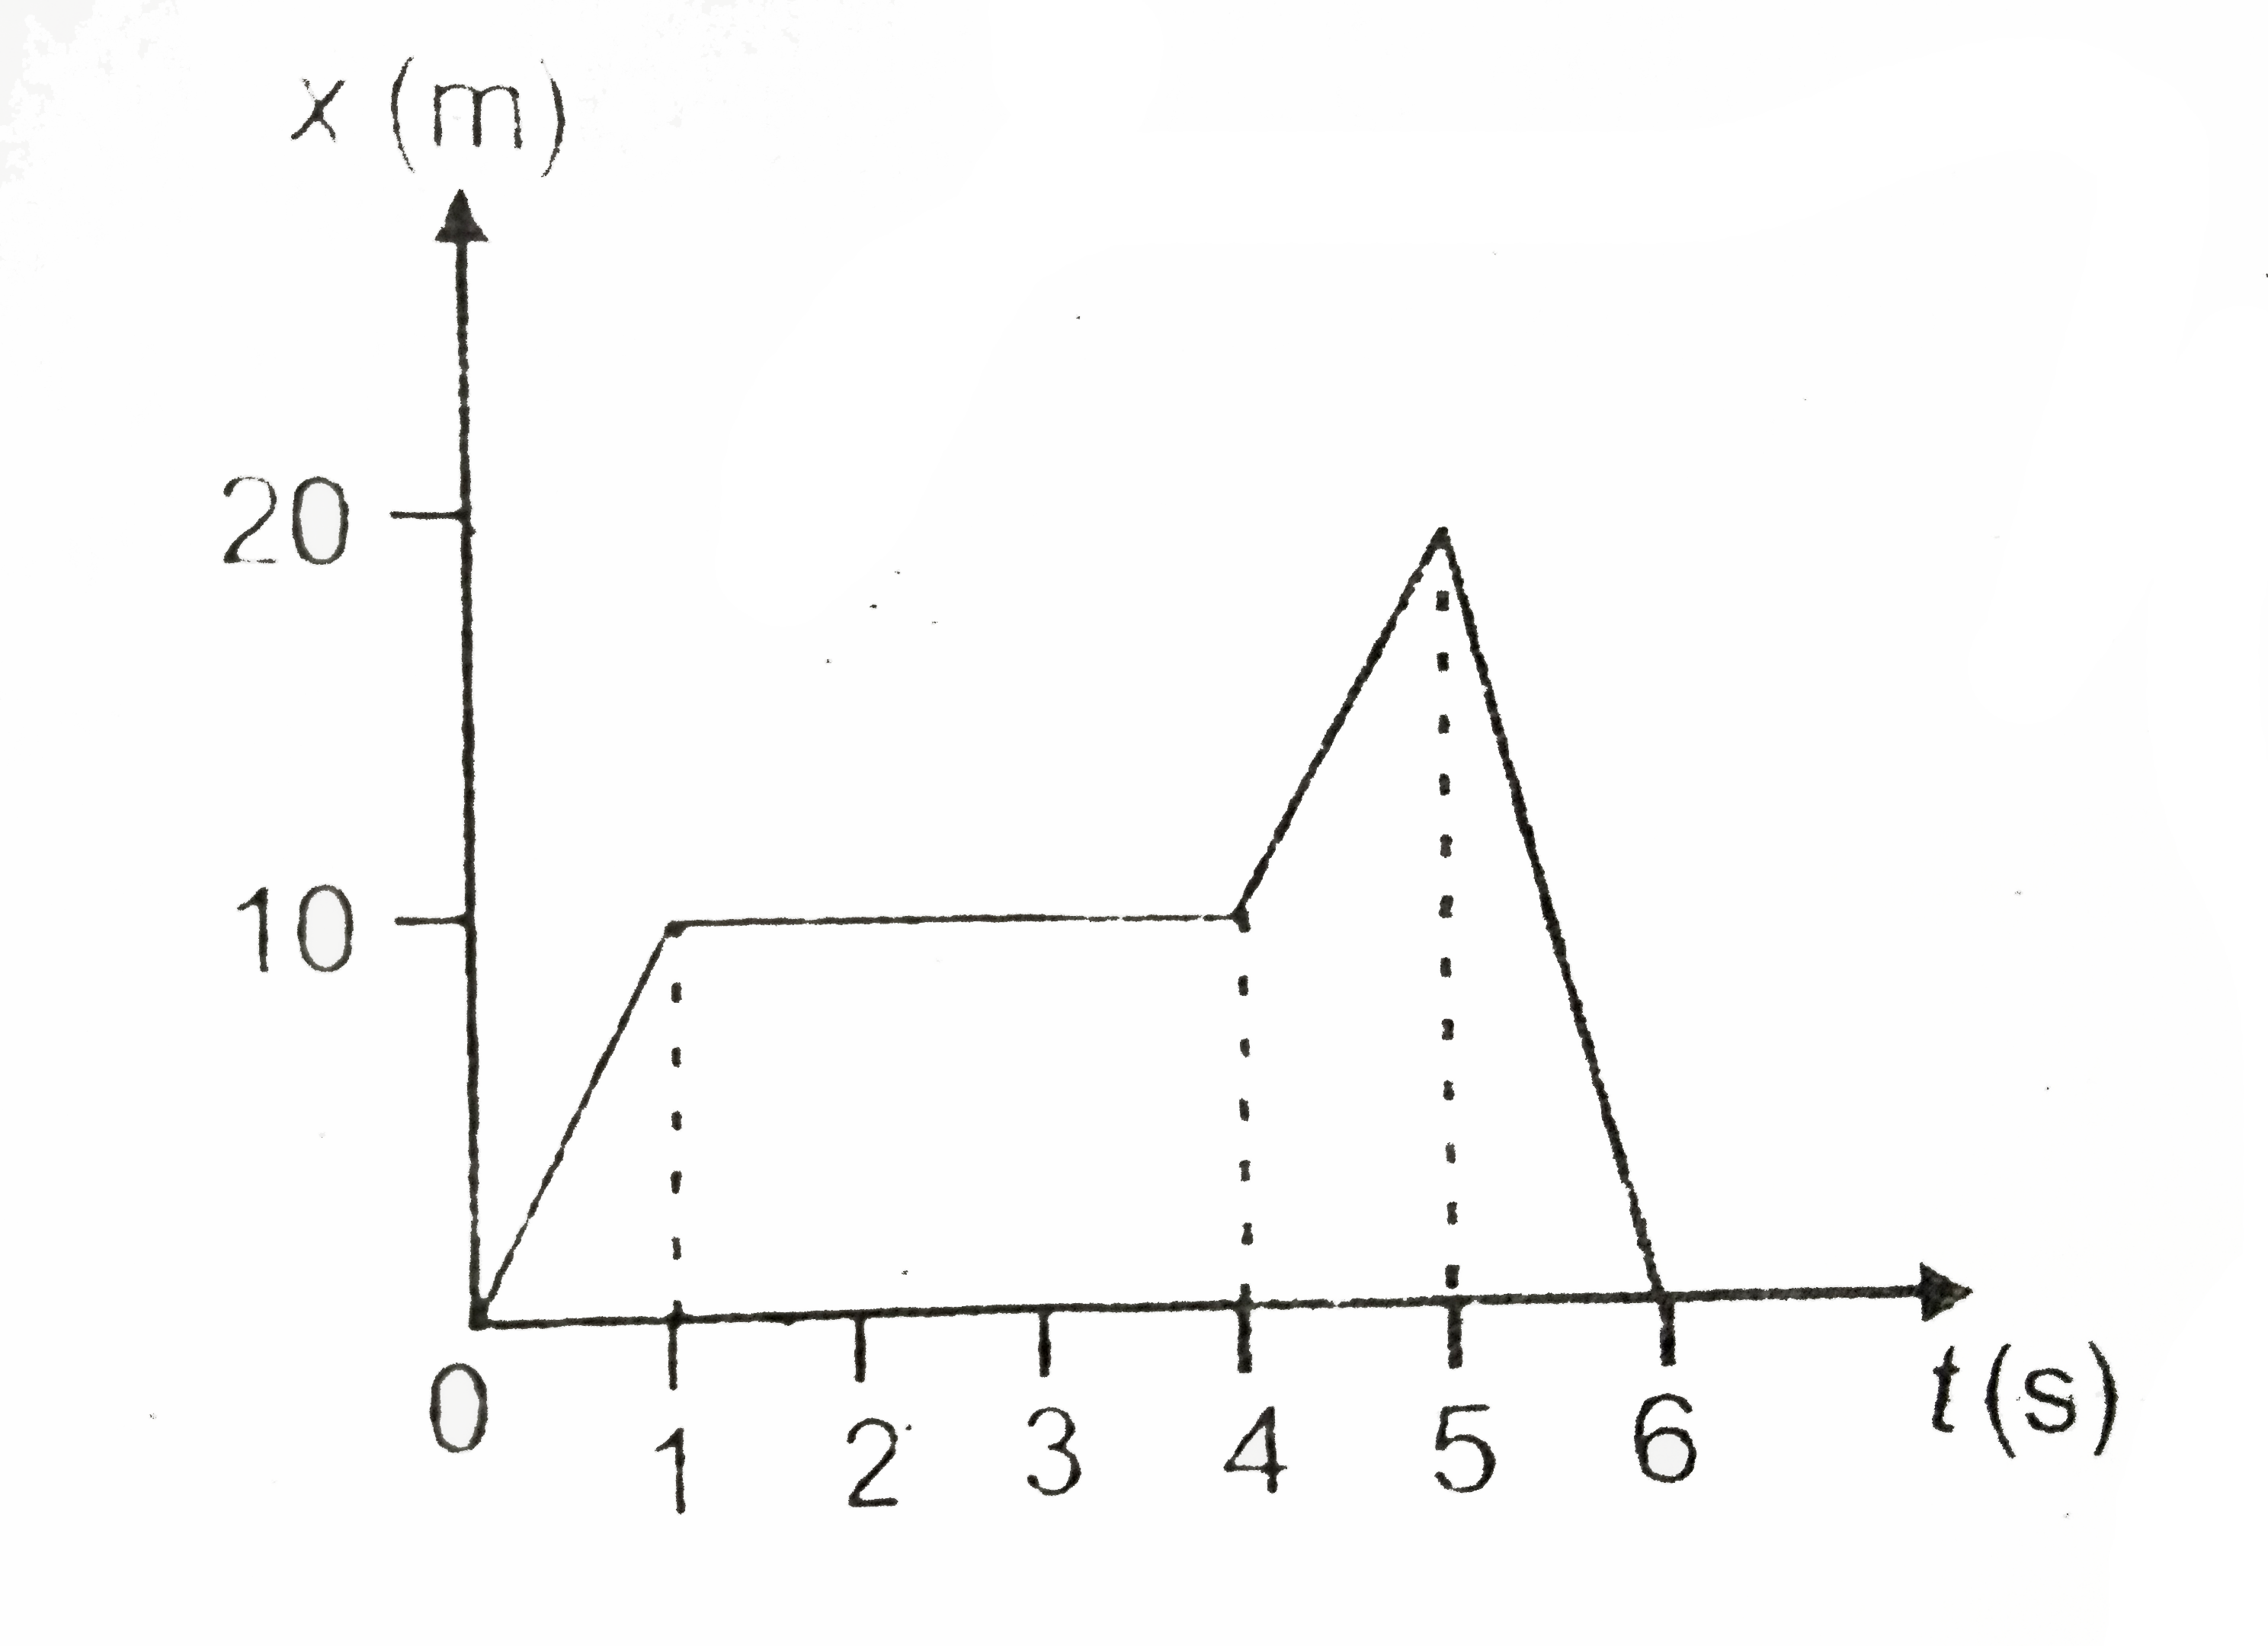
View SolutionFigure shows the graph of x-coordinate of a particle moving along x-axis as a function of time. Average velocity during t = 0 to 4 s and instantaneous velocity at t = 4.113 s respectively will be
View Solution
Knowledge Check
Figure shows the displacement of a particle going along the X-axis as a function of time. The force acting on the particle is zero in the region
 AABBBCCCDDDE
Figure shows the position-time graph of a particle moving on the X--axis. Which of these option correctly describes the particle 's motion?
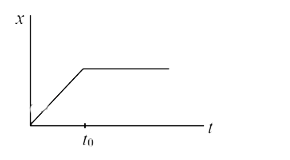 Athe particle is continuously going in positive x directionBthe particle is at restCthe velocity increases up to a time and then becomes constantDthe particle moves at a constant velocity up to a time and then stops
Figure shows the graph of the x-co-ordinate of a particle going along the x-axis as function of time. Find the instantaneous speed of particle at t = 12.5 s (in m/s)
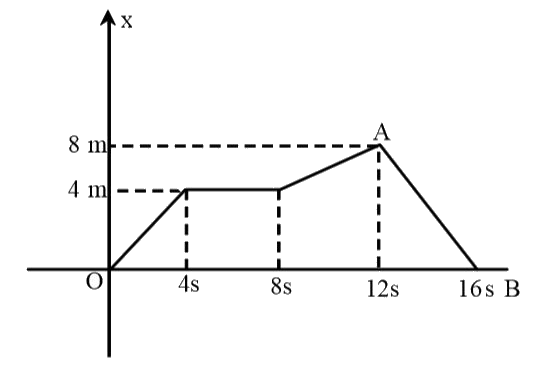 A2m/sB8m/sC4m/sD6m/s
Figure shows the displacement time graph of a particle moving on the X-axis

View SolutionFigure shows the velocity of a particle moving on x-axis.
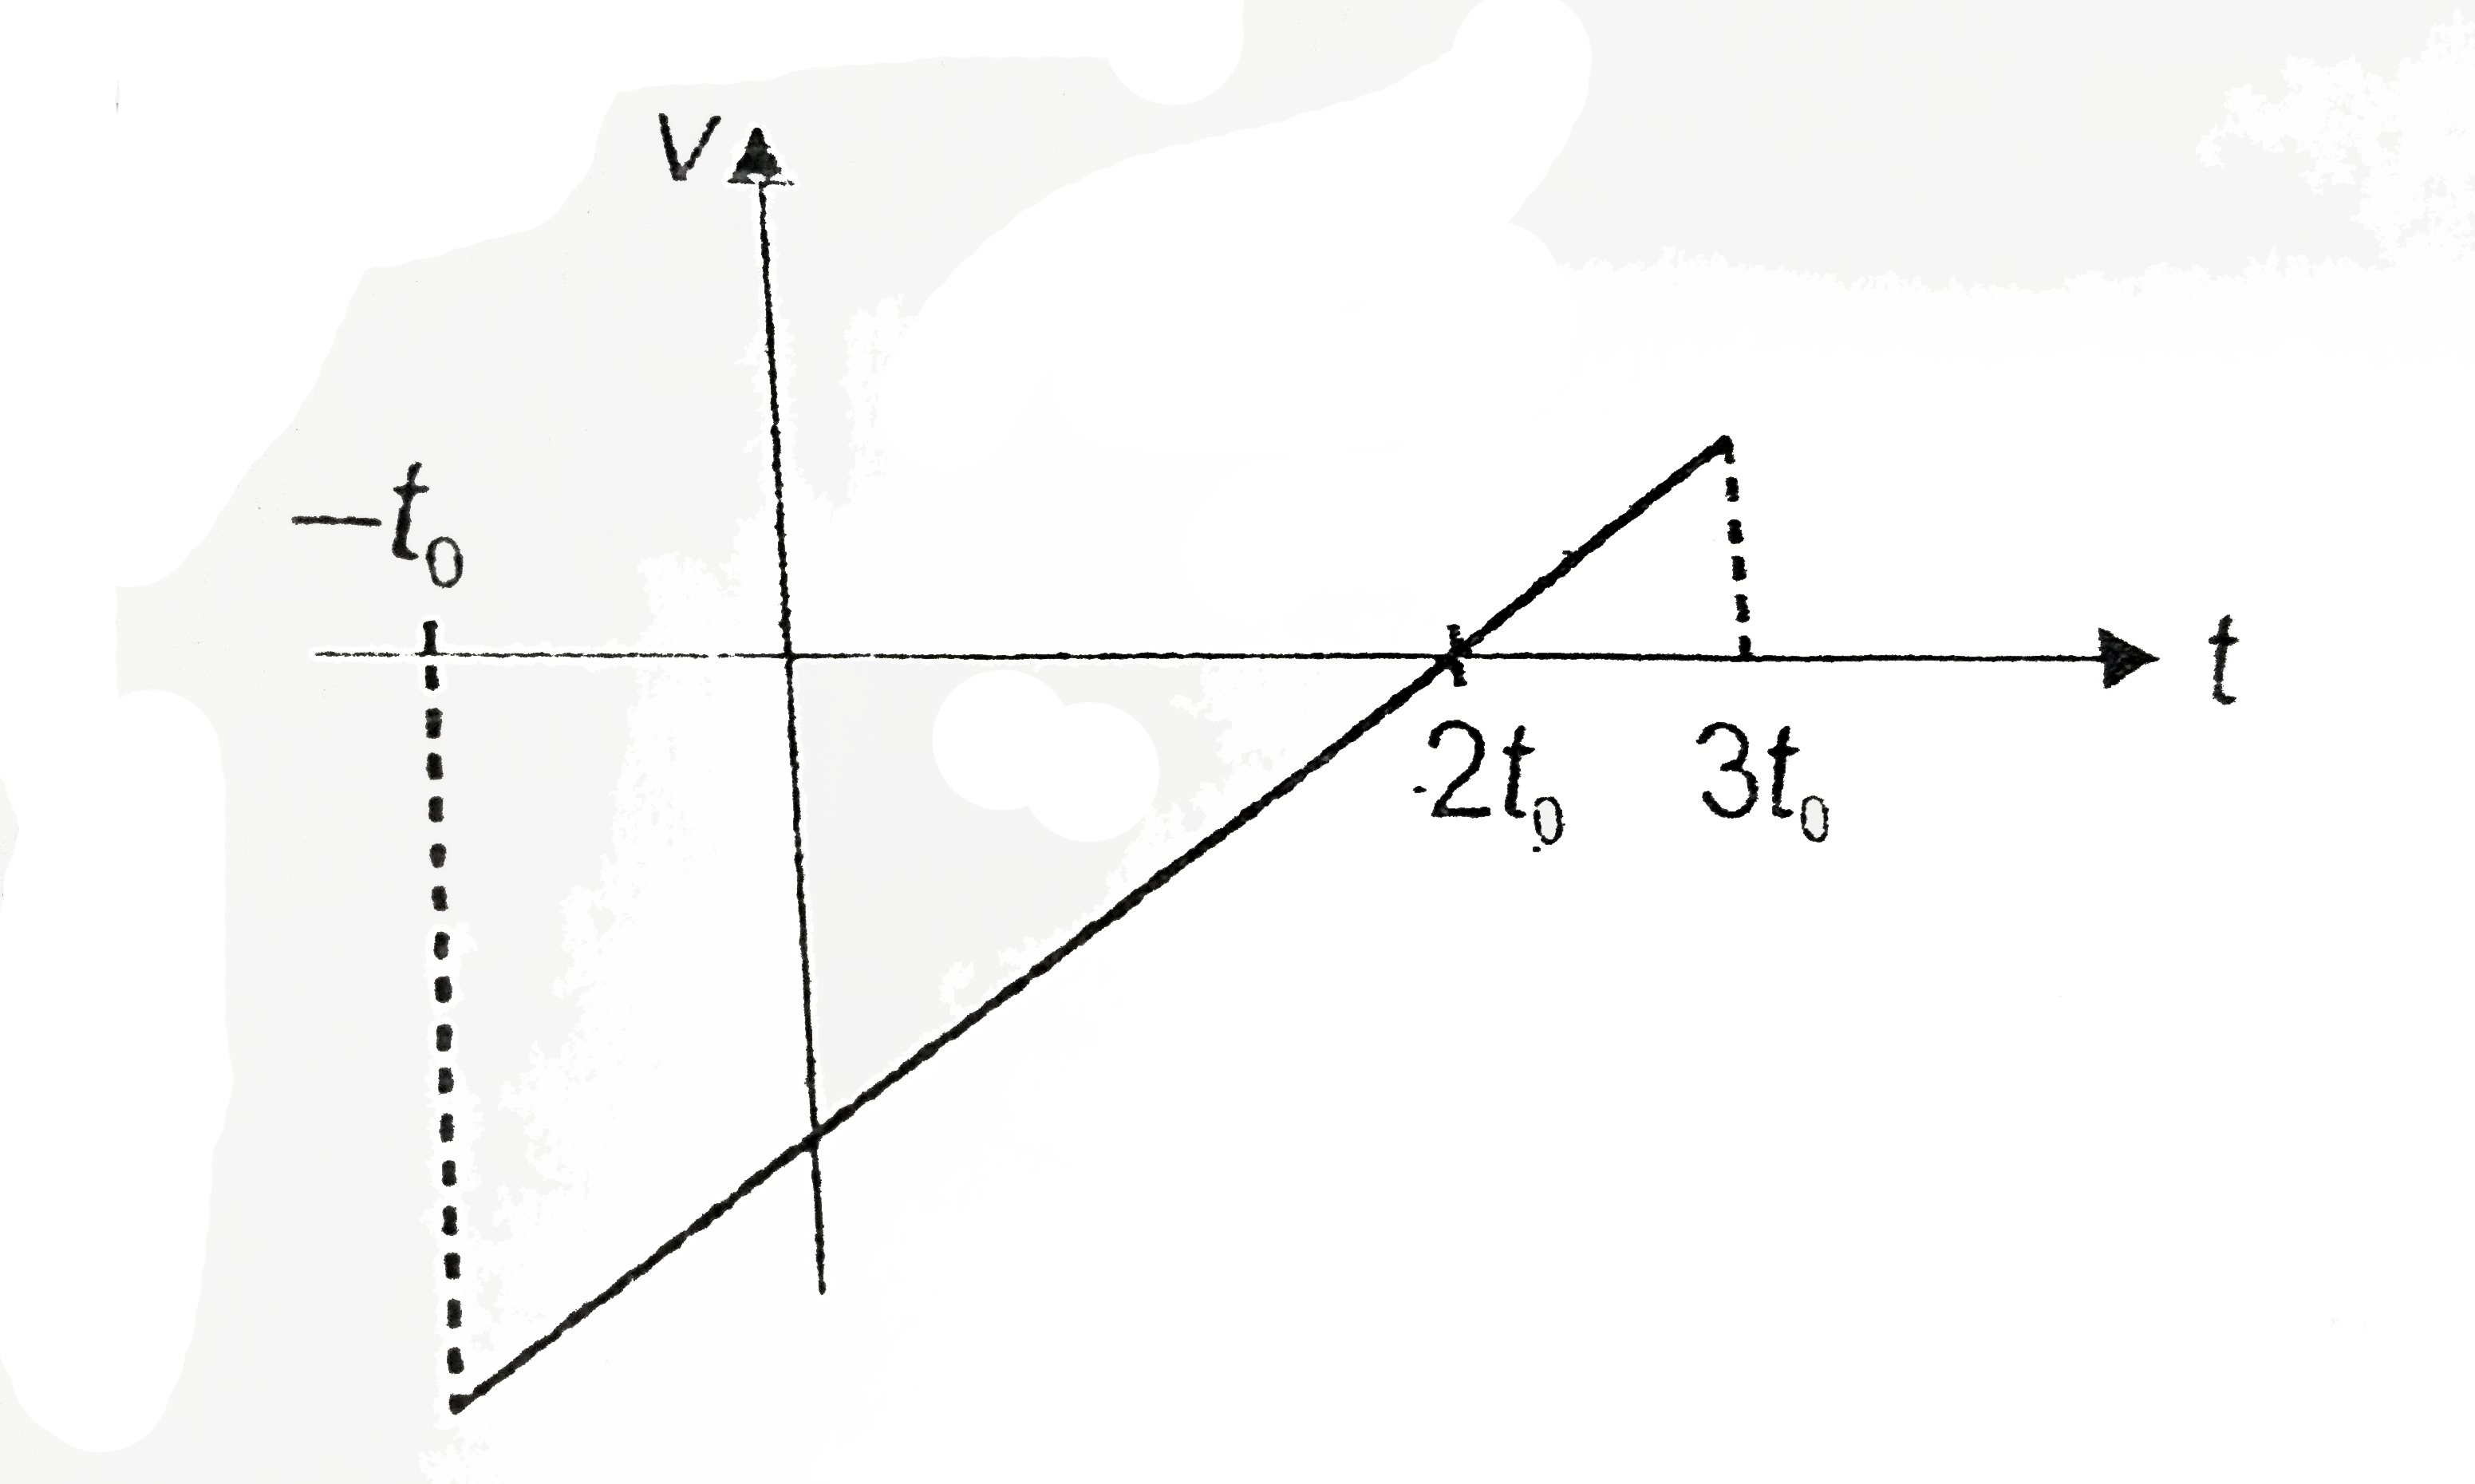
Which of the following statement is correct for the interval shown in graph?
View SolutionFigure shows the graph of x - coordinate of a particle moving along x - axis as a function of time. Average velocity during t = 0 to 6 s and instantaneous velocity at t = 3 s respectively, will be
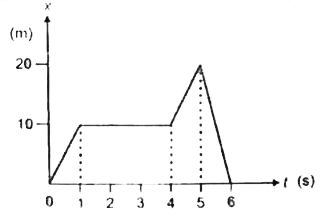
View SolutionFigure show the displacement - time graph of a particle moving on the x-axis
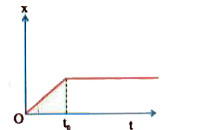
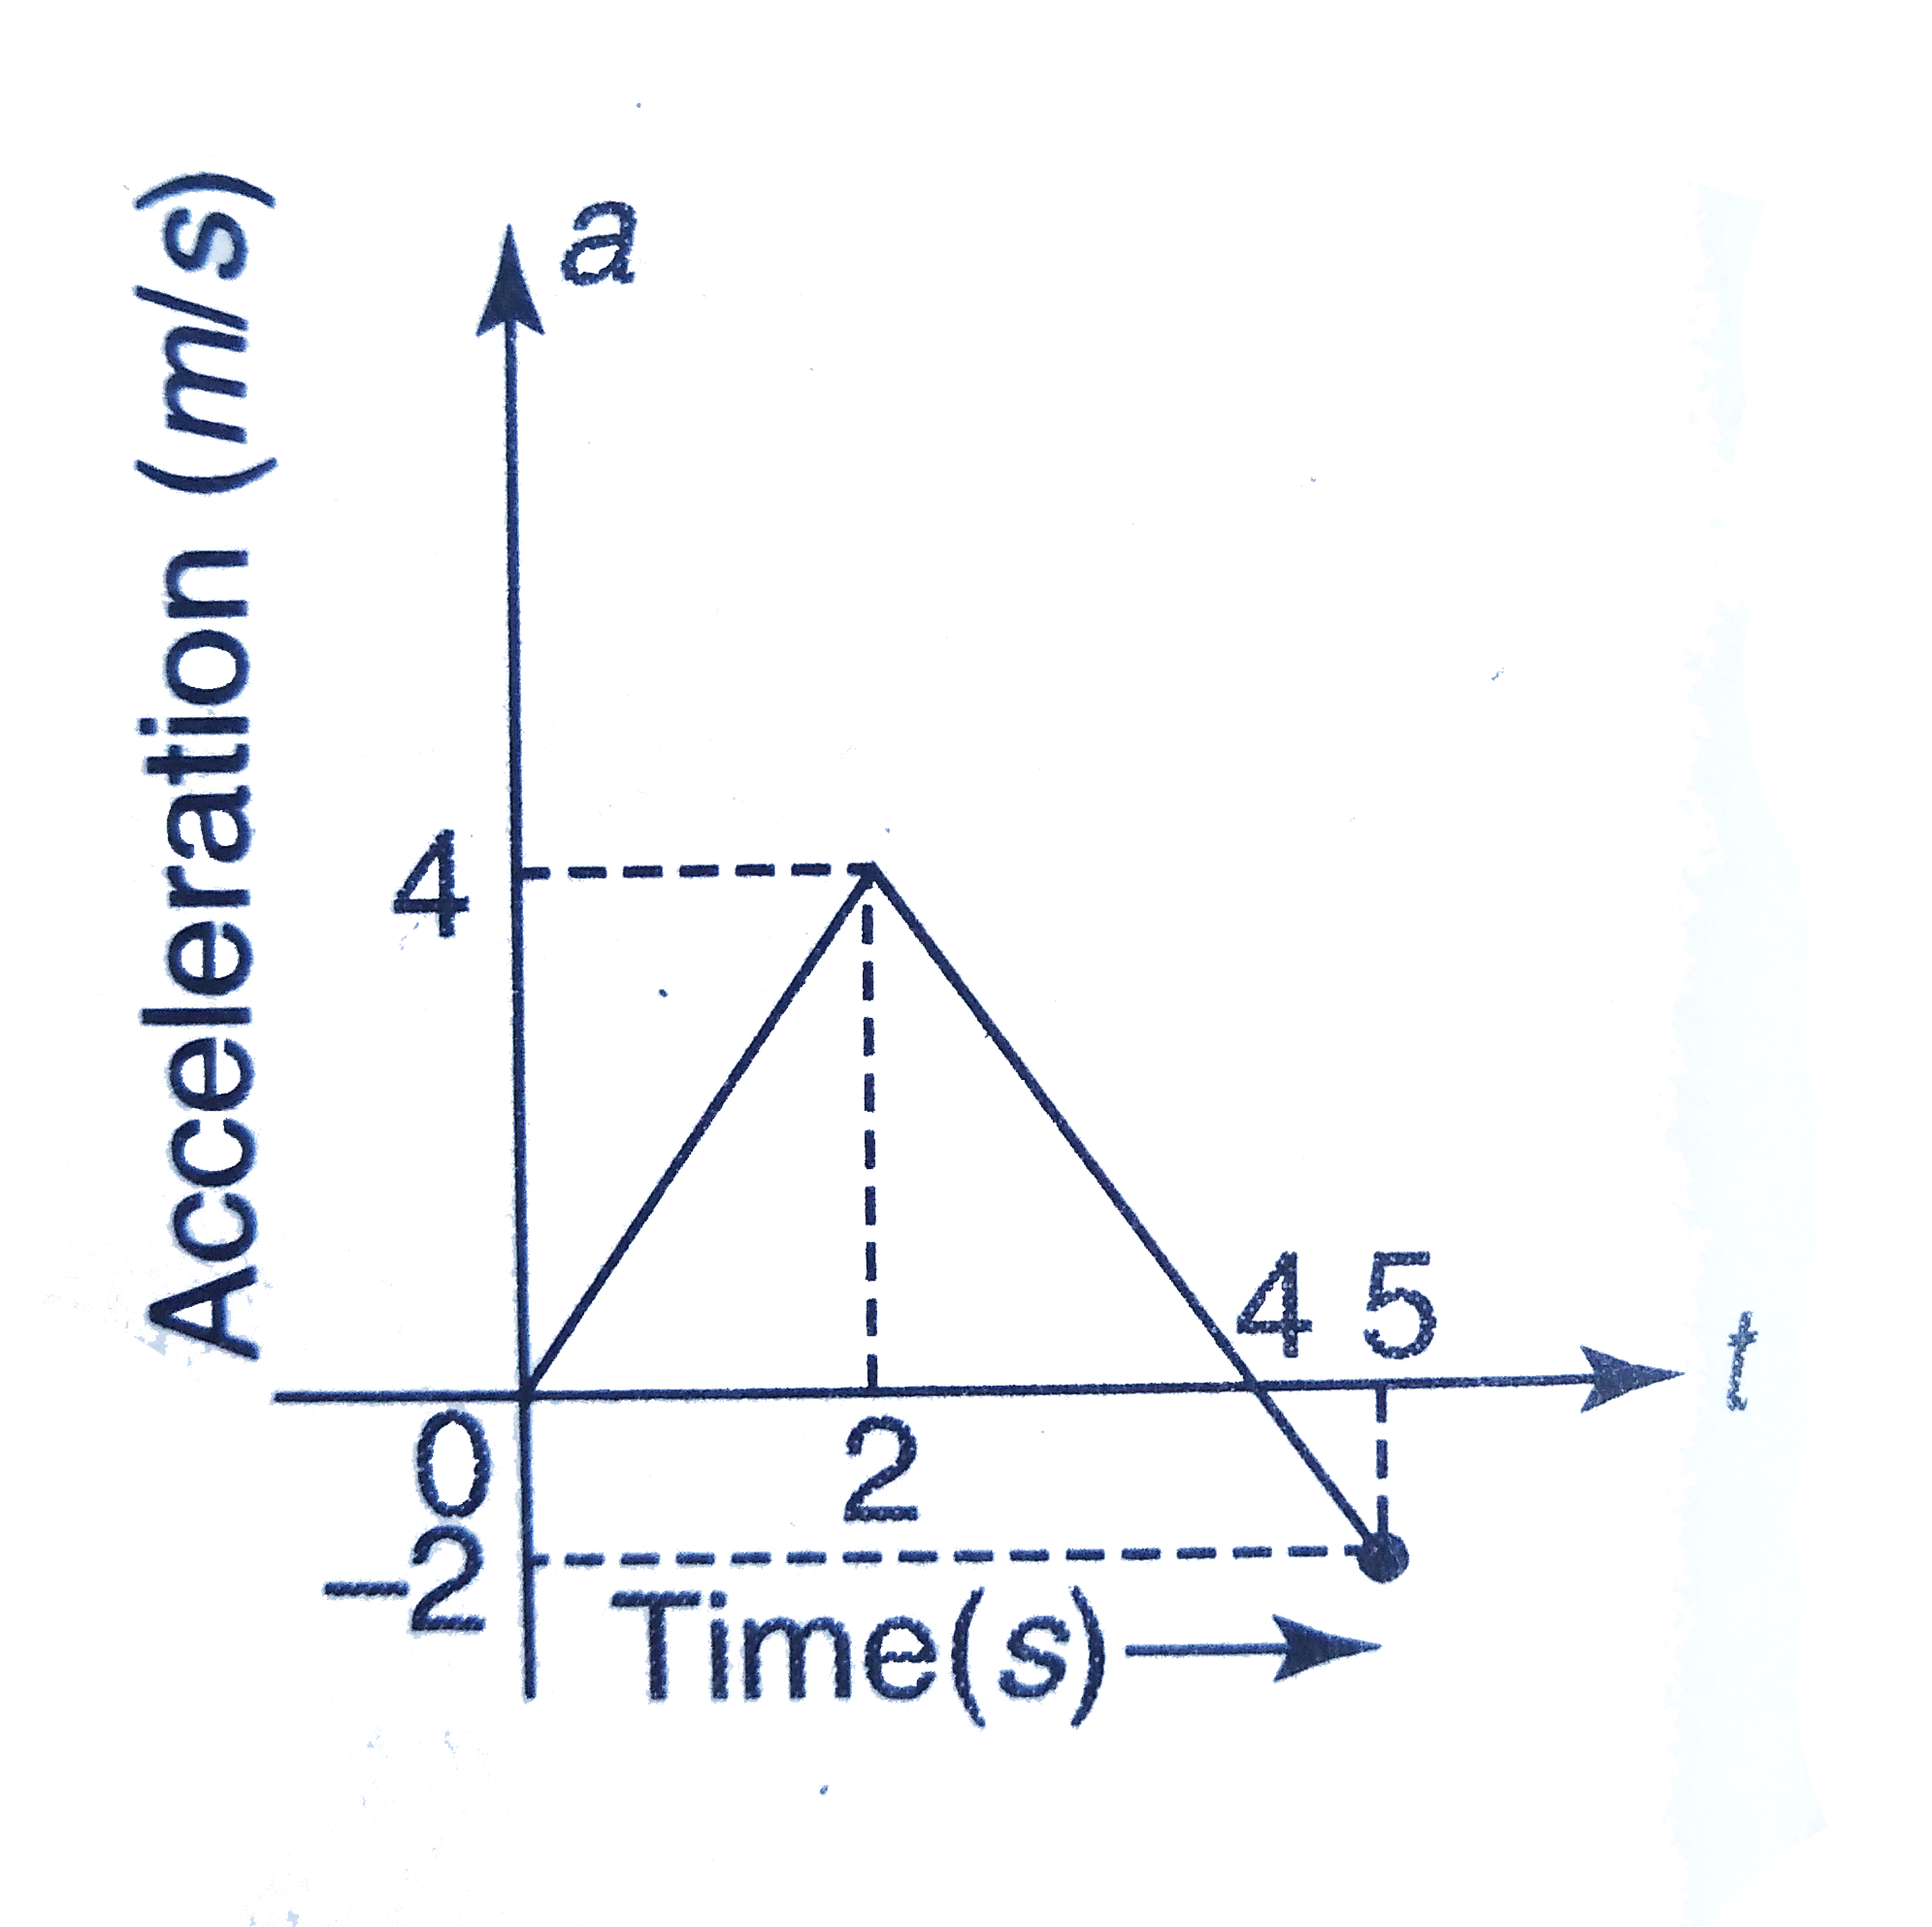
View SolutionFigure shows the graph of acceleration of particle as a function of time. The maximum speed of the particle is (particle starts from rest).
View Solution
