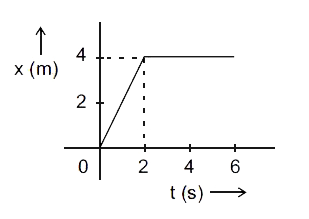
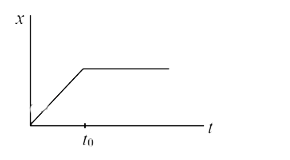
Figure shows the position-time graph of a particle of mass 0.04kg. Suggest a suitable physical context for this motion. What is the time between two consecutive impulses received by the particle? What is the magnitude of each impluse?
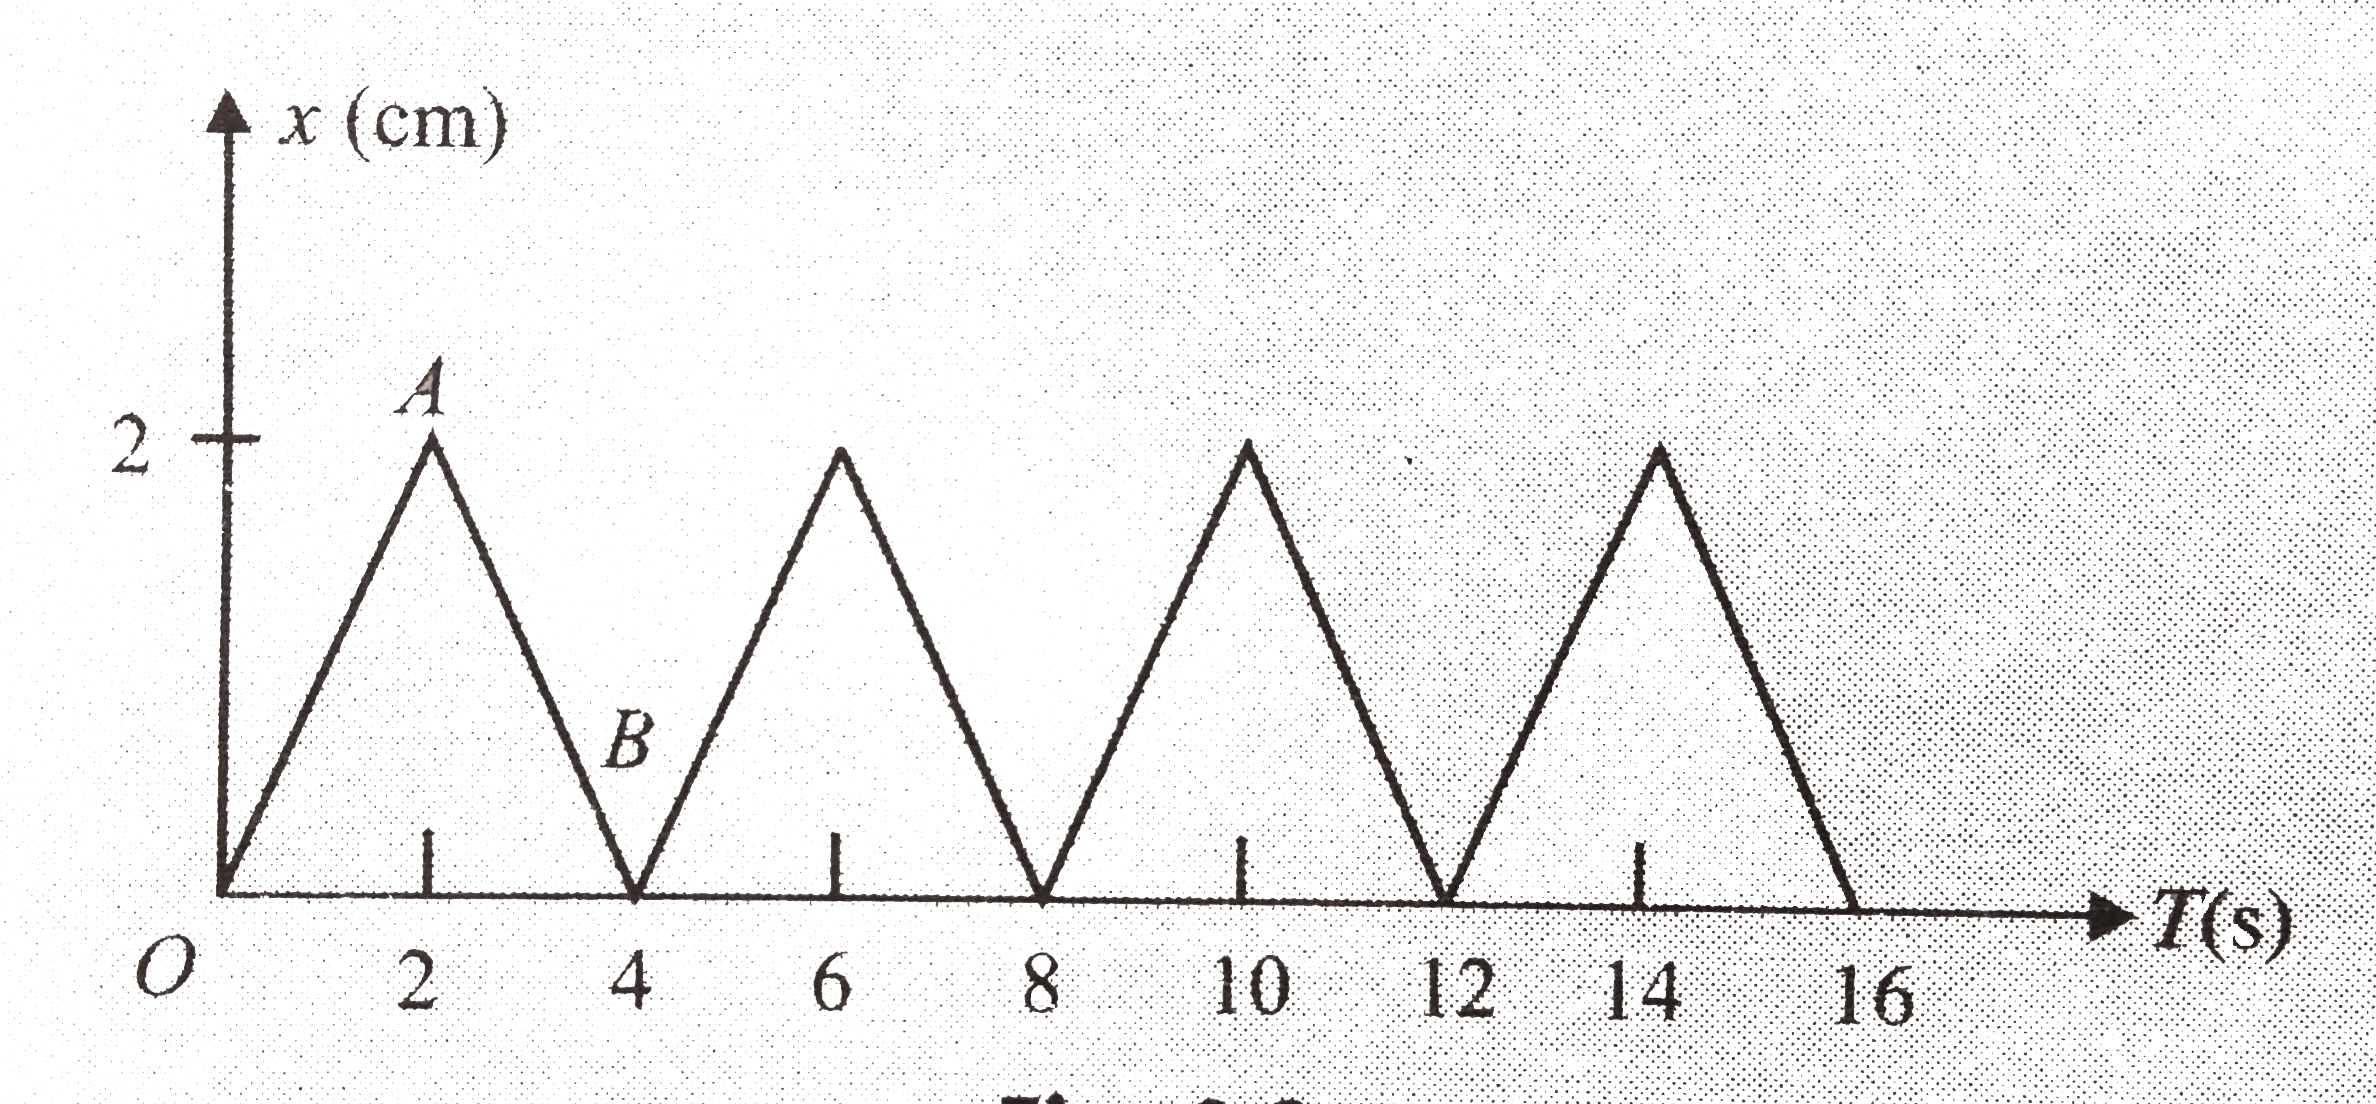
Here, m=0.04kg position time graph shows that the particle moves from x = at O to x = 2 cm at A in 2 sec As x - t graph is a straight line the motion is with a constant velocity
u=(2−0)cm(2−0)s=1cms−1=10−2ms−1
From x = 2 cm at A particle goes to x = 0 at B in 2 sec As AB is a straight line , motion is with constant velocity
v=−1cms−1=−10−2ms−1
Negative sign indicates the reversal of direction of motion This is being repeated We can visulise a ball moving between two walls located at x = 0 and x = 2 cm getting rebounded repeatedly on striking against each wall On every collision with a wall linear momentum of the ball changes Therefore the ball receives impulse after every two seconds Magnitude of impulse = total change in linear momentum
=mu−(mv)=mu−mυ=m(u−v)=0.04(102)=0.08×102=8×10⁻⁴kgms−1 .
Topper's Solved these Questions
- LAWS OF MOTIONBook:PRADEEPChapter:LAWS OF MOTIONExercise:Additional Examples / Exercises
Explore 6 Videos
- LAWS OF MOTIONBook:PRADEEPChapter:LAWS OF MOTIONExercise:Short Answer Questions
Explore 35 Videos
- LAWS OF MOTIONBook:PRADEEPChapter:LAWS OF MOTIONExercise:Advanced problems for competitions
Explore 20 Videos
- KINEMATICSBook:PRADEEPChapter:KINEMATICSExercise:1 NCERT Comprehension
Explore 4 Videos
- MATHEMATICAL TOOLSBook:PRADEEPChapter:MATHEMATICAL TOOLSExercise:Fill in the blanks
Explore 5 Videos
Similar Questions
Shows the position time graph of a particle of mass 0.04 kg Suggest a suitable physical context for this motion What is the time between two conscutive impulse recevived by the particle ? What is the magnitude of each impulse ?
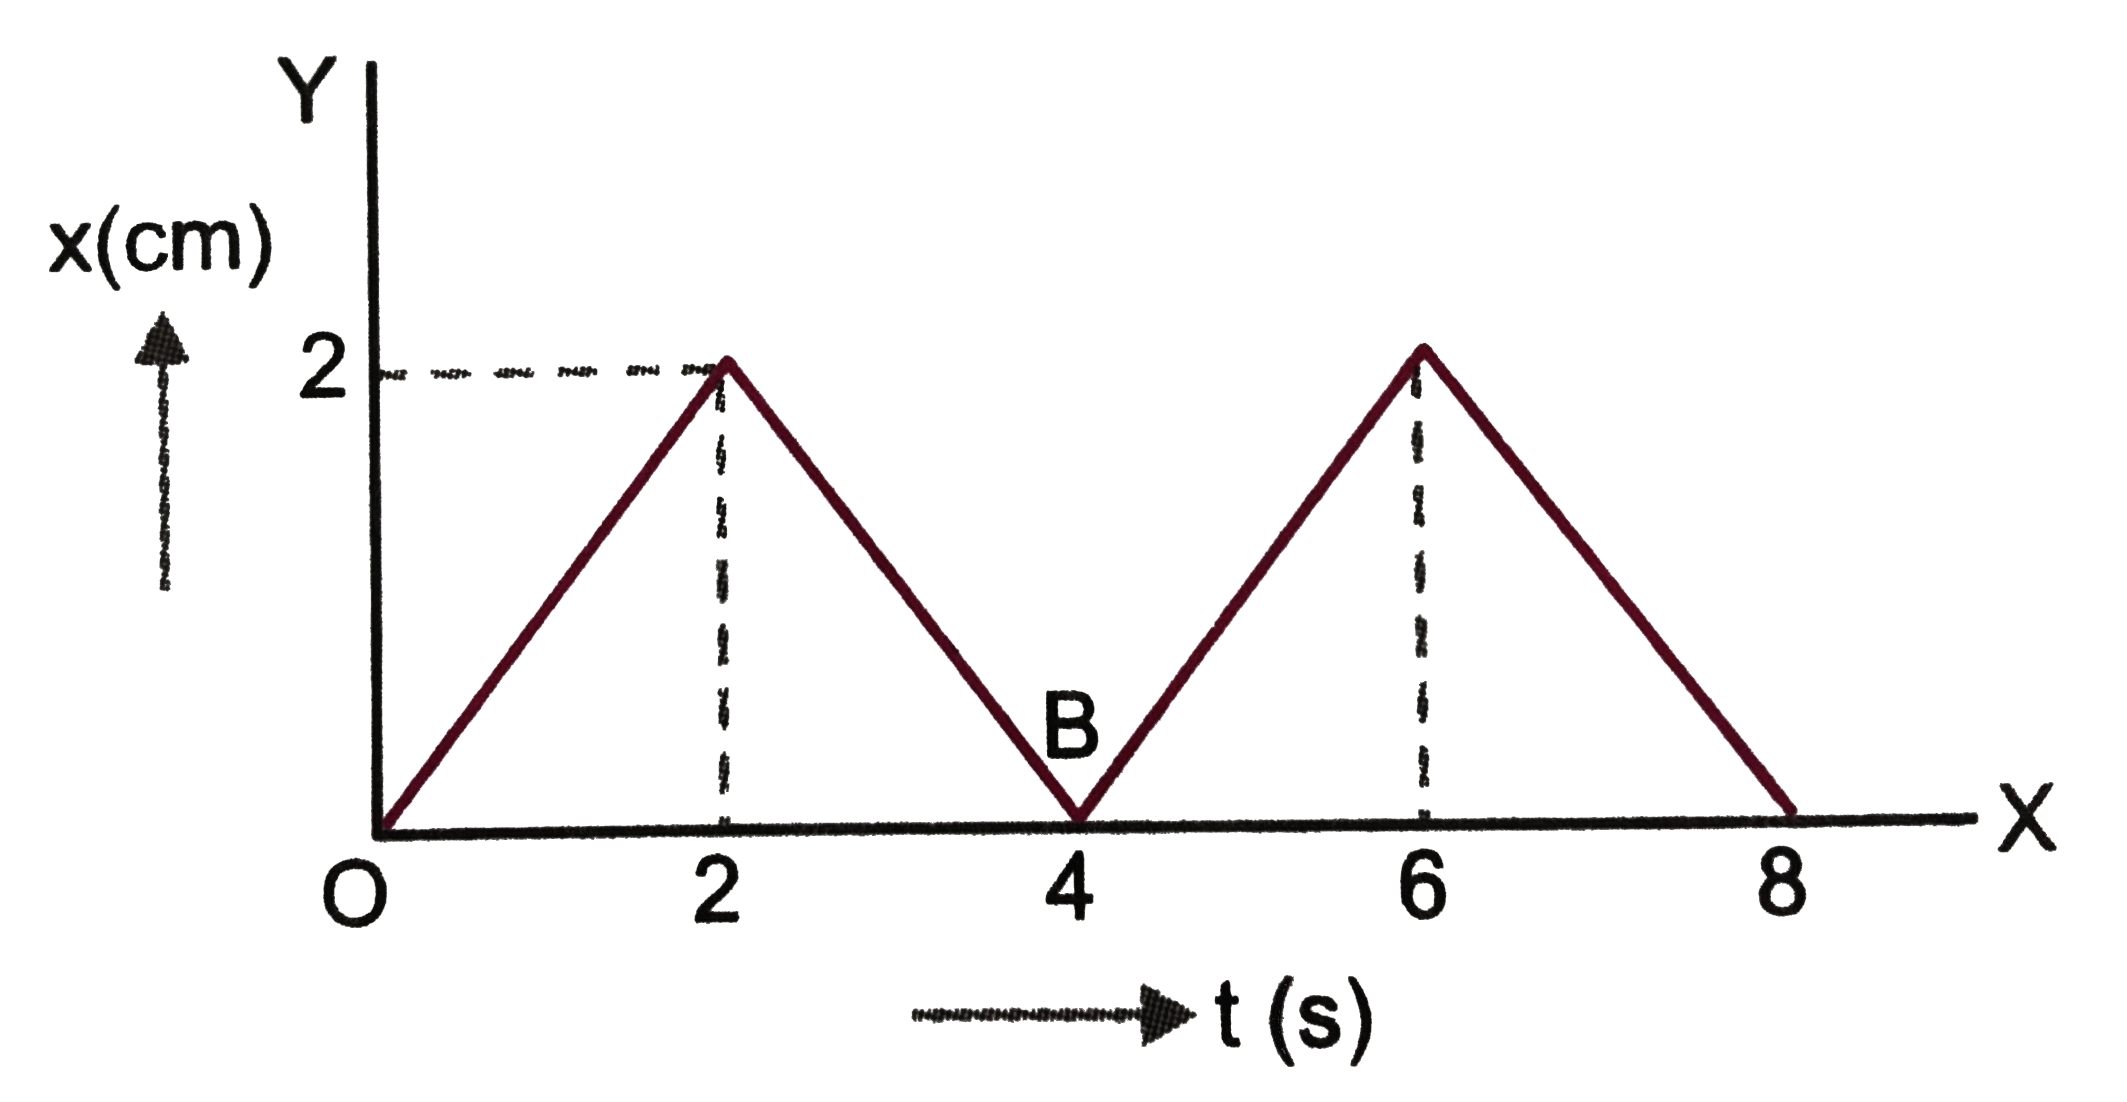
View SolutionThe position-time graph of a particle of mass 0.1 kg is shown. The impulse at t = 2s is :
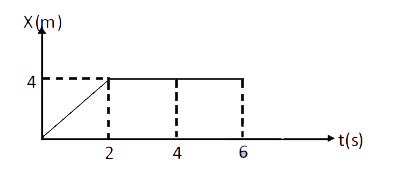
View Solution
Knowledge Check
The position-time graph of a body of mass 0.04kg is shown in the figure. The time between two consecutive impulses received by the body and the magnitude of each impulse is
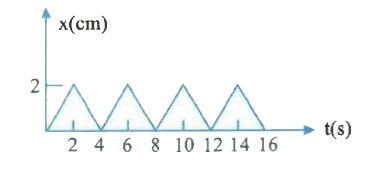 A4sec,4×10−4kgm/sB2sec,8×10−4kgm/sC6sec,4×10−4kgm/sD8sec,8×10−4kgm/s
The position-time graph of a particle of mass 0.1 kg is shown. The impulse at t = 2s is :
 A0.2kgms−1B0.02kgms−1C0.1kgms−1D0.4kgms−1
In the figure given, the position-time graph of a particle of mass 0.1 kg is shown the impulse at t = 2s is
 A0.2 kg m/sB−0.2 kg m/sC0.1 kg m/sD−0.4 kg m/s
In the figure, the position time graph of a particle of mass 0.1 kg is shown. The impulse at t=2 second is :
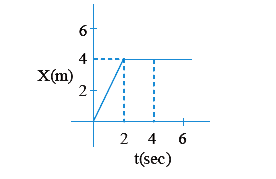
View SolutionIn the figure given below, the position-time graph of a particle of mass 0.1kg is shown. The impuslse at t=2 sec is
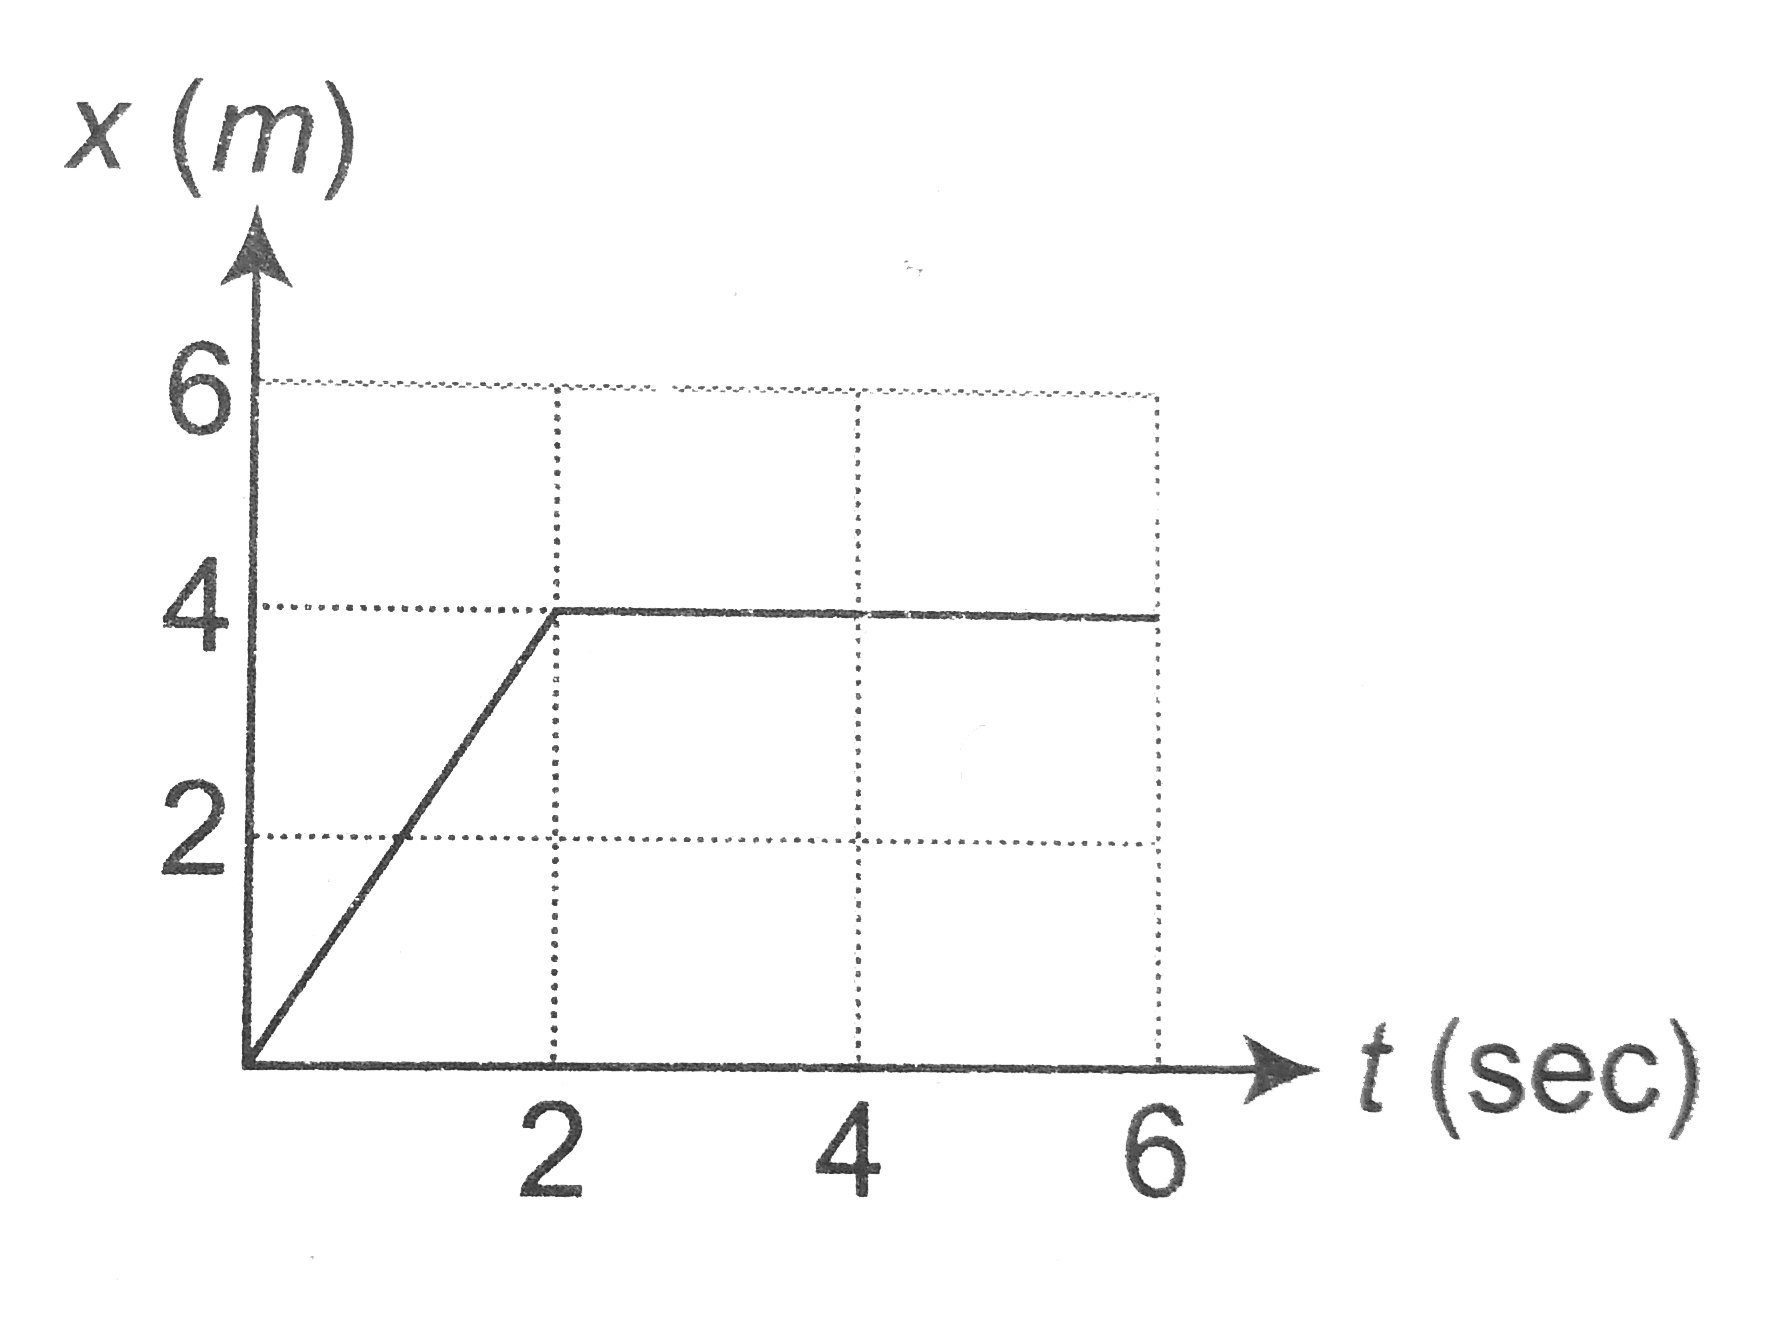
View SolutionIn the figure given below, the position time graph of a particle of mass 0.1kg is shown. The impulse at t=2 sec is
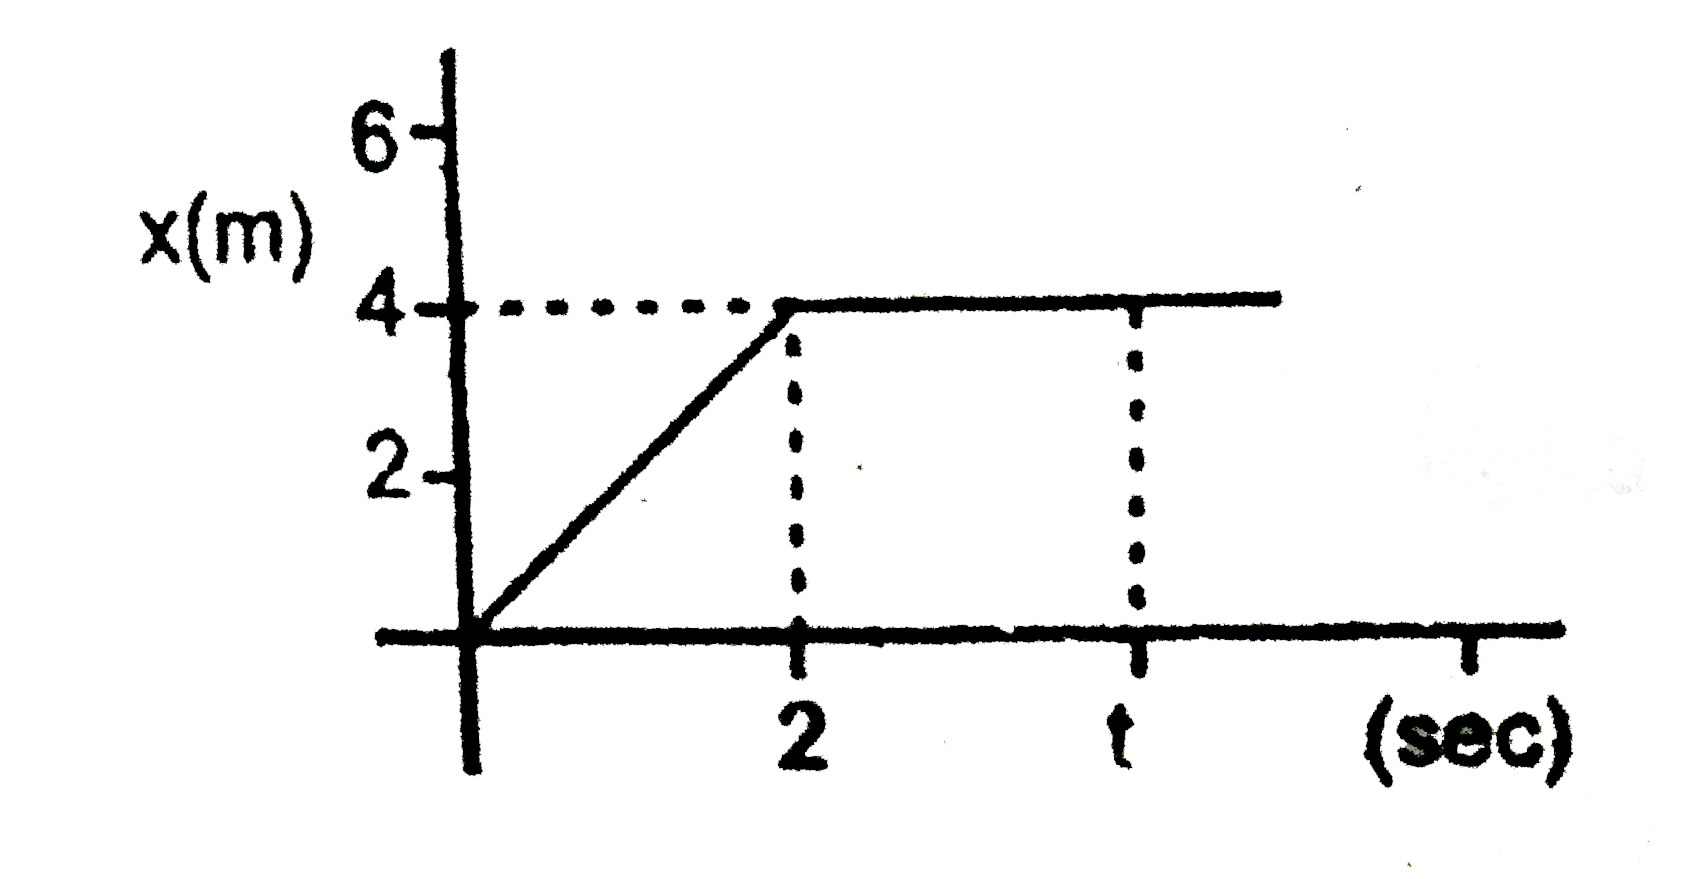
View SolutionFigure shows the position-time graph of a particle moving on the X--axis. Which of these option correctly describes the particle 's motion?
View SolutionFigure shows the position time graph of a particle of mass 5kg. The force acting on the particle for 0<t<4s and 8s<t<12s respectively are,

View Solution