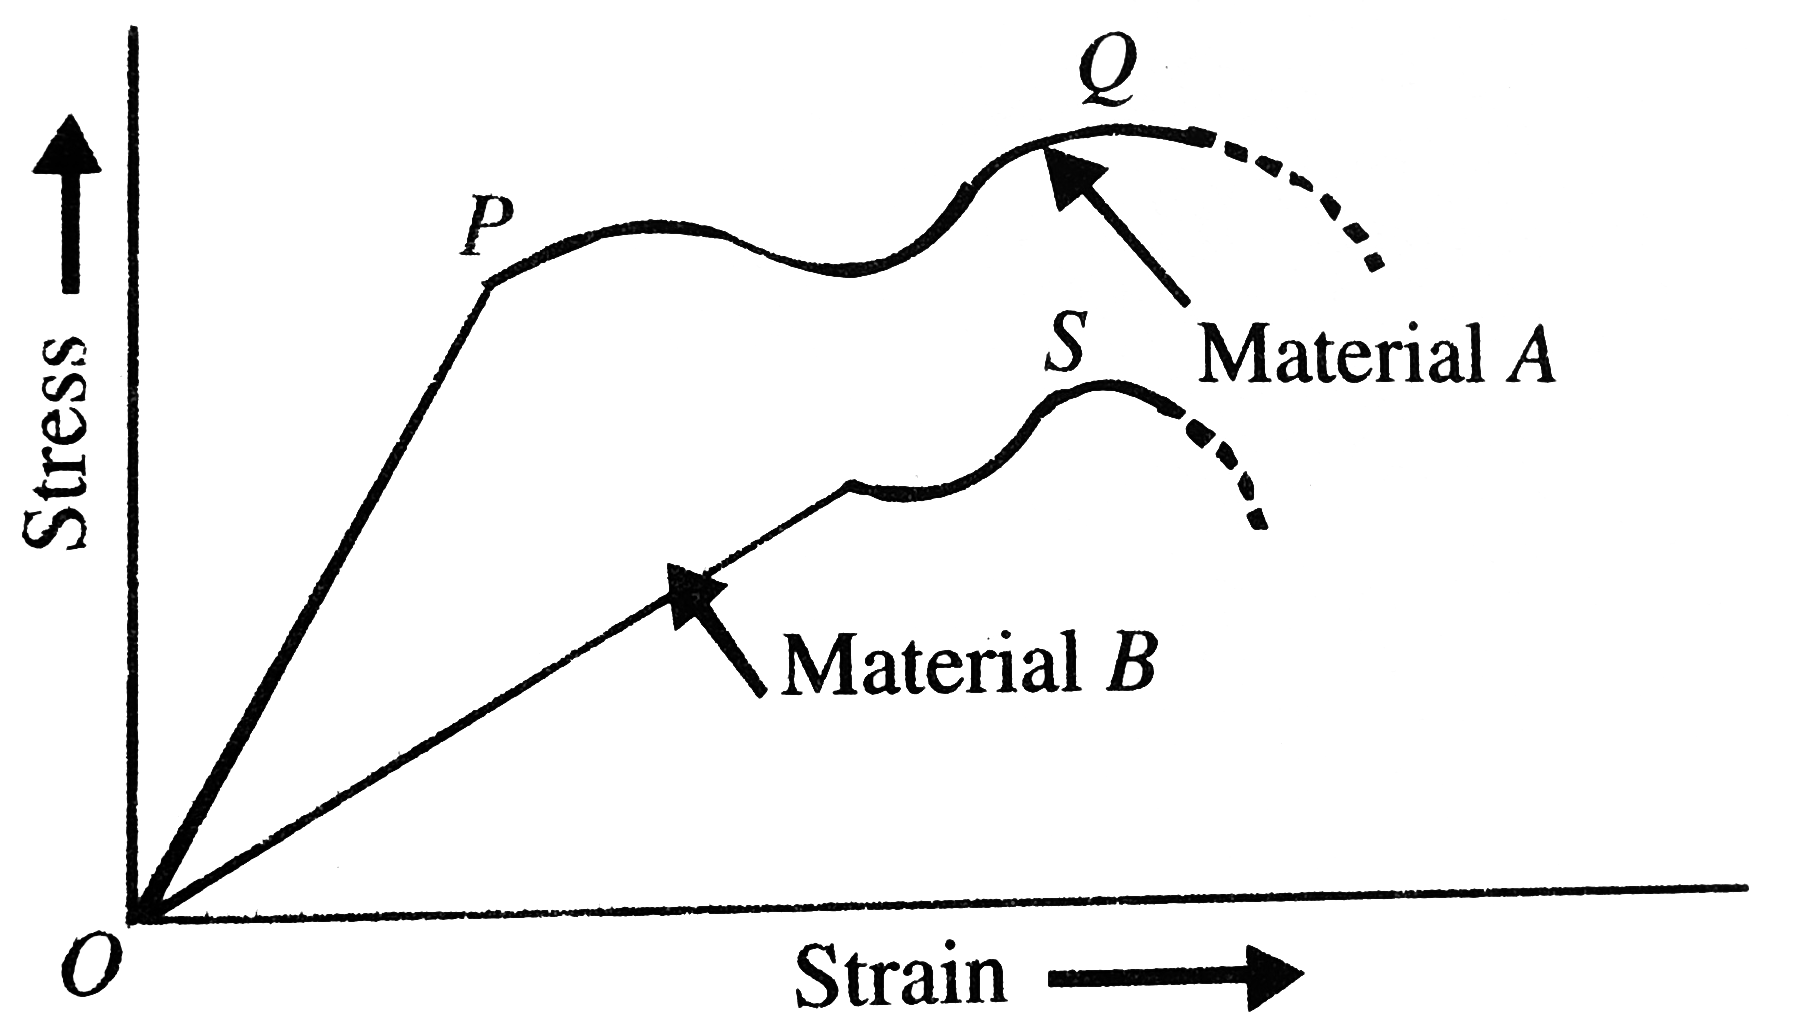
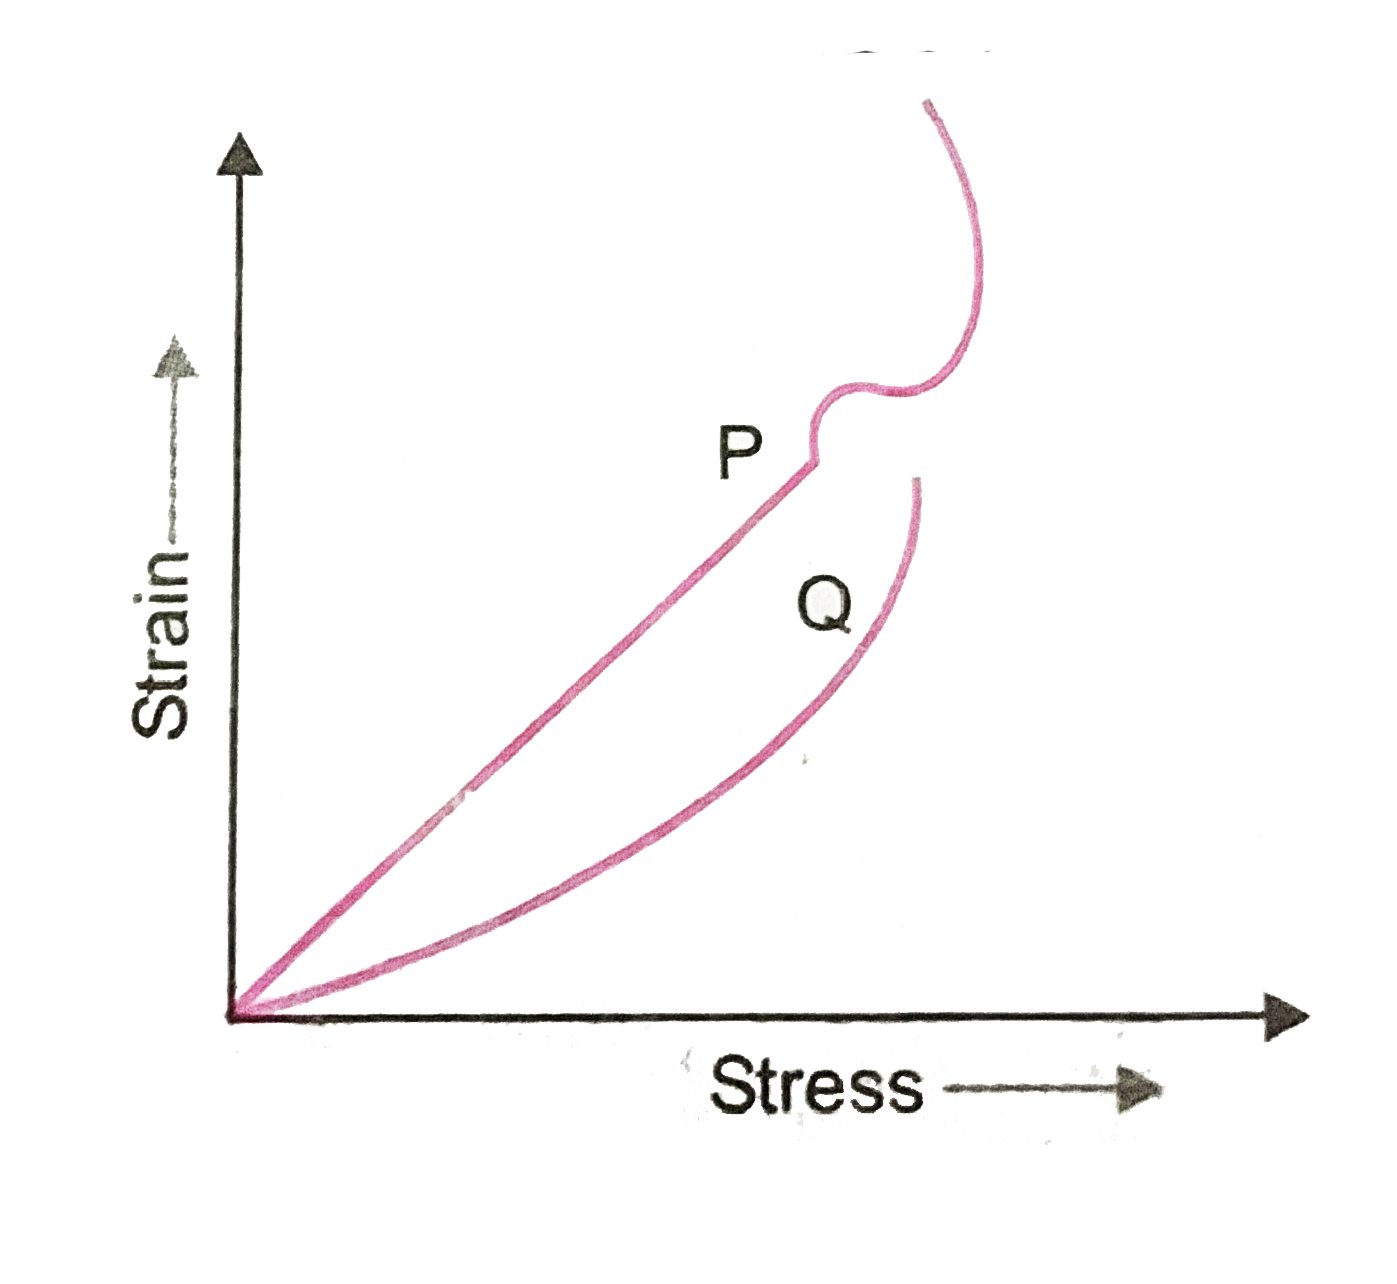
Figure shows the stress-strain curve of two metals P and Q . From the graph, it can be concluded that
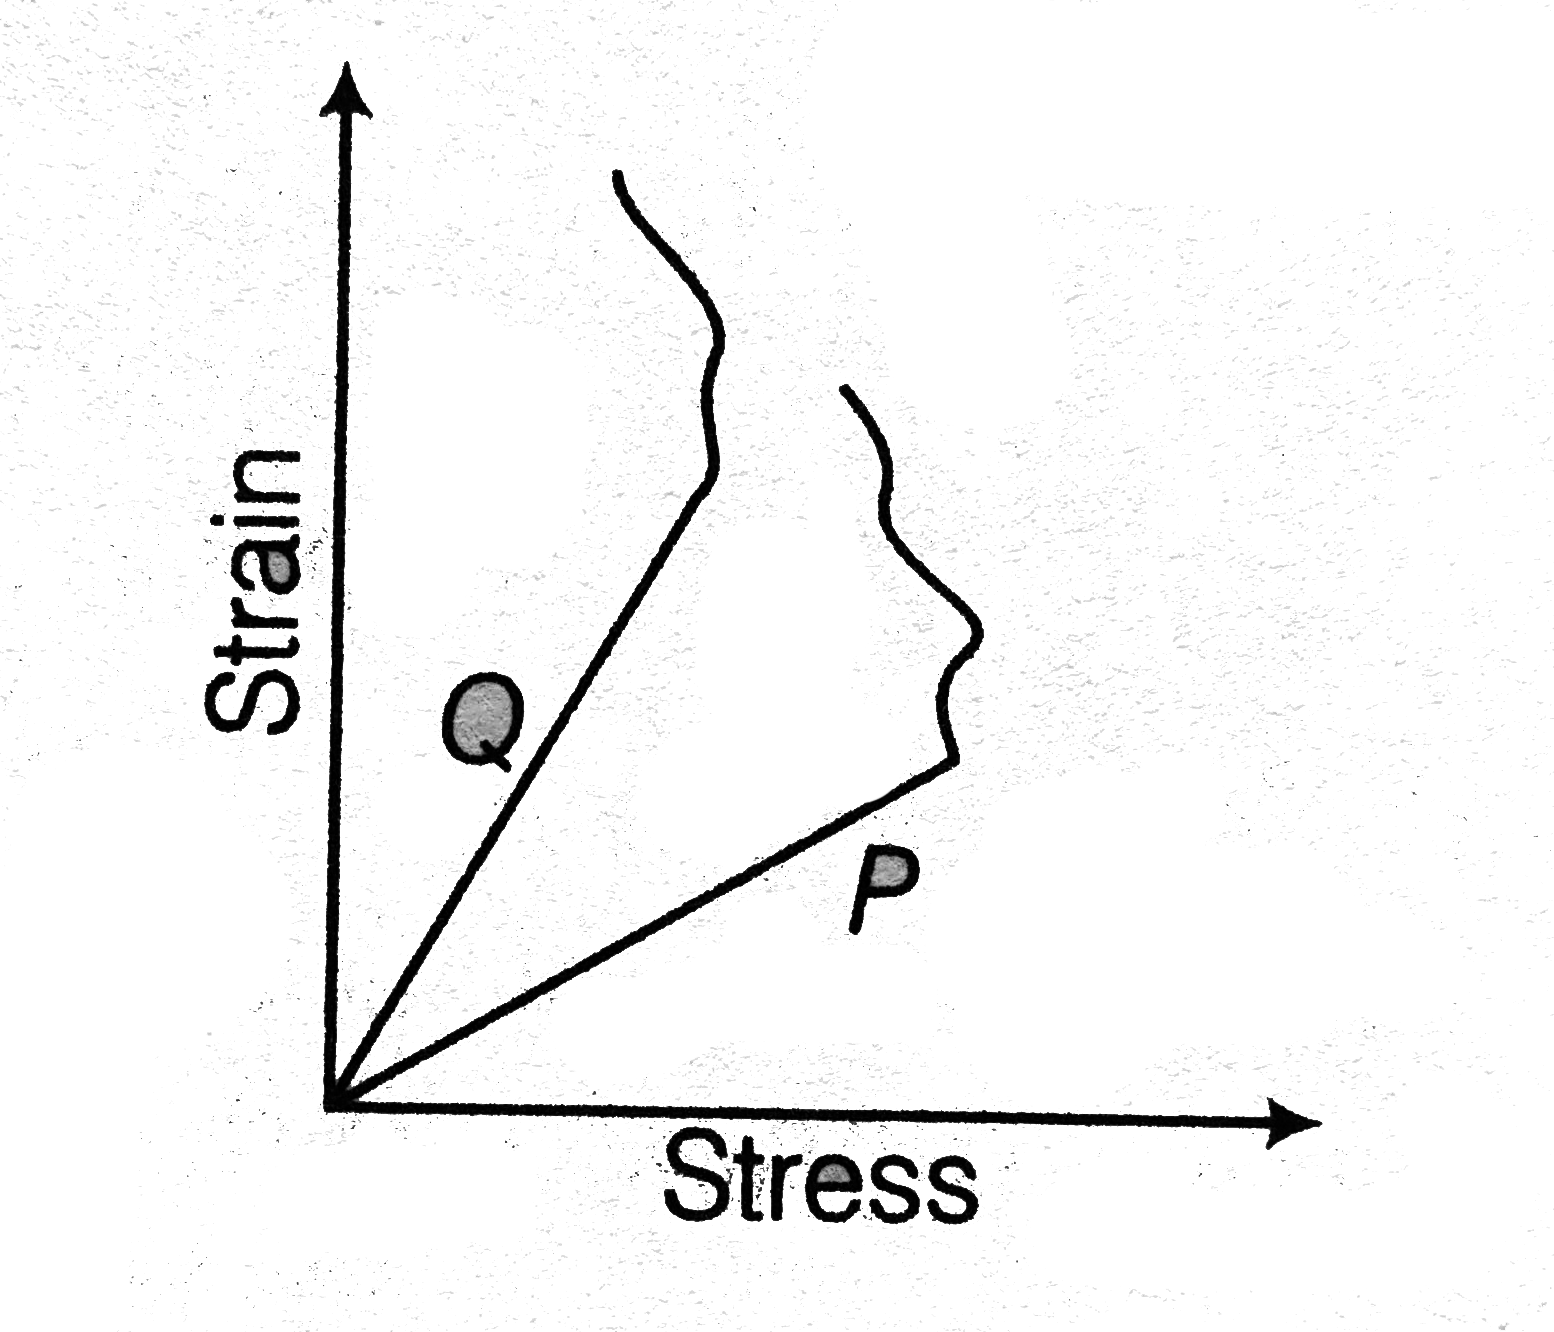
(A) P has greater young's modulus and lesser ductility
(B) Q has greater young's modulus and lesser ductility
(C) P has greater young's modulus and greater ductility
(D) Q has greater young's modulus and greater ductility
The correct Answer is:A
In the figure , the reciprocal of slope of stress - strain (x and y- axes ) curve , upto proportionality limit, gives young's modulus. The measure of ductility is obtained as the length of the stress-strain curve between yield point and ultimate load.
Topper's Solved these Questions
- ELASTICITYBook:DC PANDEY ENGLISHChapter:ELASTICITYExercise:Level 1 Subjective
Explore 8 Videos
- ELASTICITYBook:DC PANDEY ENGLISHChapter:ELASTICITYExercise:Level 2 Single Correct
Explore 10 Videos
- ELASTICITYBook:DC PANDEY ENGLISHChapter:ELASTICITYExercise:Assertion And Reason
Explore 22 Videos
- CURRENT ELECTRICITYBook:DC PANDEY ENGLISHChapter:CURRENT ELECTRICITYExercise:All Questions
Explore 469 Videos
- ELECTROSTATICSBook:DC PANDEY ENGLISHChapter:ELECTROSTATICSExercise:Integer
Explore 17 Videos
Similar Questions
Knowledge Check
From the passage, we can conclude that:
ANew ventures are not risky.BNew ventures are inherently risky.CFinancial investment in a new venture is always non-profitable.DConservative projection of companies' profits is suggested
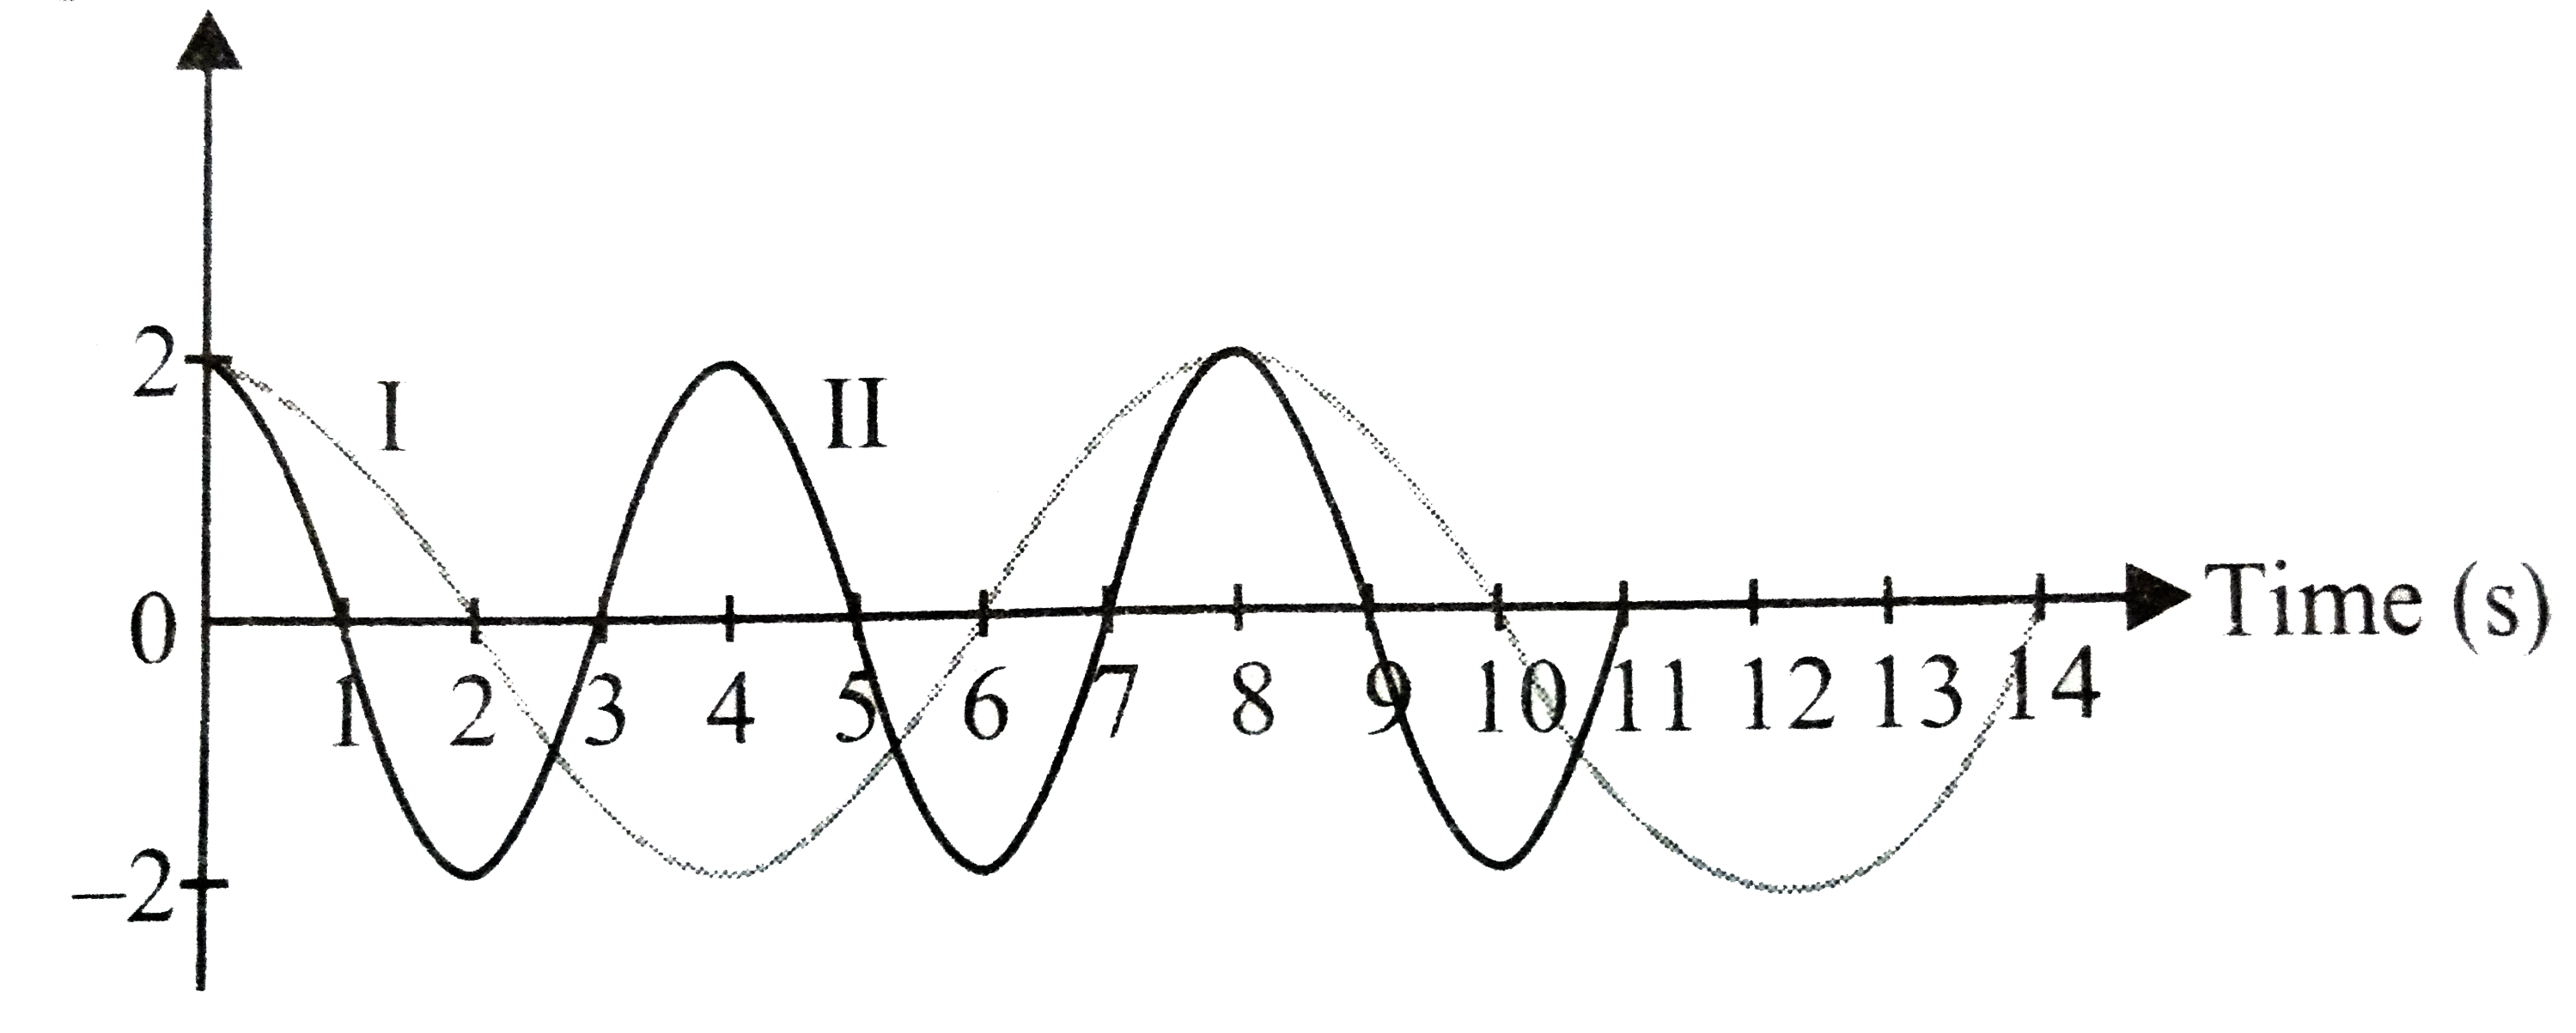
Figure shows the displacement-time graphs of two simple harmonic motions I and II. From the graph it follows that
View SolutionTwo different types of rubbers are found to have the stress -strain curve of a metal wire .
(a) In which significant way do these curves differ from the stress-strain curve of a metal wire shown in Figure.
(b) A heavy machine is to be installed in a factory. To absorb vibrations of the machine, a block of you preferr to use for his purrpose ? Why?
(c ) Which of the two rubber materials A,B would you choose for a car tyre ?
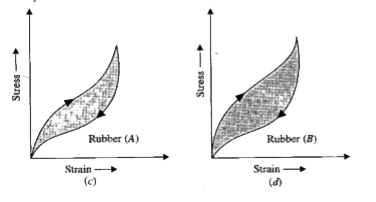
View SolutionTwo different types of rubber are found to have the stress-strain curves shown in fig.
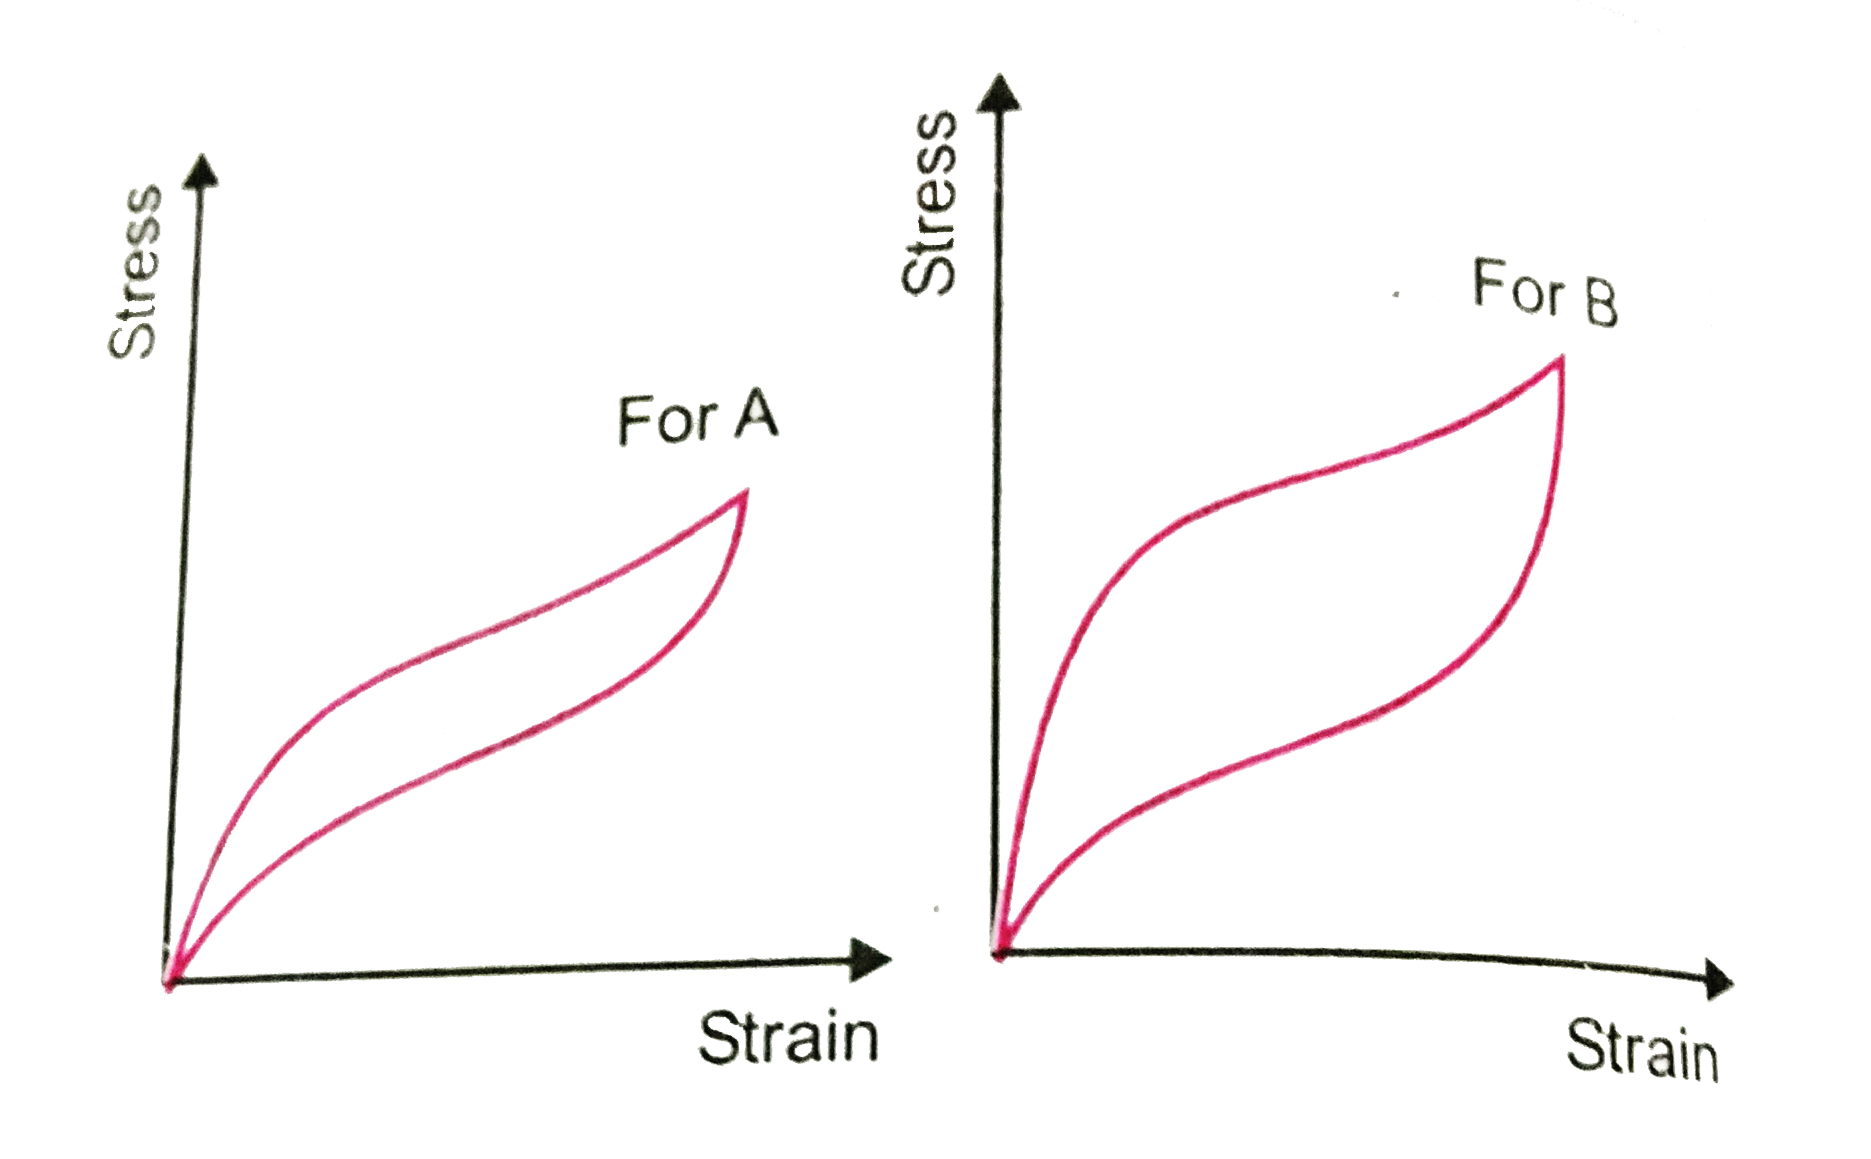
(a) In which significant ways do these curves differ form the stress-strain curve of a metal wire.
(b) A heavy machine is to be installed in a factory. To absorb vibrations of the machine, a block of rubber is placed between the machinery and the floor. which of the two rubbers A and B would you perfer to use for this purpose? why?
(c) Which of the two rubber materials would you choose for a car tyre ?
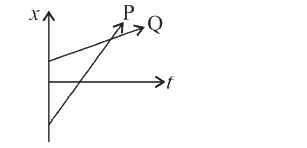
View SolutionFigure shows the displacement -time curve of the particles P and Q. Which of the following statement is correct ?
View SolutionIn plotting stress versus strain curves for two material P and Q, a student by mistake puts strain on the y-axis stress on ther x-axis as shown in the figure. Then the correct statement is/are
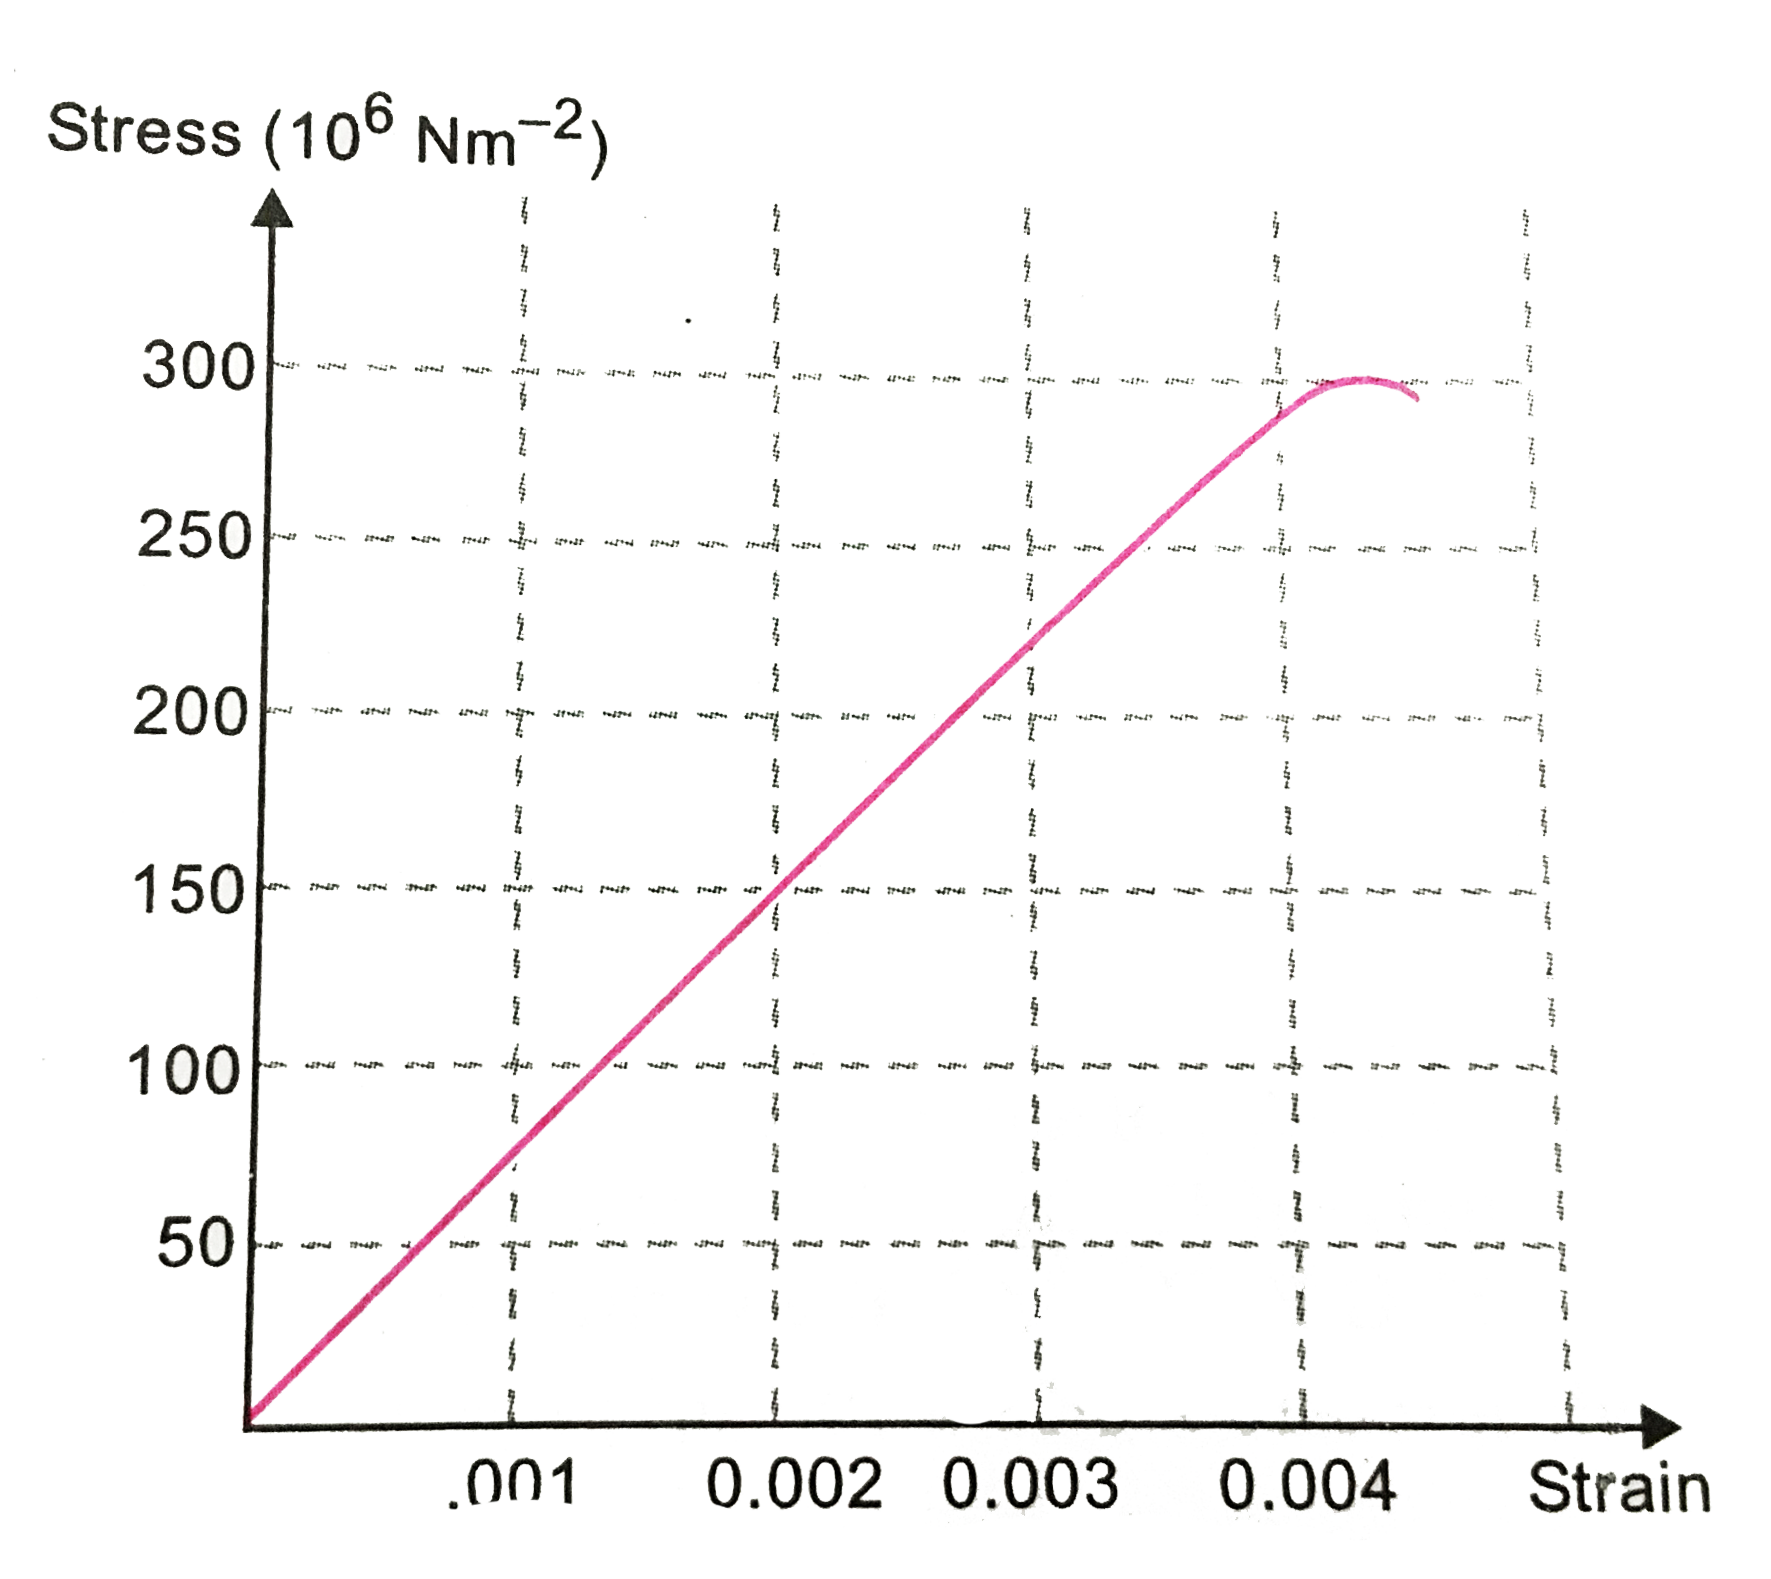
View SolutionFig., shows the stress-strain curve for a given materal. What are (a) Young's modulus and (b) approximate yield strength for this material?
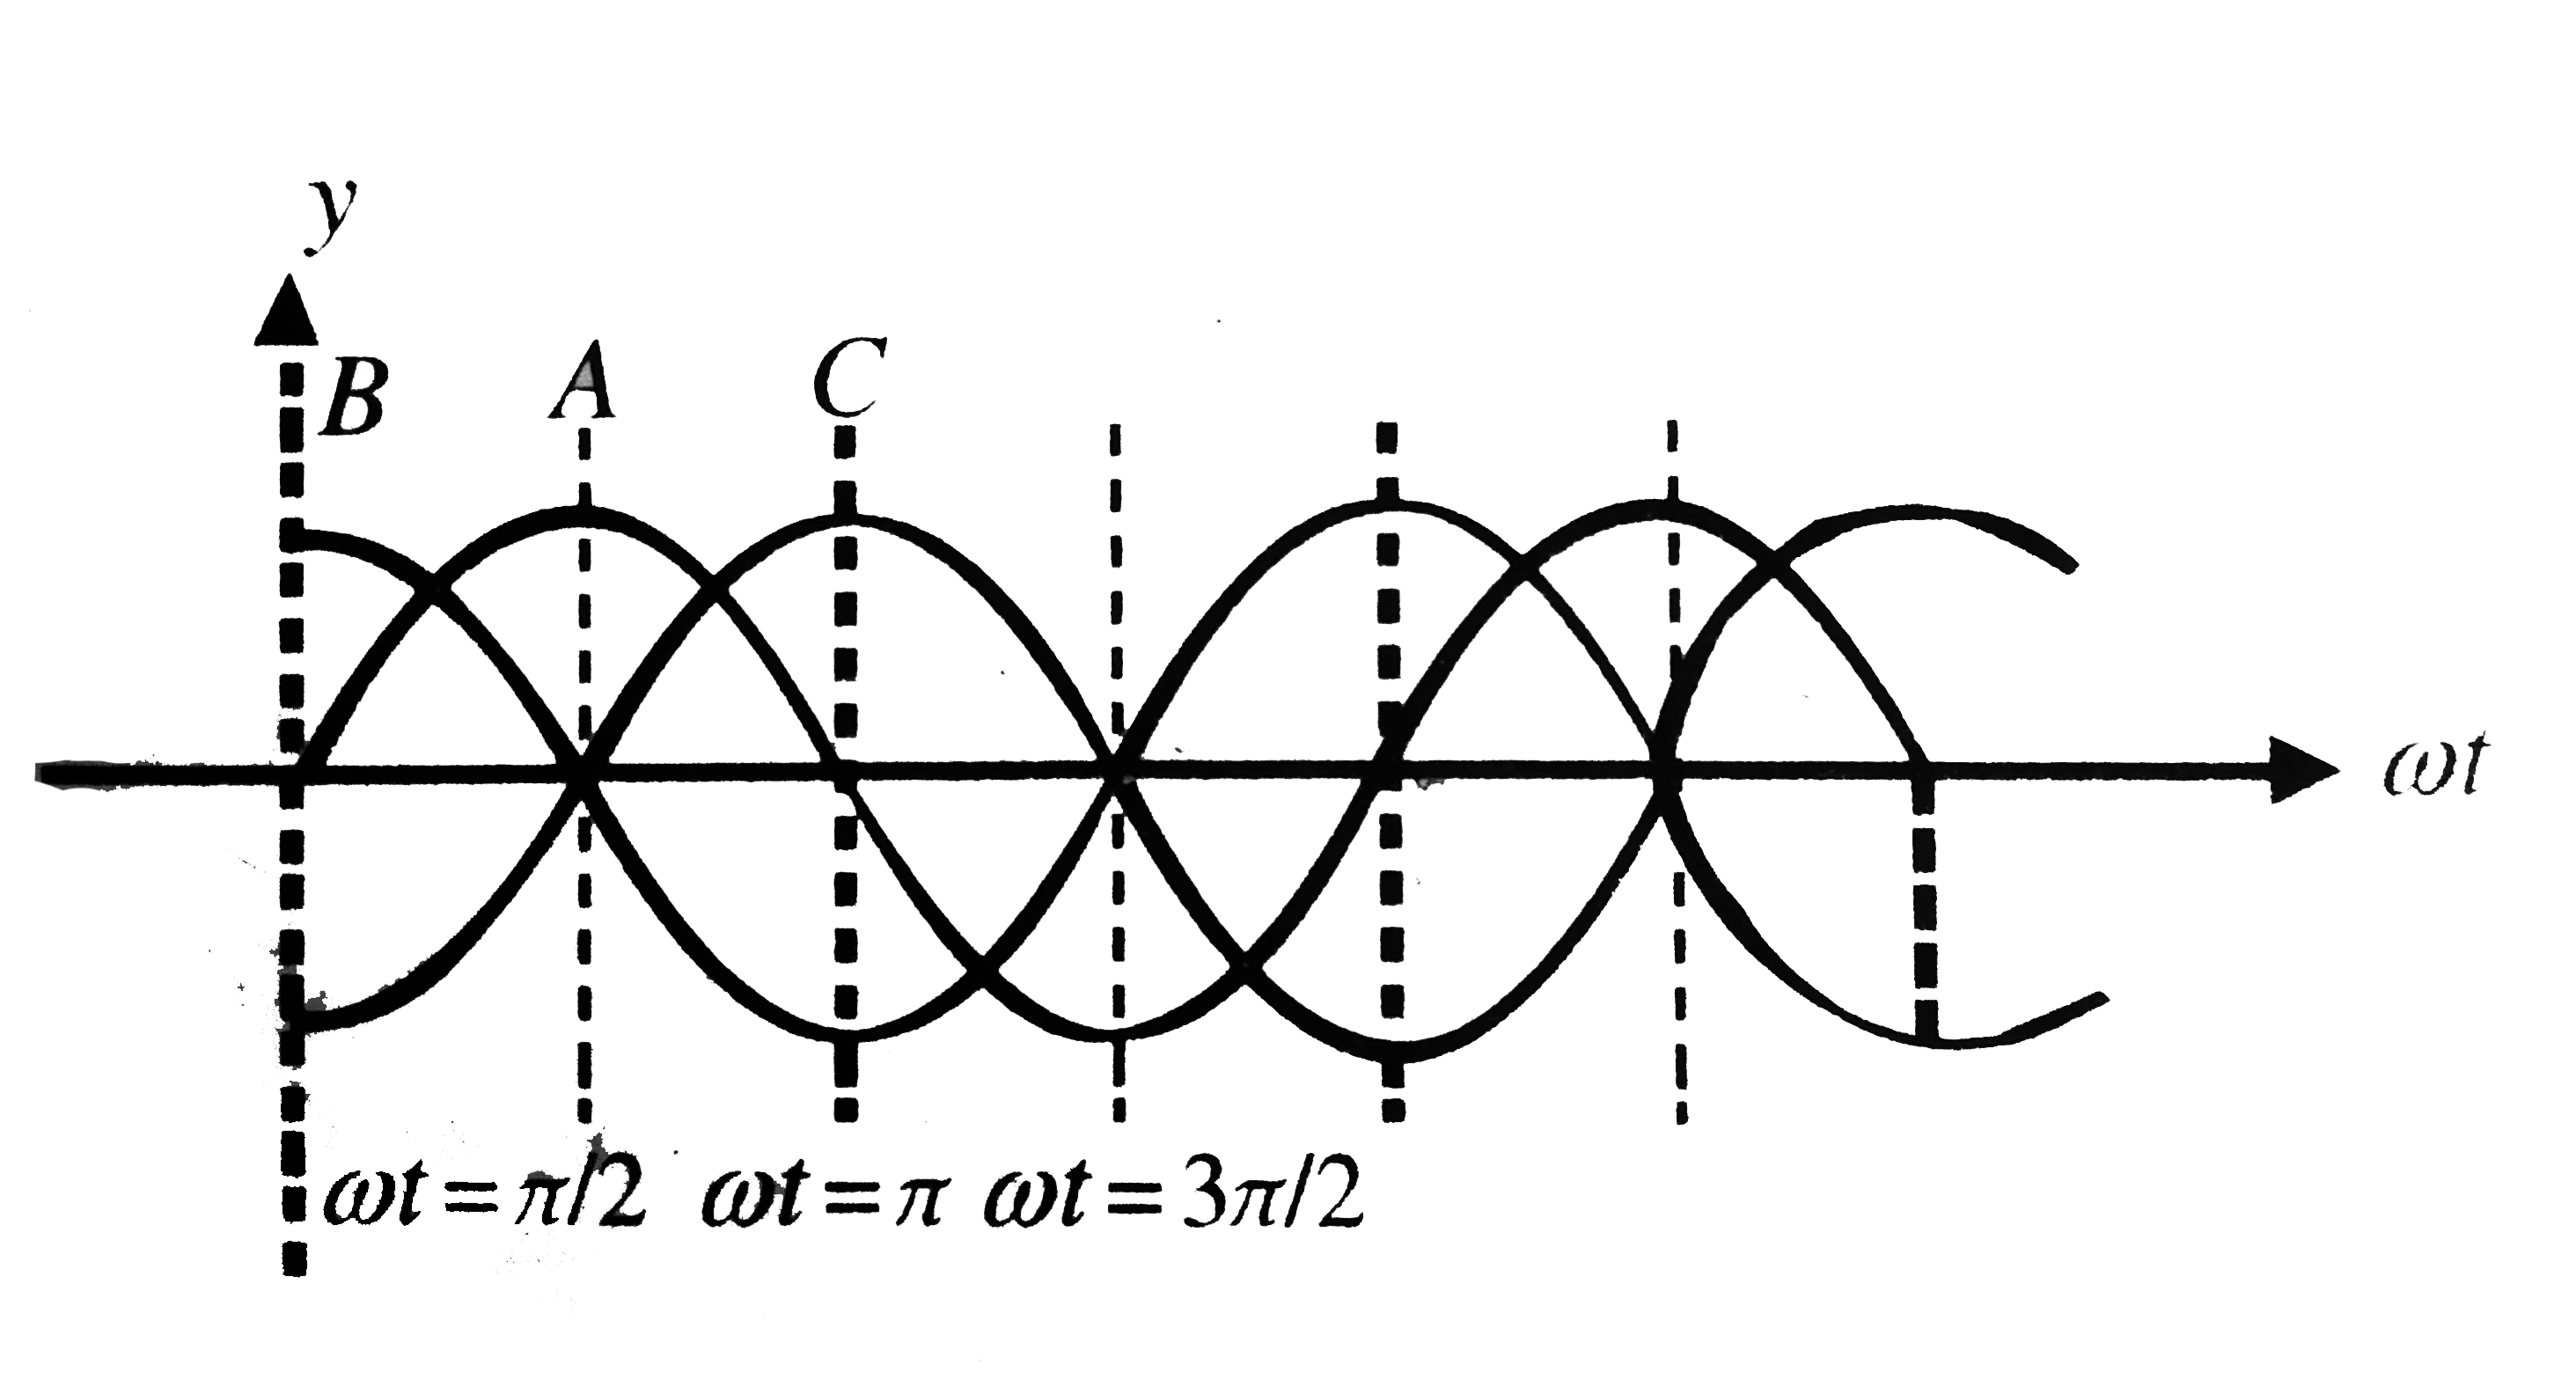
View SolutionThe figure shows three progressive waves A, B and c. wahat canbe concluded from the figure that with respect to wave A?
View Solution
