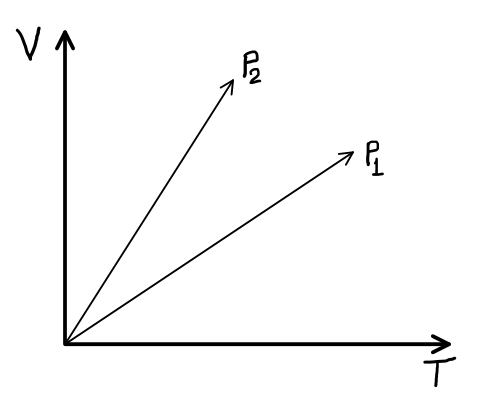
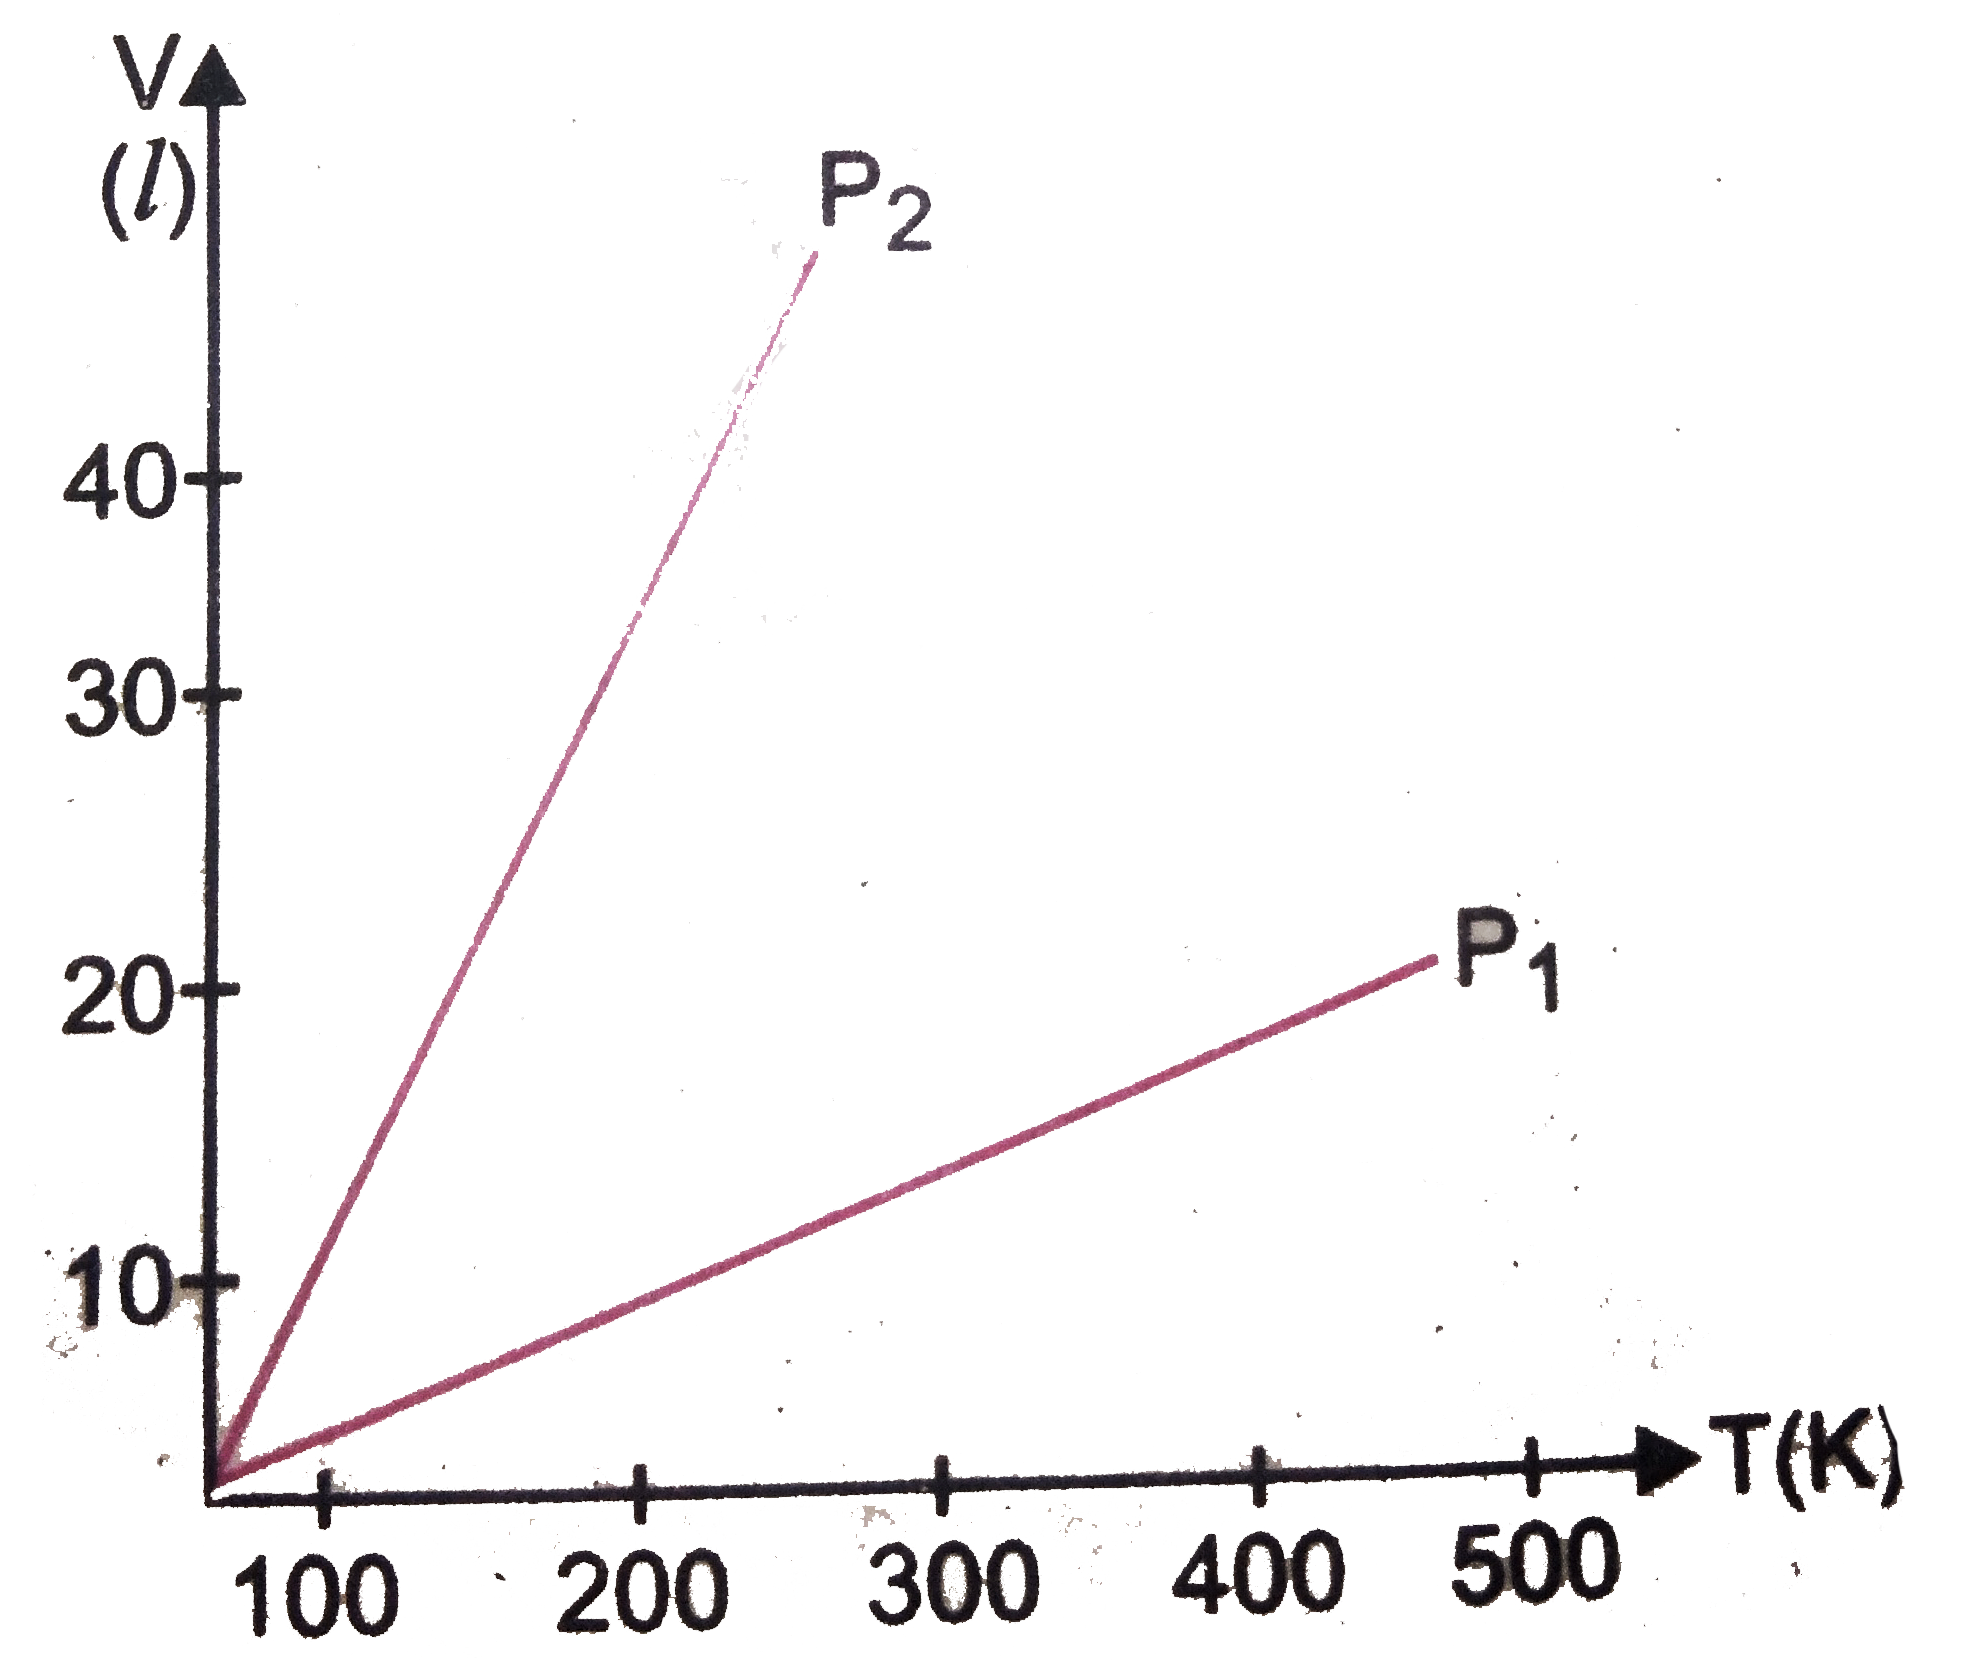
Figure shows the volume versus temperature graph for the same mass of a gas (assumed ideal) corresponding to two different pressure P1andP2. Then
A
P1>P2
B
P1<P2
C
P1=P2
D
The information is insufficient
Video Solution
Text Solution
The correct Answer is:A
Since the graph is a straight line.
so, V=mT where m is the slope,
=(nRT)/P [from equation of state]
or m∝(1/P) or, m2>m1∴P2<P1.
|
Topper's Solved these Questions
- KINETIC THEORY OF GASES AND THERMODYNAMICSBOOK - A2ZCHAPTER - KINETIC THEORY OF GASES AND THERMODYNAMICSEXERCISE - First Law Of Thermodynamics , Internal Energy And Work Done
55 Videos
- KINETIC THEORY OF GASES AND THERMODYNAMICSBOOK - A2ZCHAPTER - KINETIC THEORY OF GASES AND THERMODYNAMICSEXERCISE - Application Of First Law Of Thermodynamics In Different Situations
25 Videos
- KINETIC THEORY OF GASES AND THERMODYNAMICSBOOK - A2ZCHAPTER - KINETIC THEORY OF GASES AND THERMODYNAMICSEXERCISE - Chapter Test
29 Videos
- GRAVITATIONBOOK - A2ZCHAPTER - GRAVITATIONEXERCISE - Chapter Test
29 Videos
- MOCK TESTBOOK - A2ZCHAPTER - MOCK TESTEXERCISE - Motion With Constant Acceleration
15 Videos
Similar Questions
Knowledge Check
Volume versus temperature graphs for a given mass of an ideal gas are shown in figure. At two different values of constant pressure. What can be inferred about relation between P1 and P2 ?
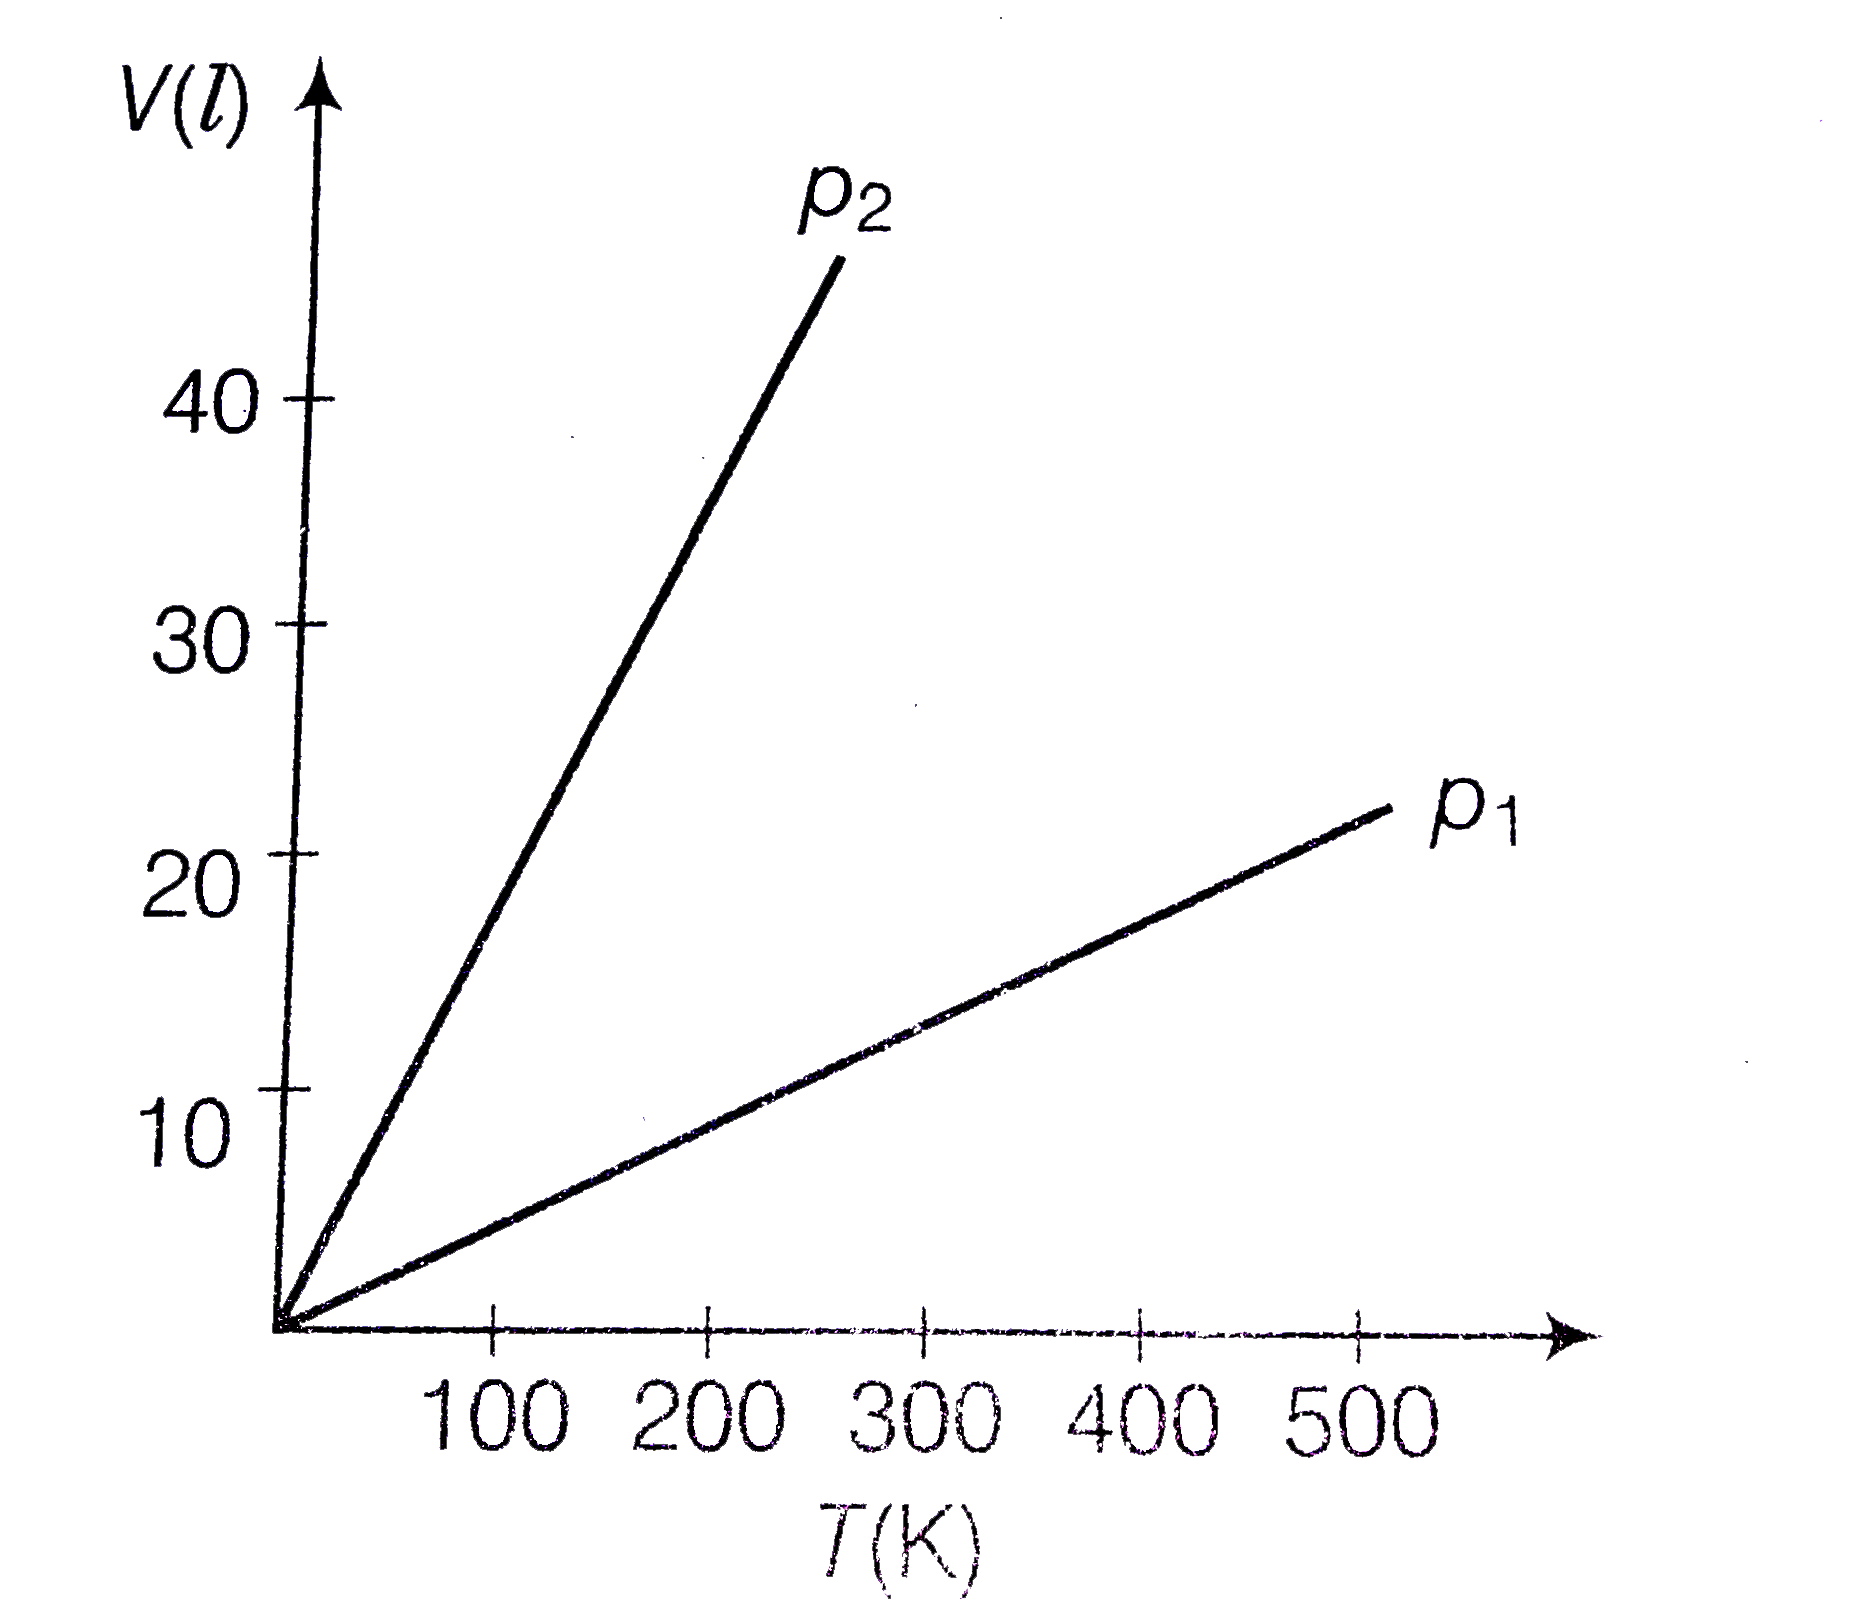 AP1>P2BP1=P2CP1<P2DData is insufficient
Volume versus temperature graphs for a given mass of an ideal gas are shown in Fig. at two different values of constant pressure. What can be inferred about relation between P1andP2?
 AP1>P2BP1=P2CP1<P2Ddata is insufficient.
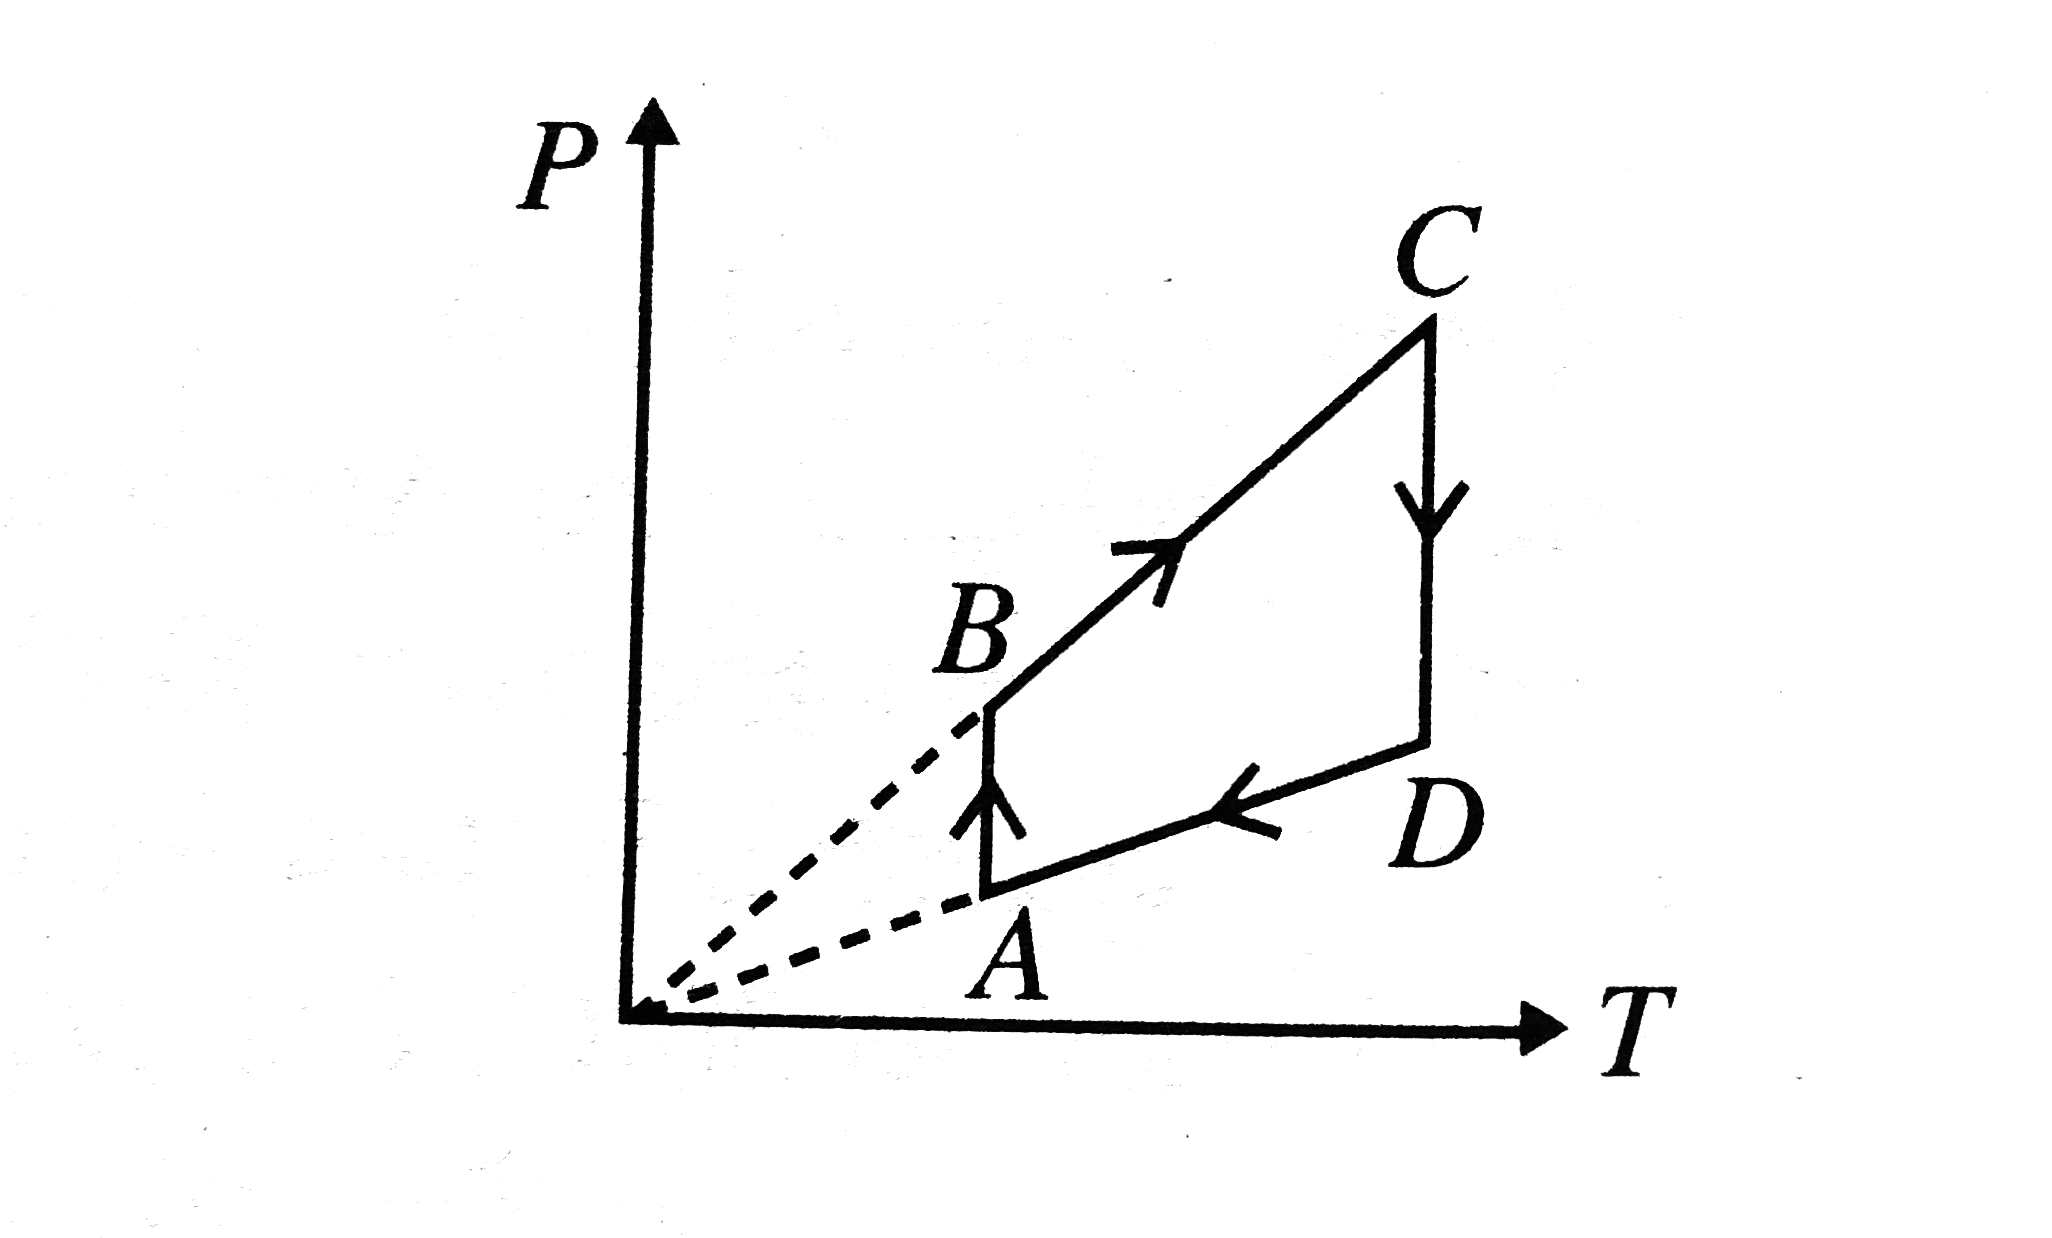
Pressure versus temperature graph of an ideal gas as shown in Fig.
Corresponding density (ρ) versus volume (V) graph will be
 A
A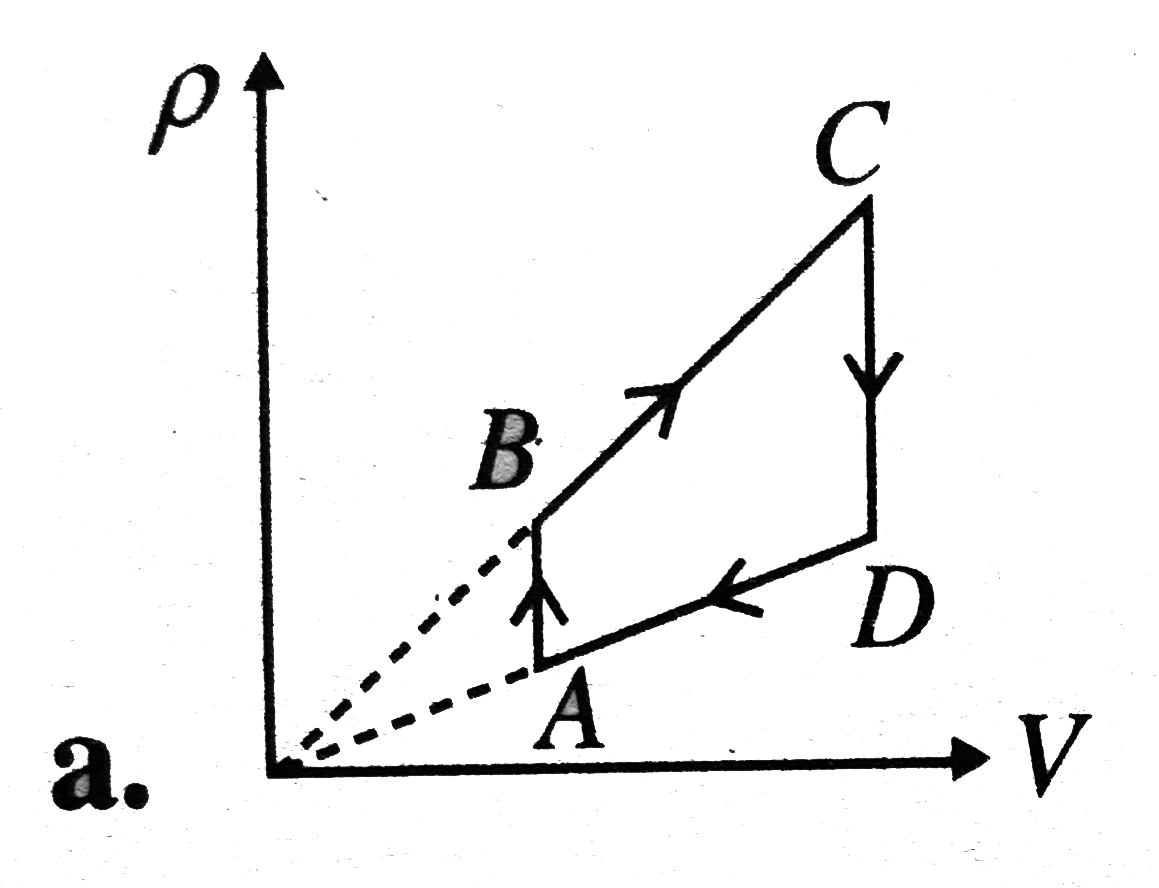 B
B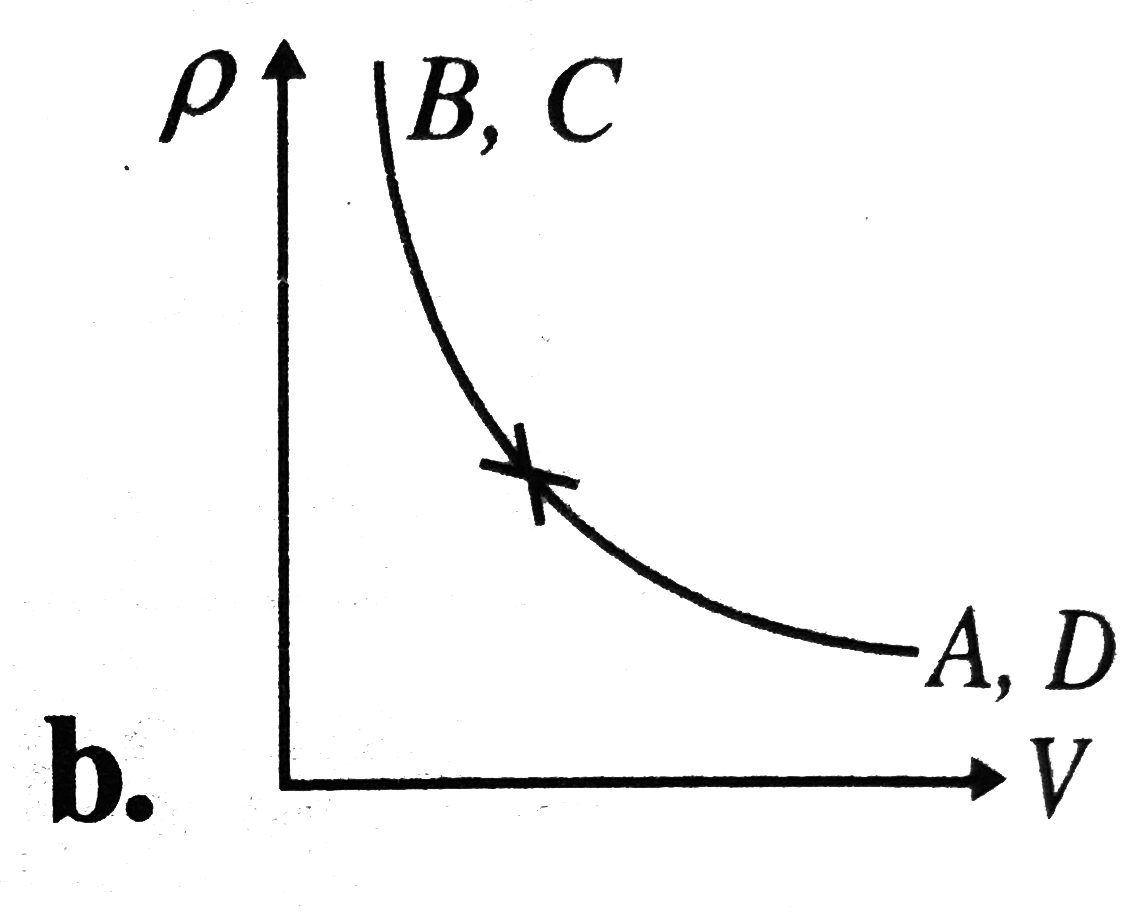 C
C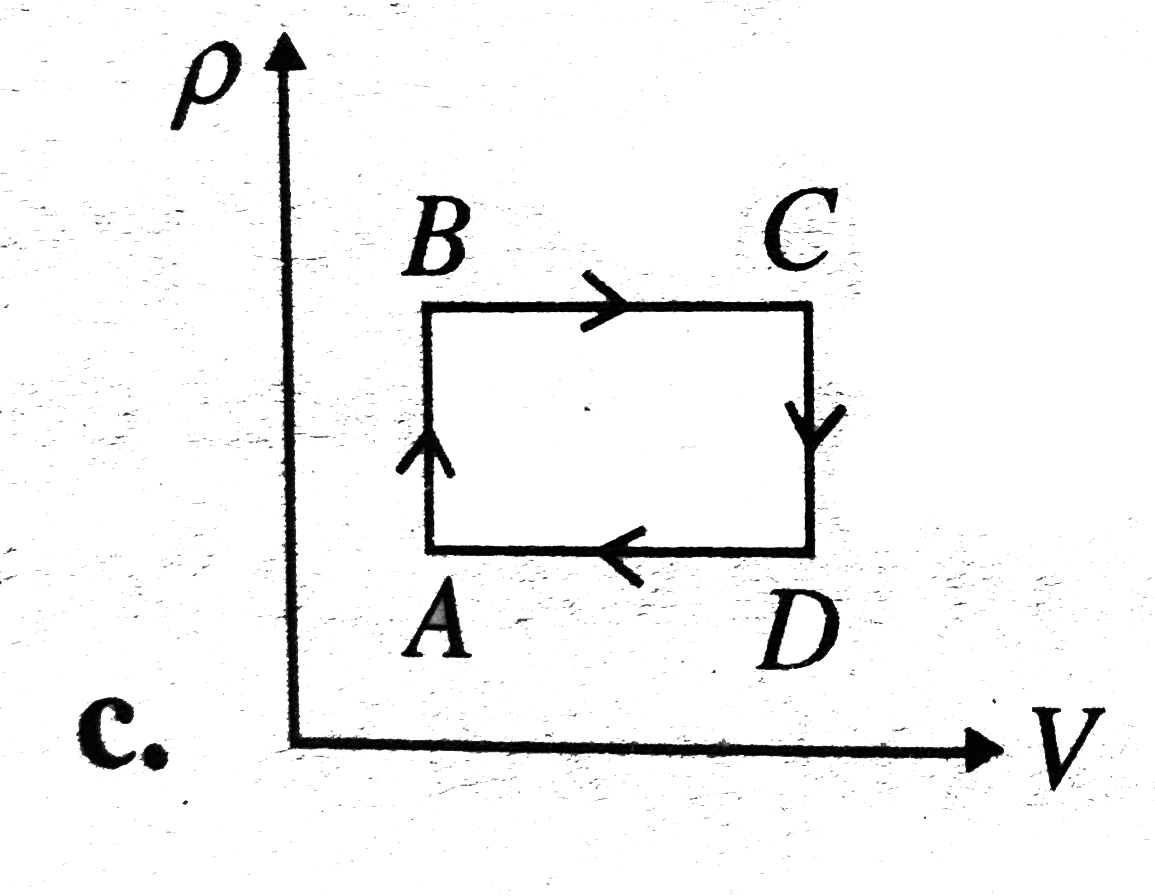 D
D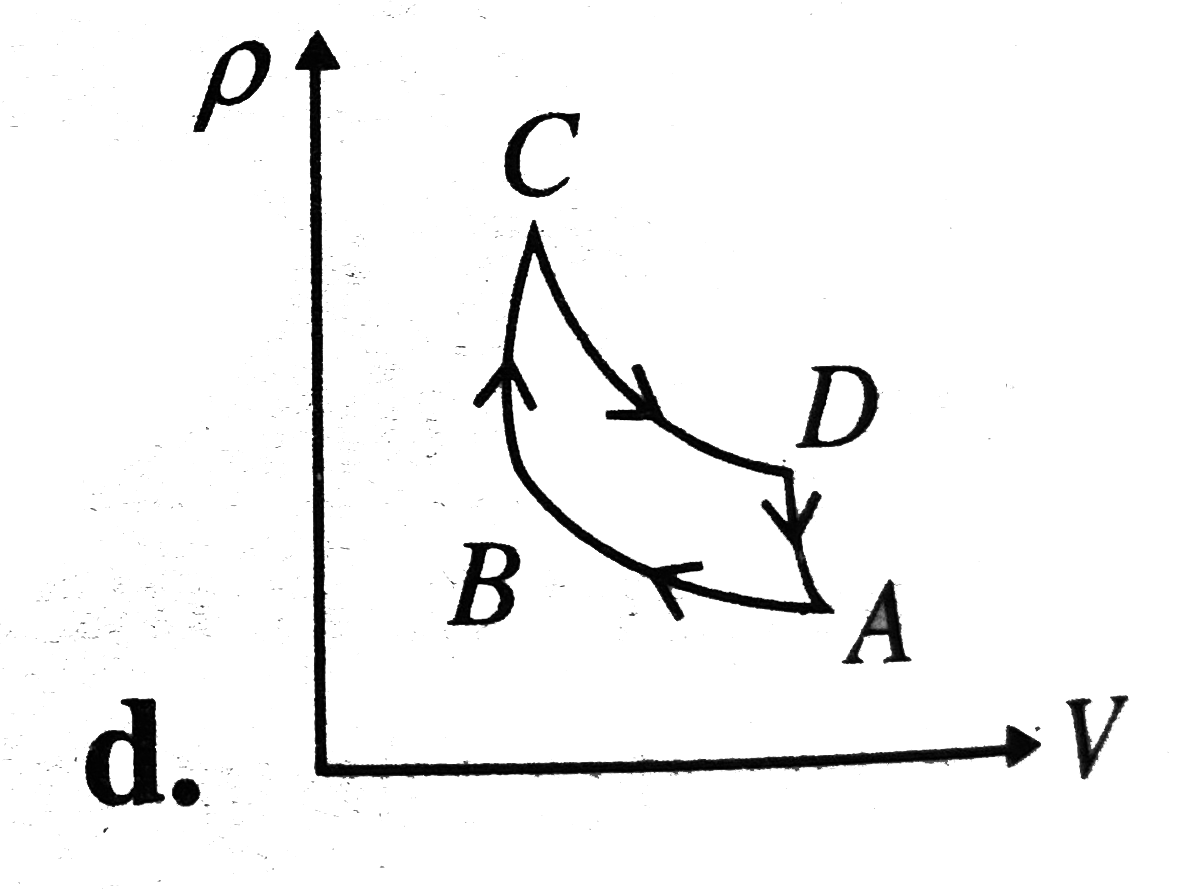
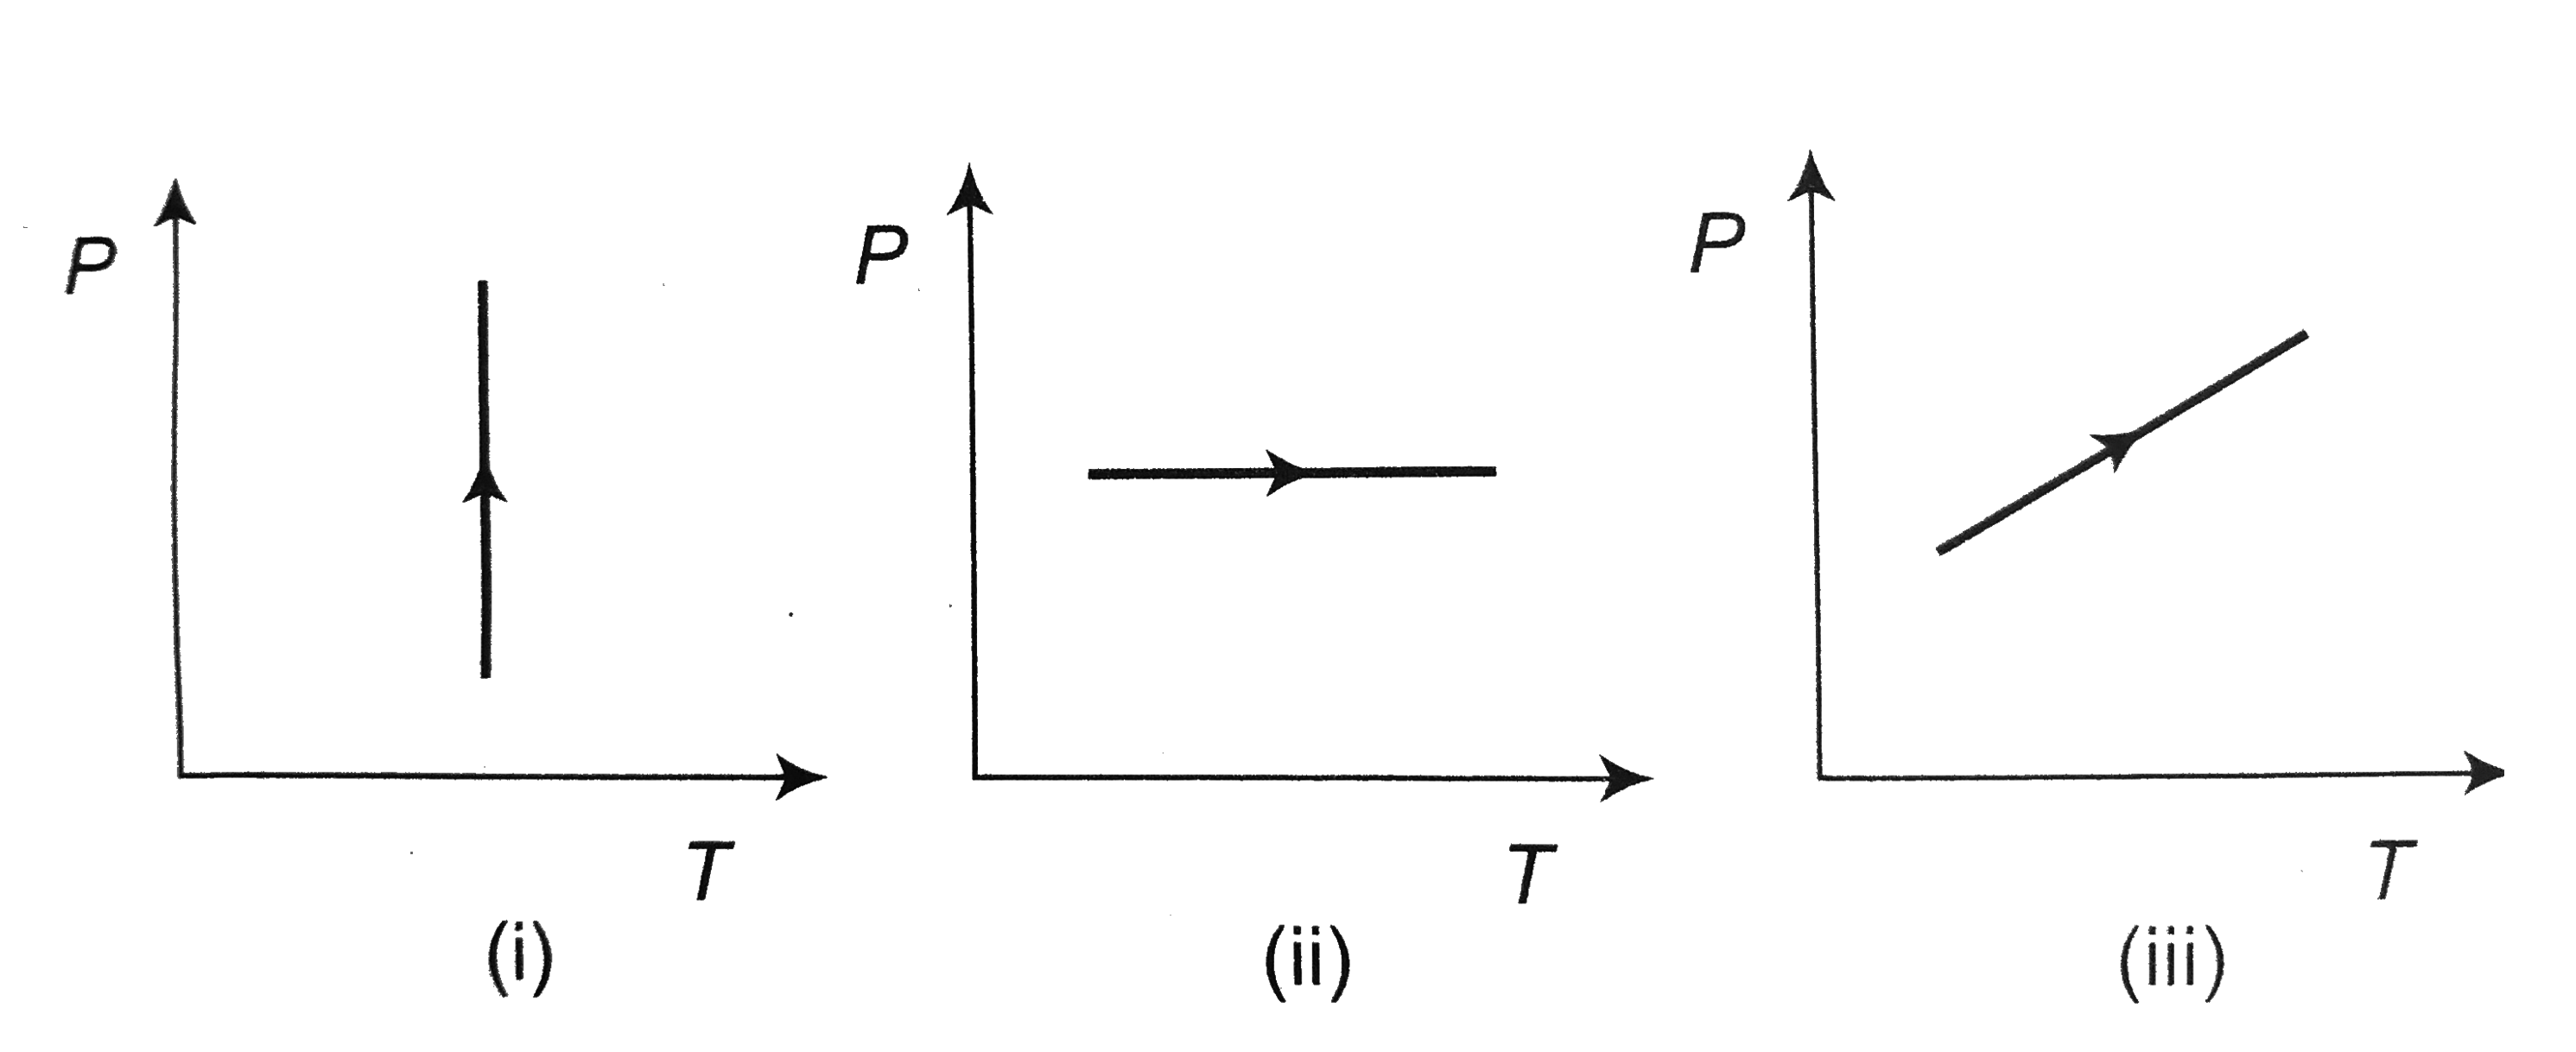
Pressure versus temperature graphs of an ideal gas are as shown in figure. Choose the wrong statement
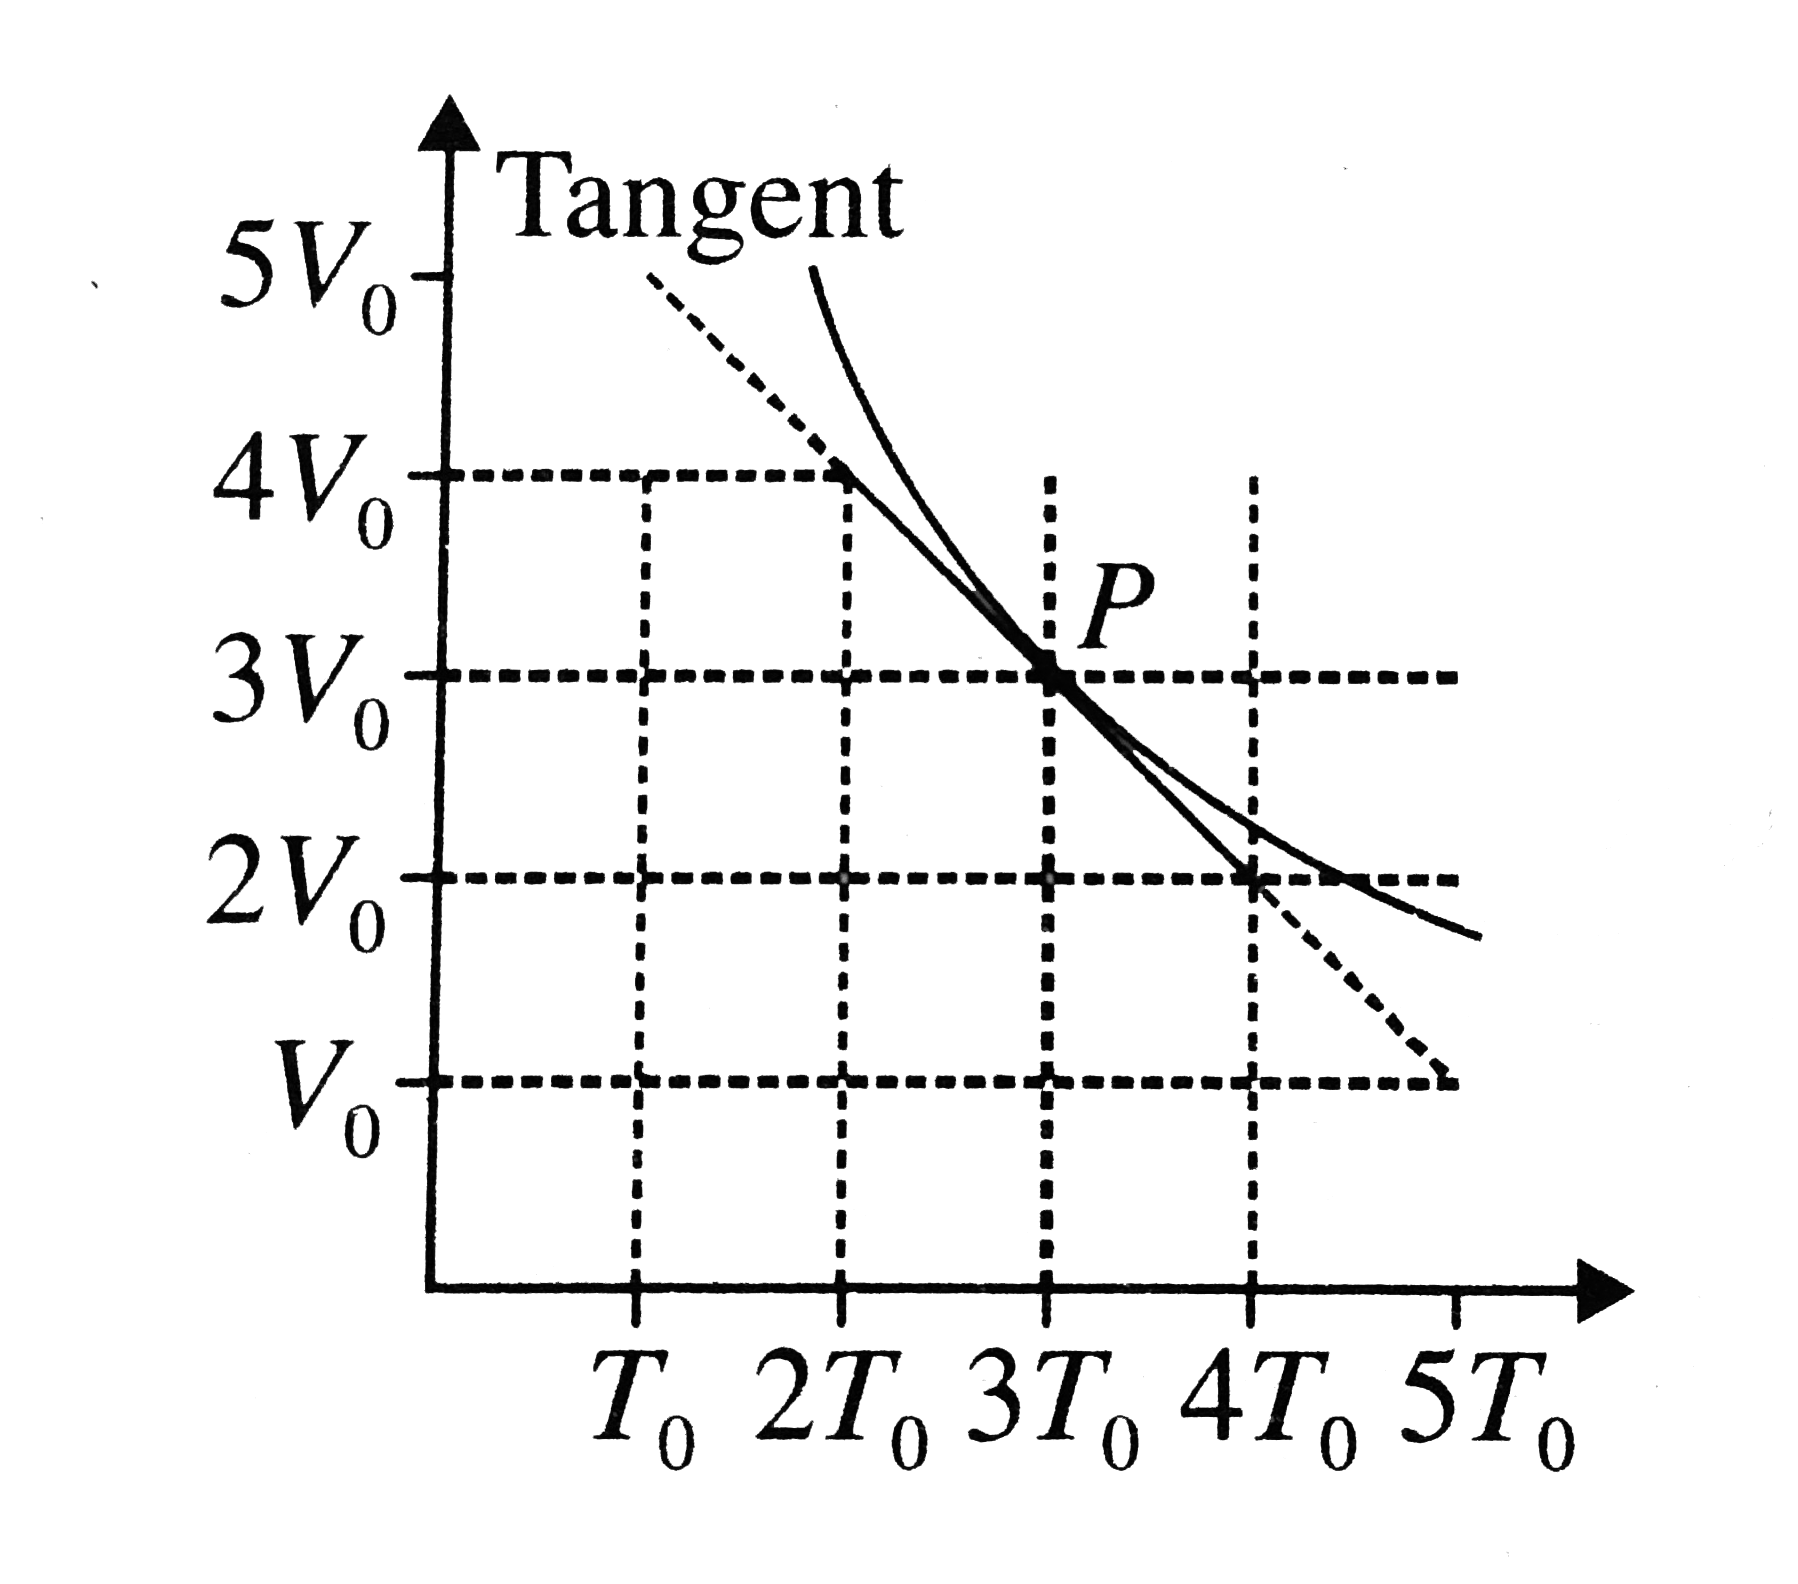
View SolutionFigure shows the adiabatic curve for n moles of an ideal gas, the bulk modulus for the gas corresponding to the point P will be
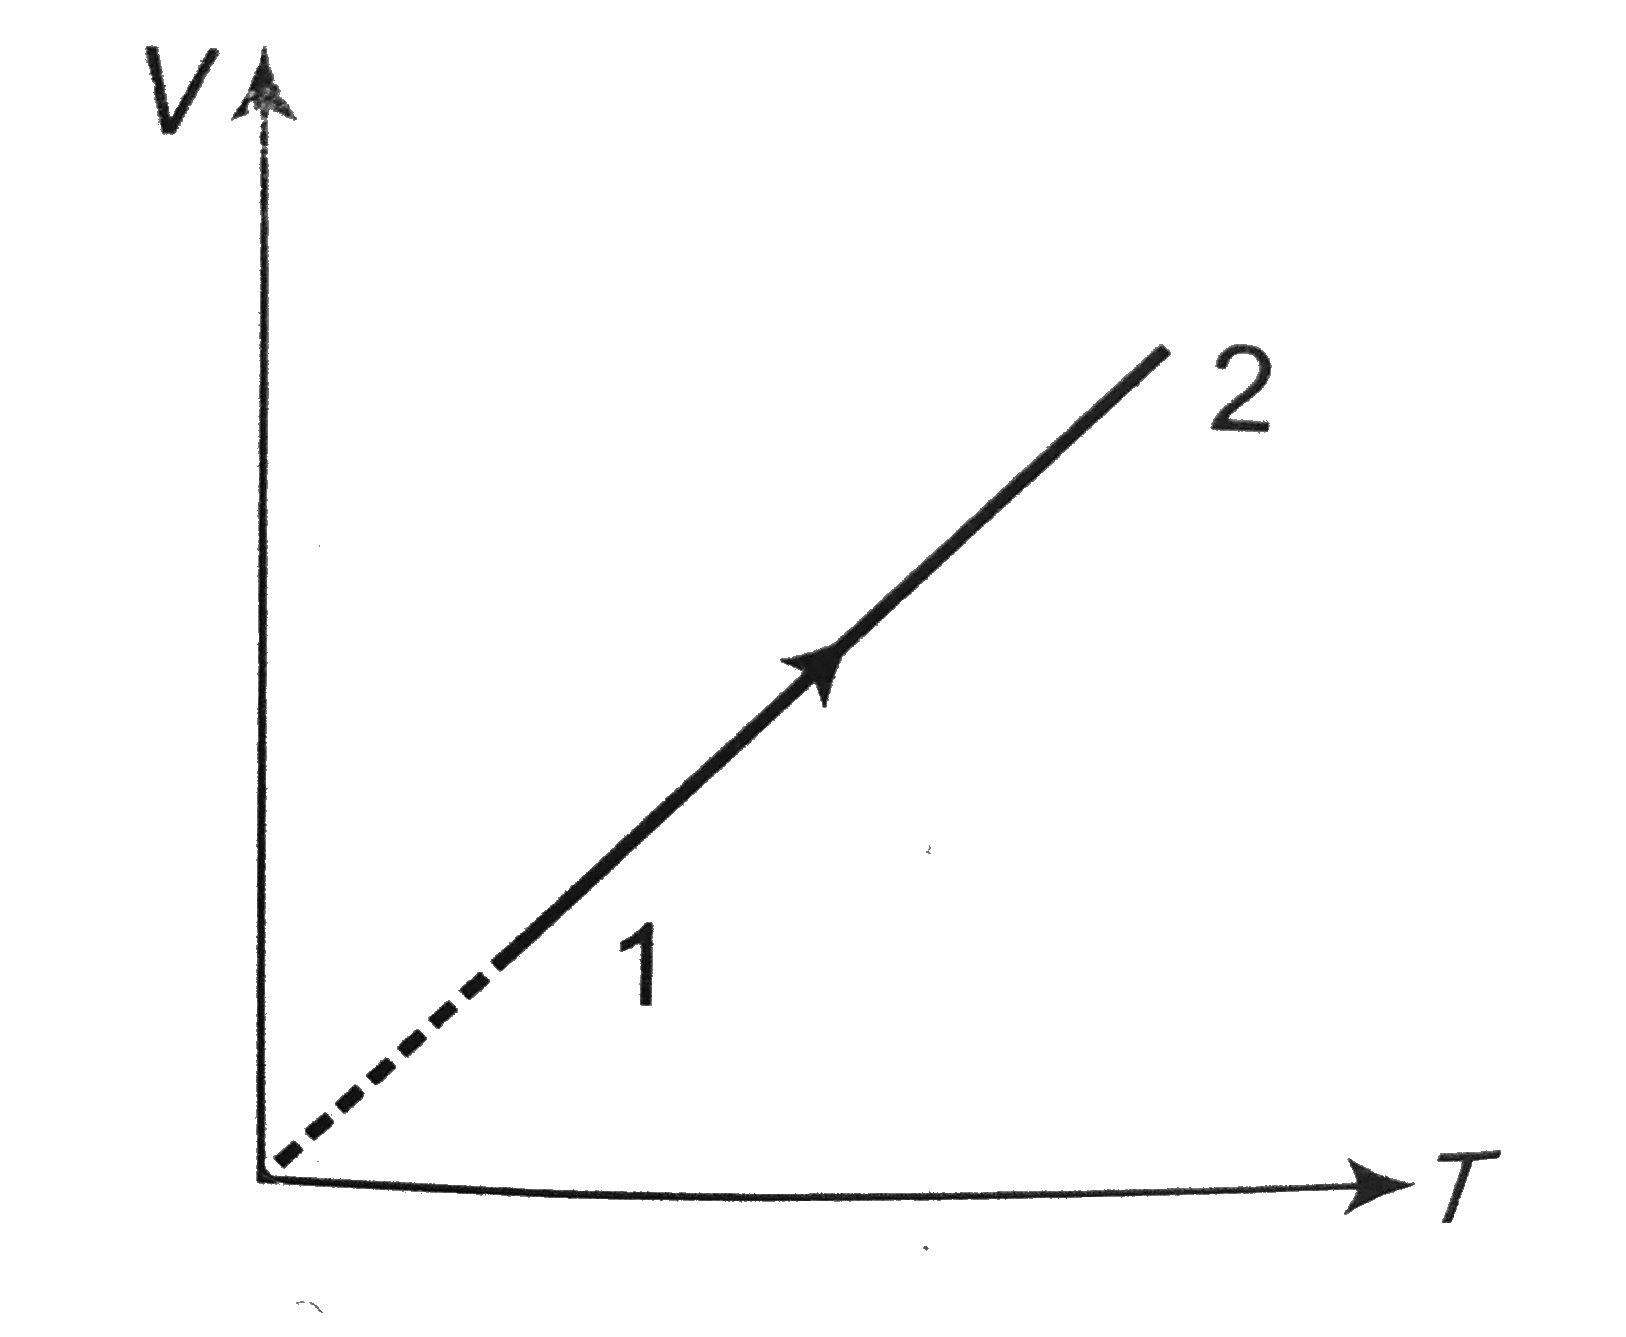
View SolutionVolume versus temperature graph of two moles of helium gas is as shown in figure. The ratio of heat absorbed and the work done by the gas in process 1−2 is
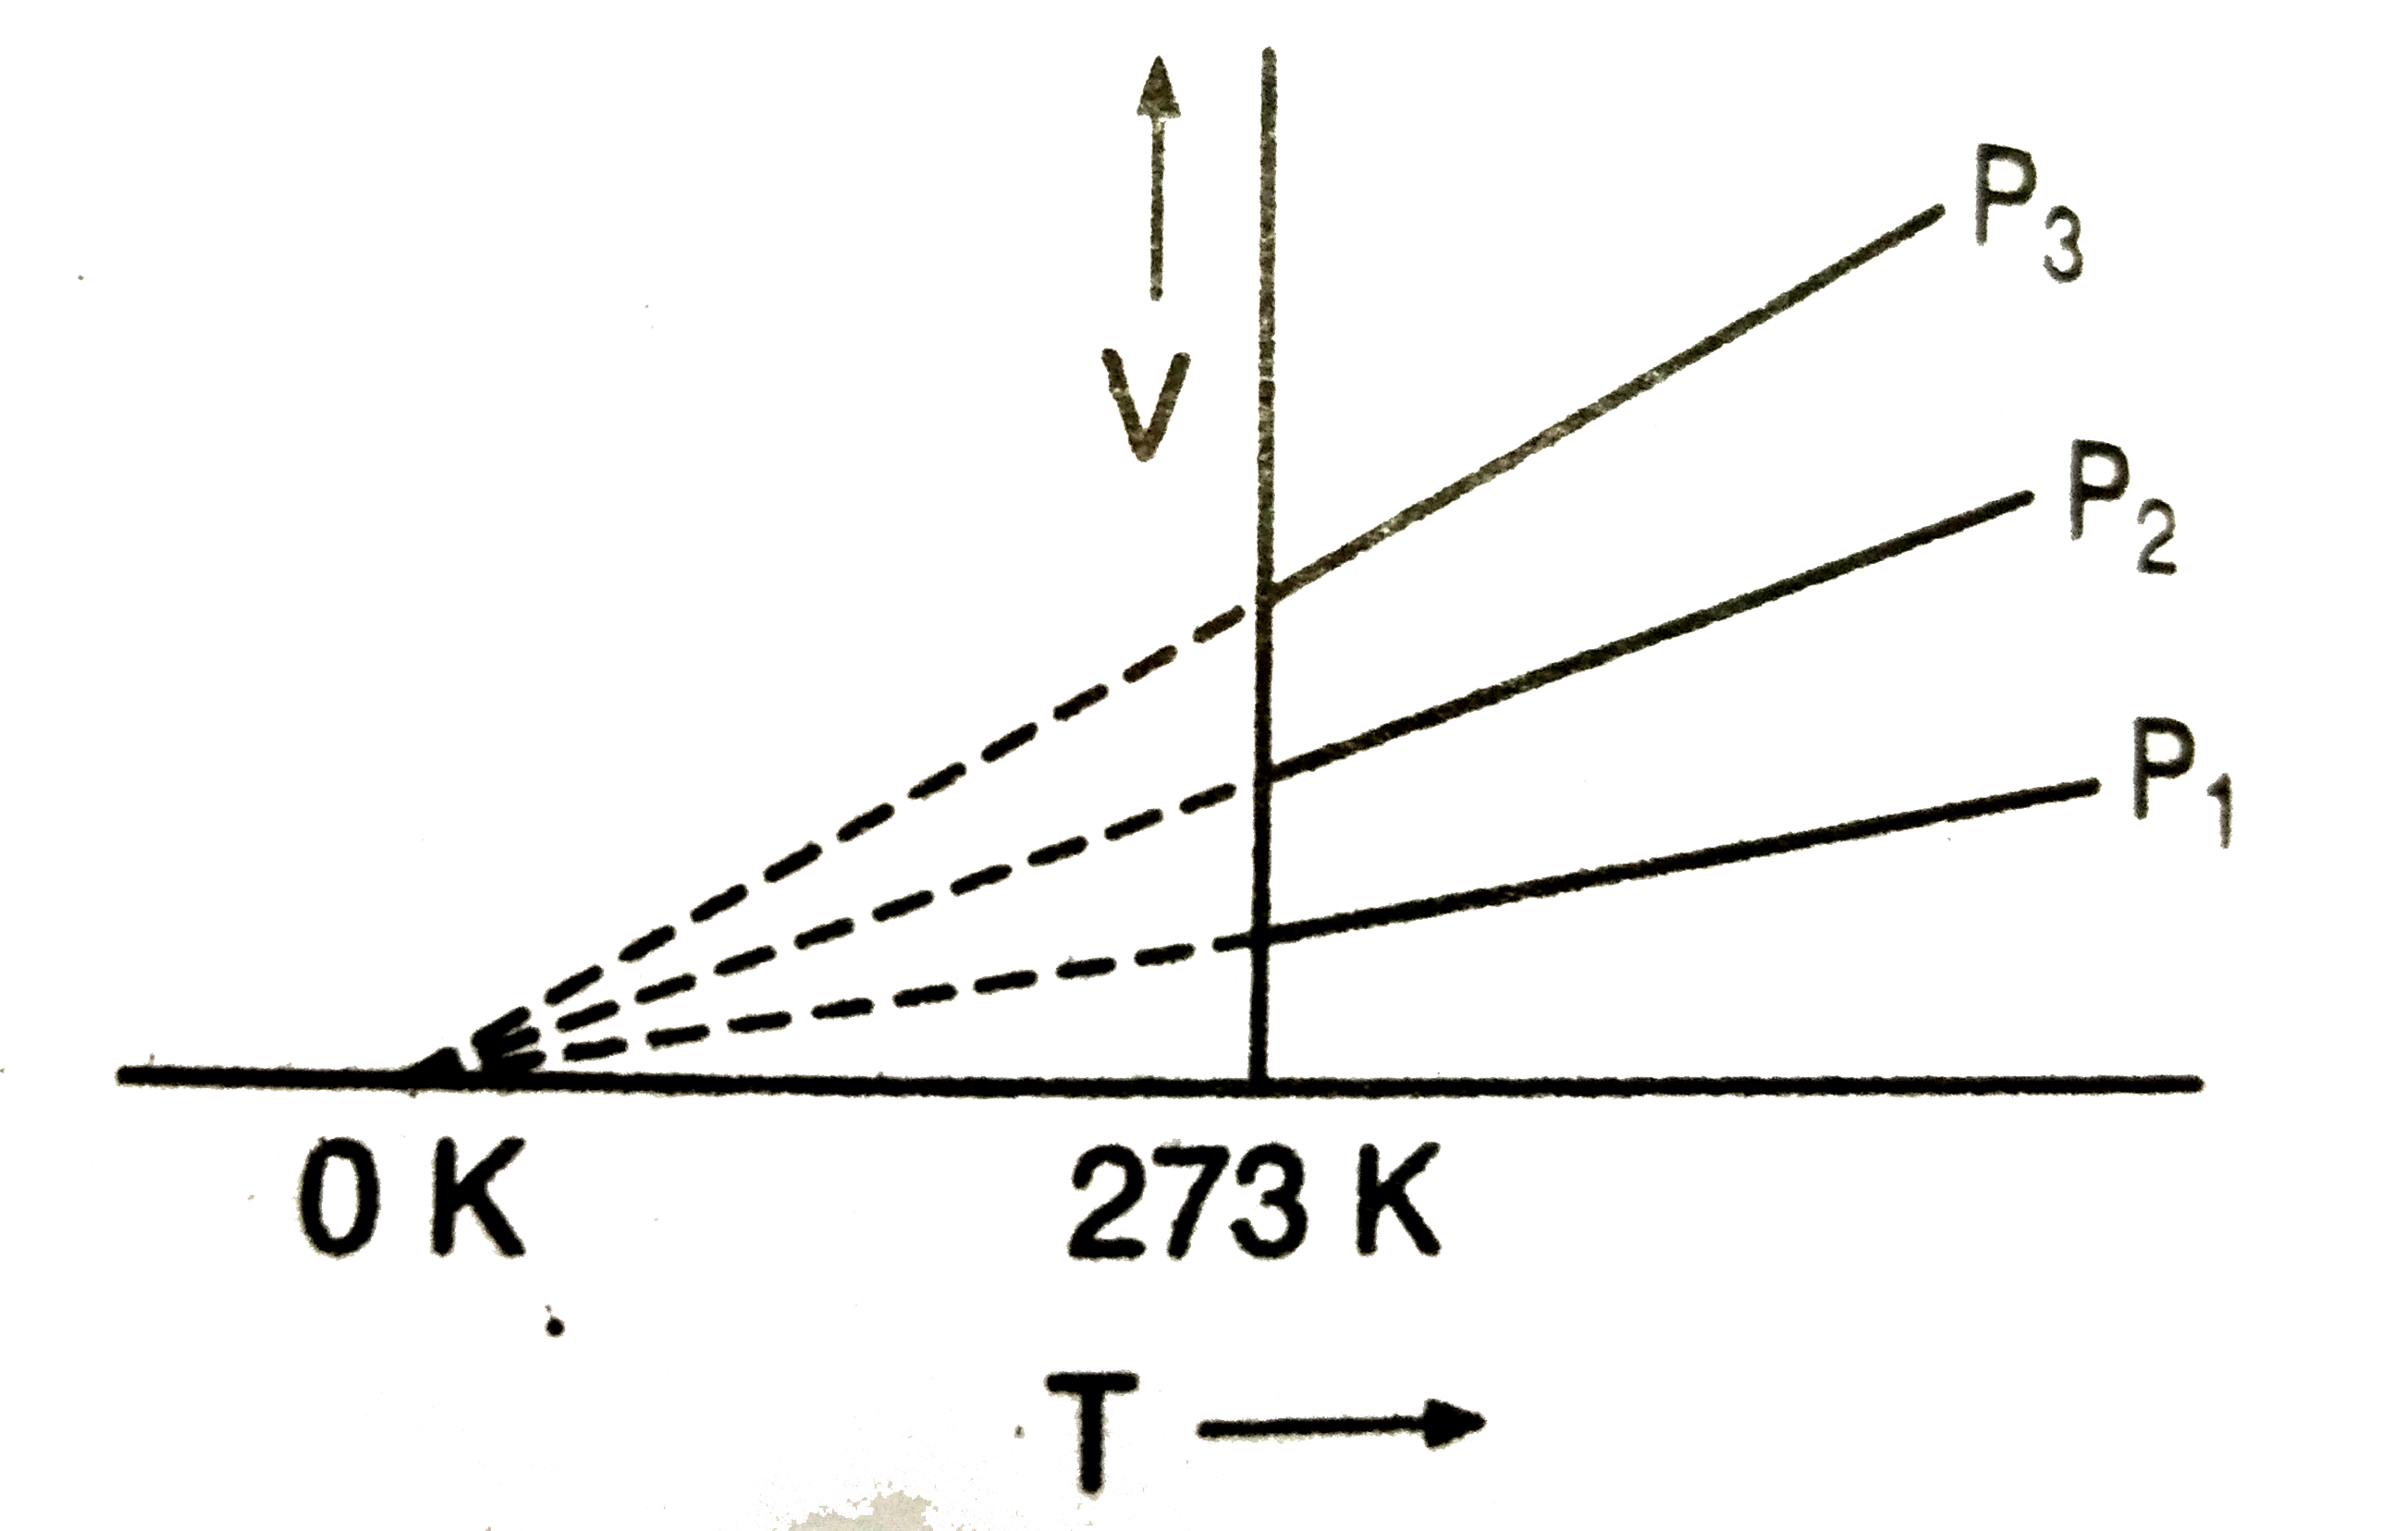
View SolutionThe volume-temperature graphs of a given mass of an ideal gas at constant pressure are shown below. What is the correct order of pressure ?
View SolutionThe P−T graph for the given mass of an ideal gas is shown in figure. Then the volume
_E01_022_Q01.png)
View Solution

