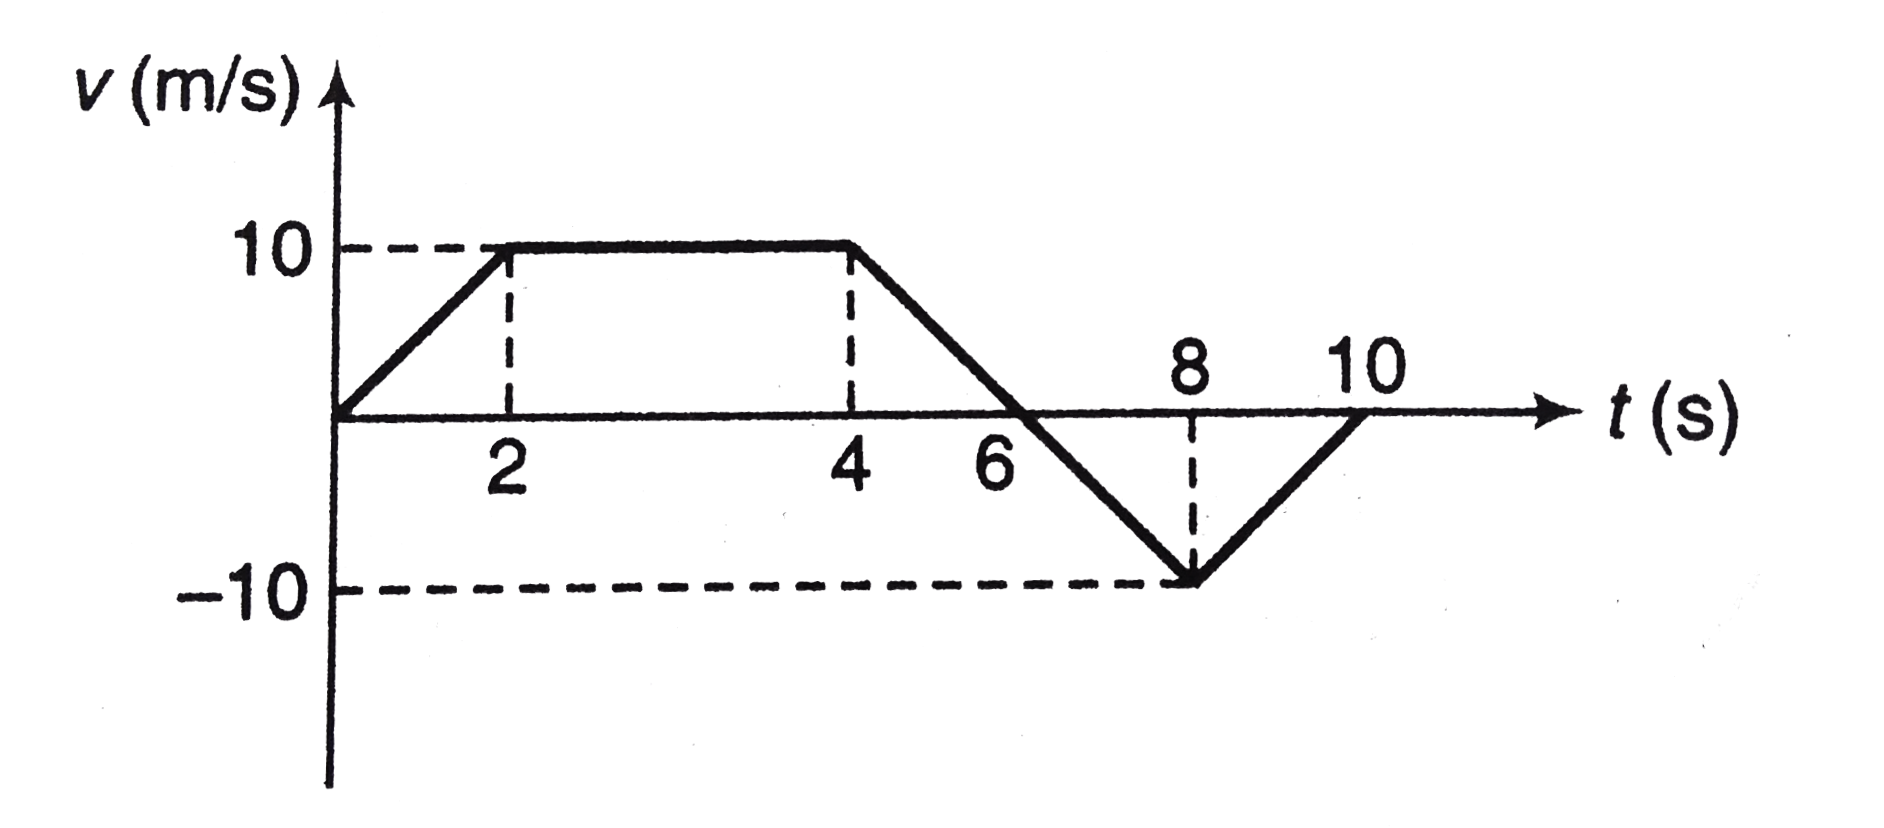
Find the average acceleration in first 20s. (Hint: Area under a−t fraph is equal to the change in velocity).
 .
.
Let us first find the charge in velocity Change in velcity is the area under the acceleration=time graph. For first 20s,
Area =Δv12×10×20+10×20=300ms−1
Average acceleration =ΔvΔt=30020=15ms−2.
Topper's Solved these Questions
- BOOK - CENGAGE PHYSICSCHAPTER - KINEMATICS-1EXERCISE - Subjective29videos
KINEMATICS-1
- BOOK - CENGAGE PHYSICSCHAPTER - KINEMATICS-1EXERCISE - Single Correct52videos
KINEMATICS-1
- BOOK - CENGAGE PHYSICSCHAPTER - KINEMATICS-1EXERCISE - Exercise 4.315videos
KINEMATICS-1
- BOOK - CENGAGE PHYSICSCHAPTER - GRAVITATIONEXERCISE - INTEGER_TYPE1videos
GRAVITATION
- BOOK - CENGAGE PHYSICSCHAPTER - KINEMATICS-2EXERCISE - Exercise Integer9videos
KINEMATICS-2
Similar Questions
Knowledge Check
- Question 1 - Select One
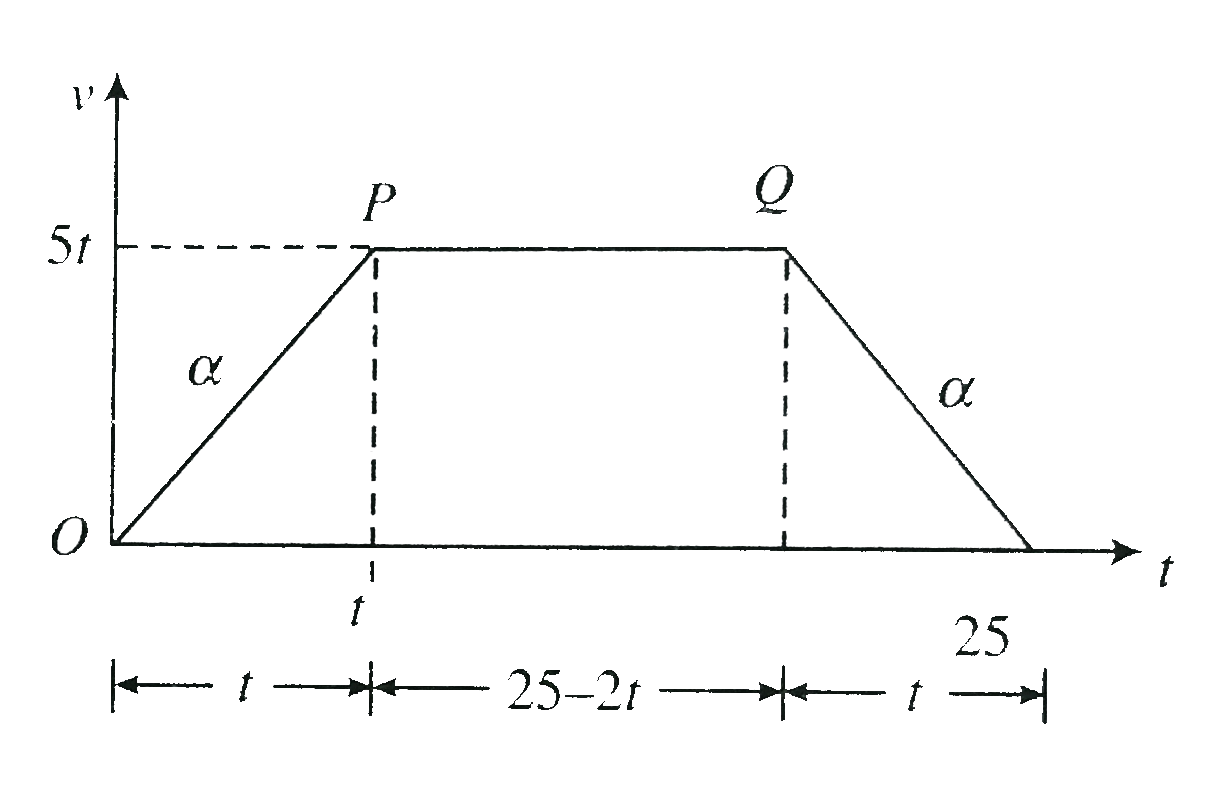
The velocity-time graph of a particle moving along a straight line is shown is . The rate of acceleration and deceleration is constant and it is equal to 5ms−2. If the a average velocity during the motion is 20ms−1, Then
 .
.
The value of t is.A5sB10sC20sD5√2s - Question 2 - Select One
The area under the acceleration-time (a-t) graph gives
AAccelerationBDisplacementCVelocityDChange in velocity - Question 3 - Select One
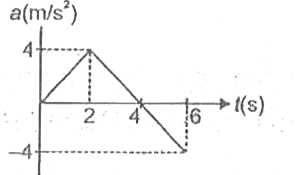
For the acceleration - time (a - t) graph shown in figure, the change in velocity of particle from t = 0 to t = 6 s is
 A10 m/sB4 m/sC12 m/sD8 m/s
The velocity-time graph of a particle moving along a straight line is shown is . The rate of acceleration and deceleration is constant and it is equal to 5ms−2. If the a average velocity during the motion is 20ms−1, Then
 .
.
The value of t is.View SolutionAcceleration-time graph of a particle moving in a straight line is as shown in figure. At time t=0, velocity of the particle is zero. Find

(a) average acceleration in a time interval from t=6s to t=12s,
(b) velocity of the particle at t=14s.View Solutionvelocity-time graph of a particle moving in a straight line is as shown in figure. At time t=0, velocity of the particle is zero. Find

(a) average acceleration in a time interval from t=6s to t=12s,
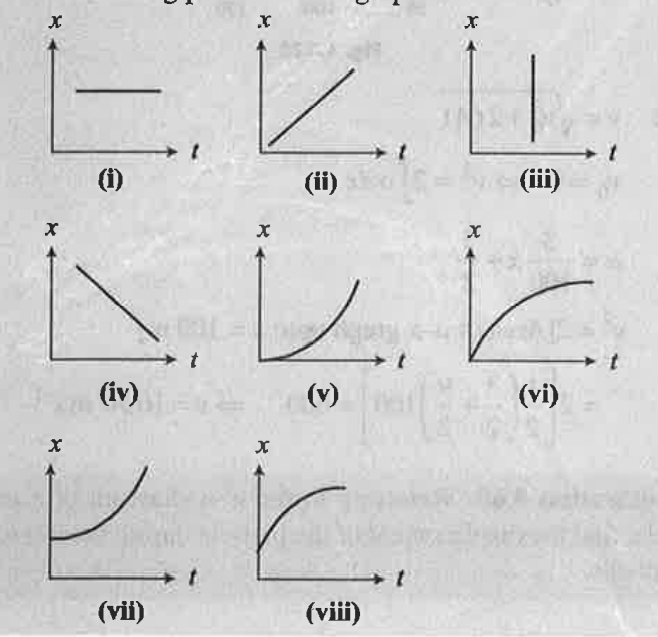
(b) velocity of the particle at t=14s.View Solutiona. What can you say about velocity in each of the following position-time graphs?
 .
.
b. The slope of the velocity-time graph is equal to acceleration. (True//False)
c. What does the area under acceleration-time graph represents?
d. Can velocity-time graph be parallel to the velocity axis? (Yes//No)
e. What is the slope of the v−t fraph in uniform motion? .View SolutionFor the acceleration - time (a - t) graph shown in figure, the change in velocity of particle from t = 0 to t = 6 s is
 View Solution

