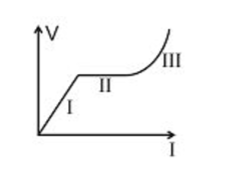
For a conducting wire V → I graph is as shown in figure given below, therefore its resistance will be .....
A
sin50∘
B
cos50∘
C
tan50∘
D
cot50∘
Text Solution
The correct Answer is:C
tan50∘
Slope of graph = dydx=tanθ
Here, dy = dv, dx = dI
Now R = VI,R=dVdI
∴R=dVdI=dydx=tanθ=tan50

|
Topper's Solved these Questions
- CURRENT ELECTRICITYBOOK - KUMAR PRAKASHANCHAPTER - CURRENT ELECTRICITYEXERCISE - SECTION [D] MULTIPLE CHOICE QUESTIONS (MCQs) (MCQs ASKED IN COMPETITIVE EXAMS)
21 Videos
- CURRENT ELECTRICITYBOOK - KUMAR PRAKASHANCHAPTER - CURRENT ELECTRICITYEXERCISE - SECTION [D] MULTIPLE CHOICE QUESTIONS (MCQs) (MCQs ASKED IN CBSE-PMT, AIPMT, NEET)
17 Videos
- CURRENT ELECTRICITYBOOK - KUMAR PRAKASHANCHAPTER - CURRENT ELECTRICITYEXERCISE - SECTION C (LONG ANSWER TYPE QUESTIONS )
5 Videos
- BOARD'S QUESTION PAPER MARCH-2020 BOOK - KUMAR PRAKASHANCHAPTER - BOARD'S QUESTION PAPER MARCH-2020 EXERCISE - PART-B SECTION -C
4 Videos
- DUAL NATURE OF RADIATION AND MATTERBOOK - KUMAR PRAKASHANCHAPTER - DUAL NATURE OF RADIATION AND MATTEREXERCISE - Section-D (MCQs asked in GUJCET/Board Exam)
1 Videos
Similar Questions
Knowledge Check
For the circuit shown in figure given below, the equivalent resistance points A and B is
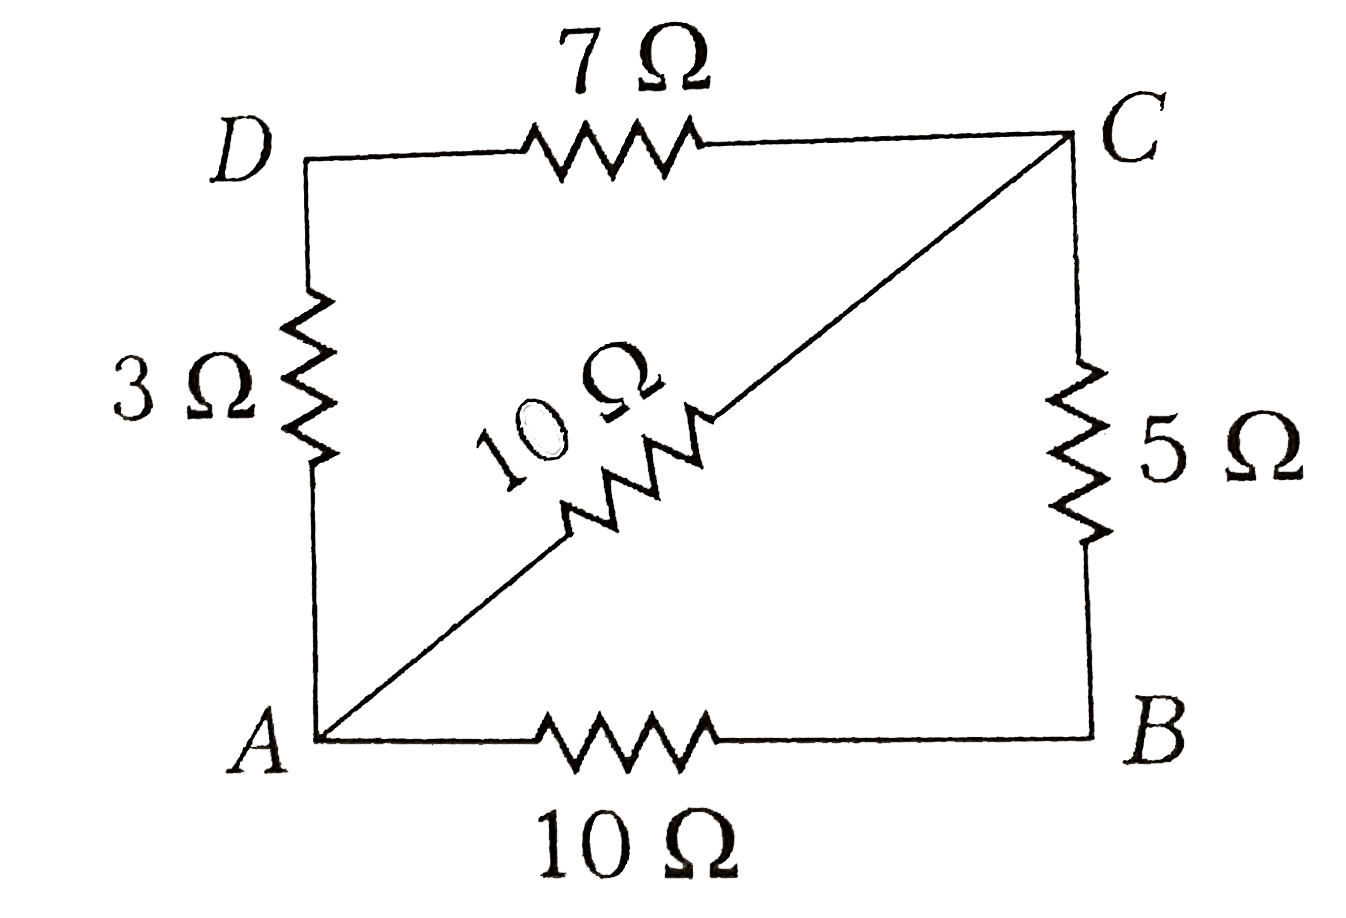 A10ΩB5ΩC103ΩD2Ω
A graph of x verus t is shown in the figure given below. Choose correct alternatives from below.
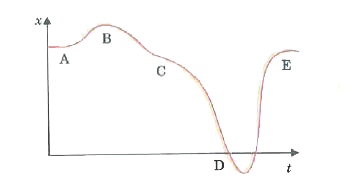 AThe particle was released from rest at t = 0 .BAt B, the acceleration a>0 .CAt C, the velocity and the acceleration vanish .DAverage velocity for the motion between A and D is positive .
Three resistors are connected to a 6 V battery as shown in the figure given below :
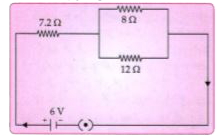
Calculate :
the equivalent resistance of the circuit.
View SolutionIn the V-T graph shown in figure match the following.
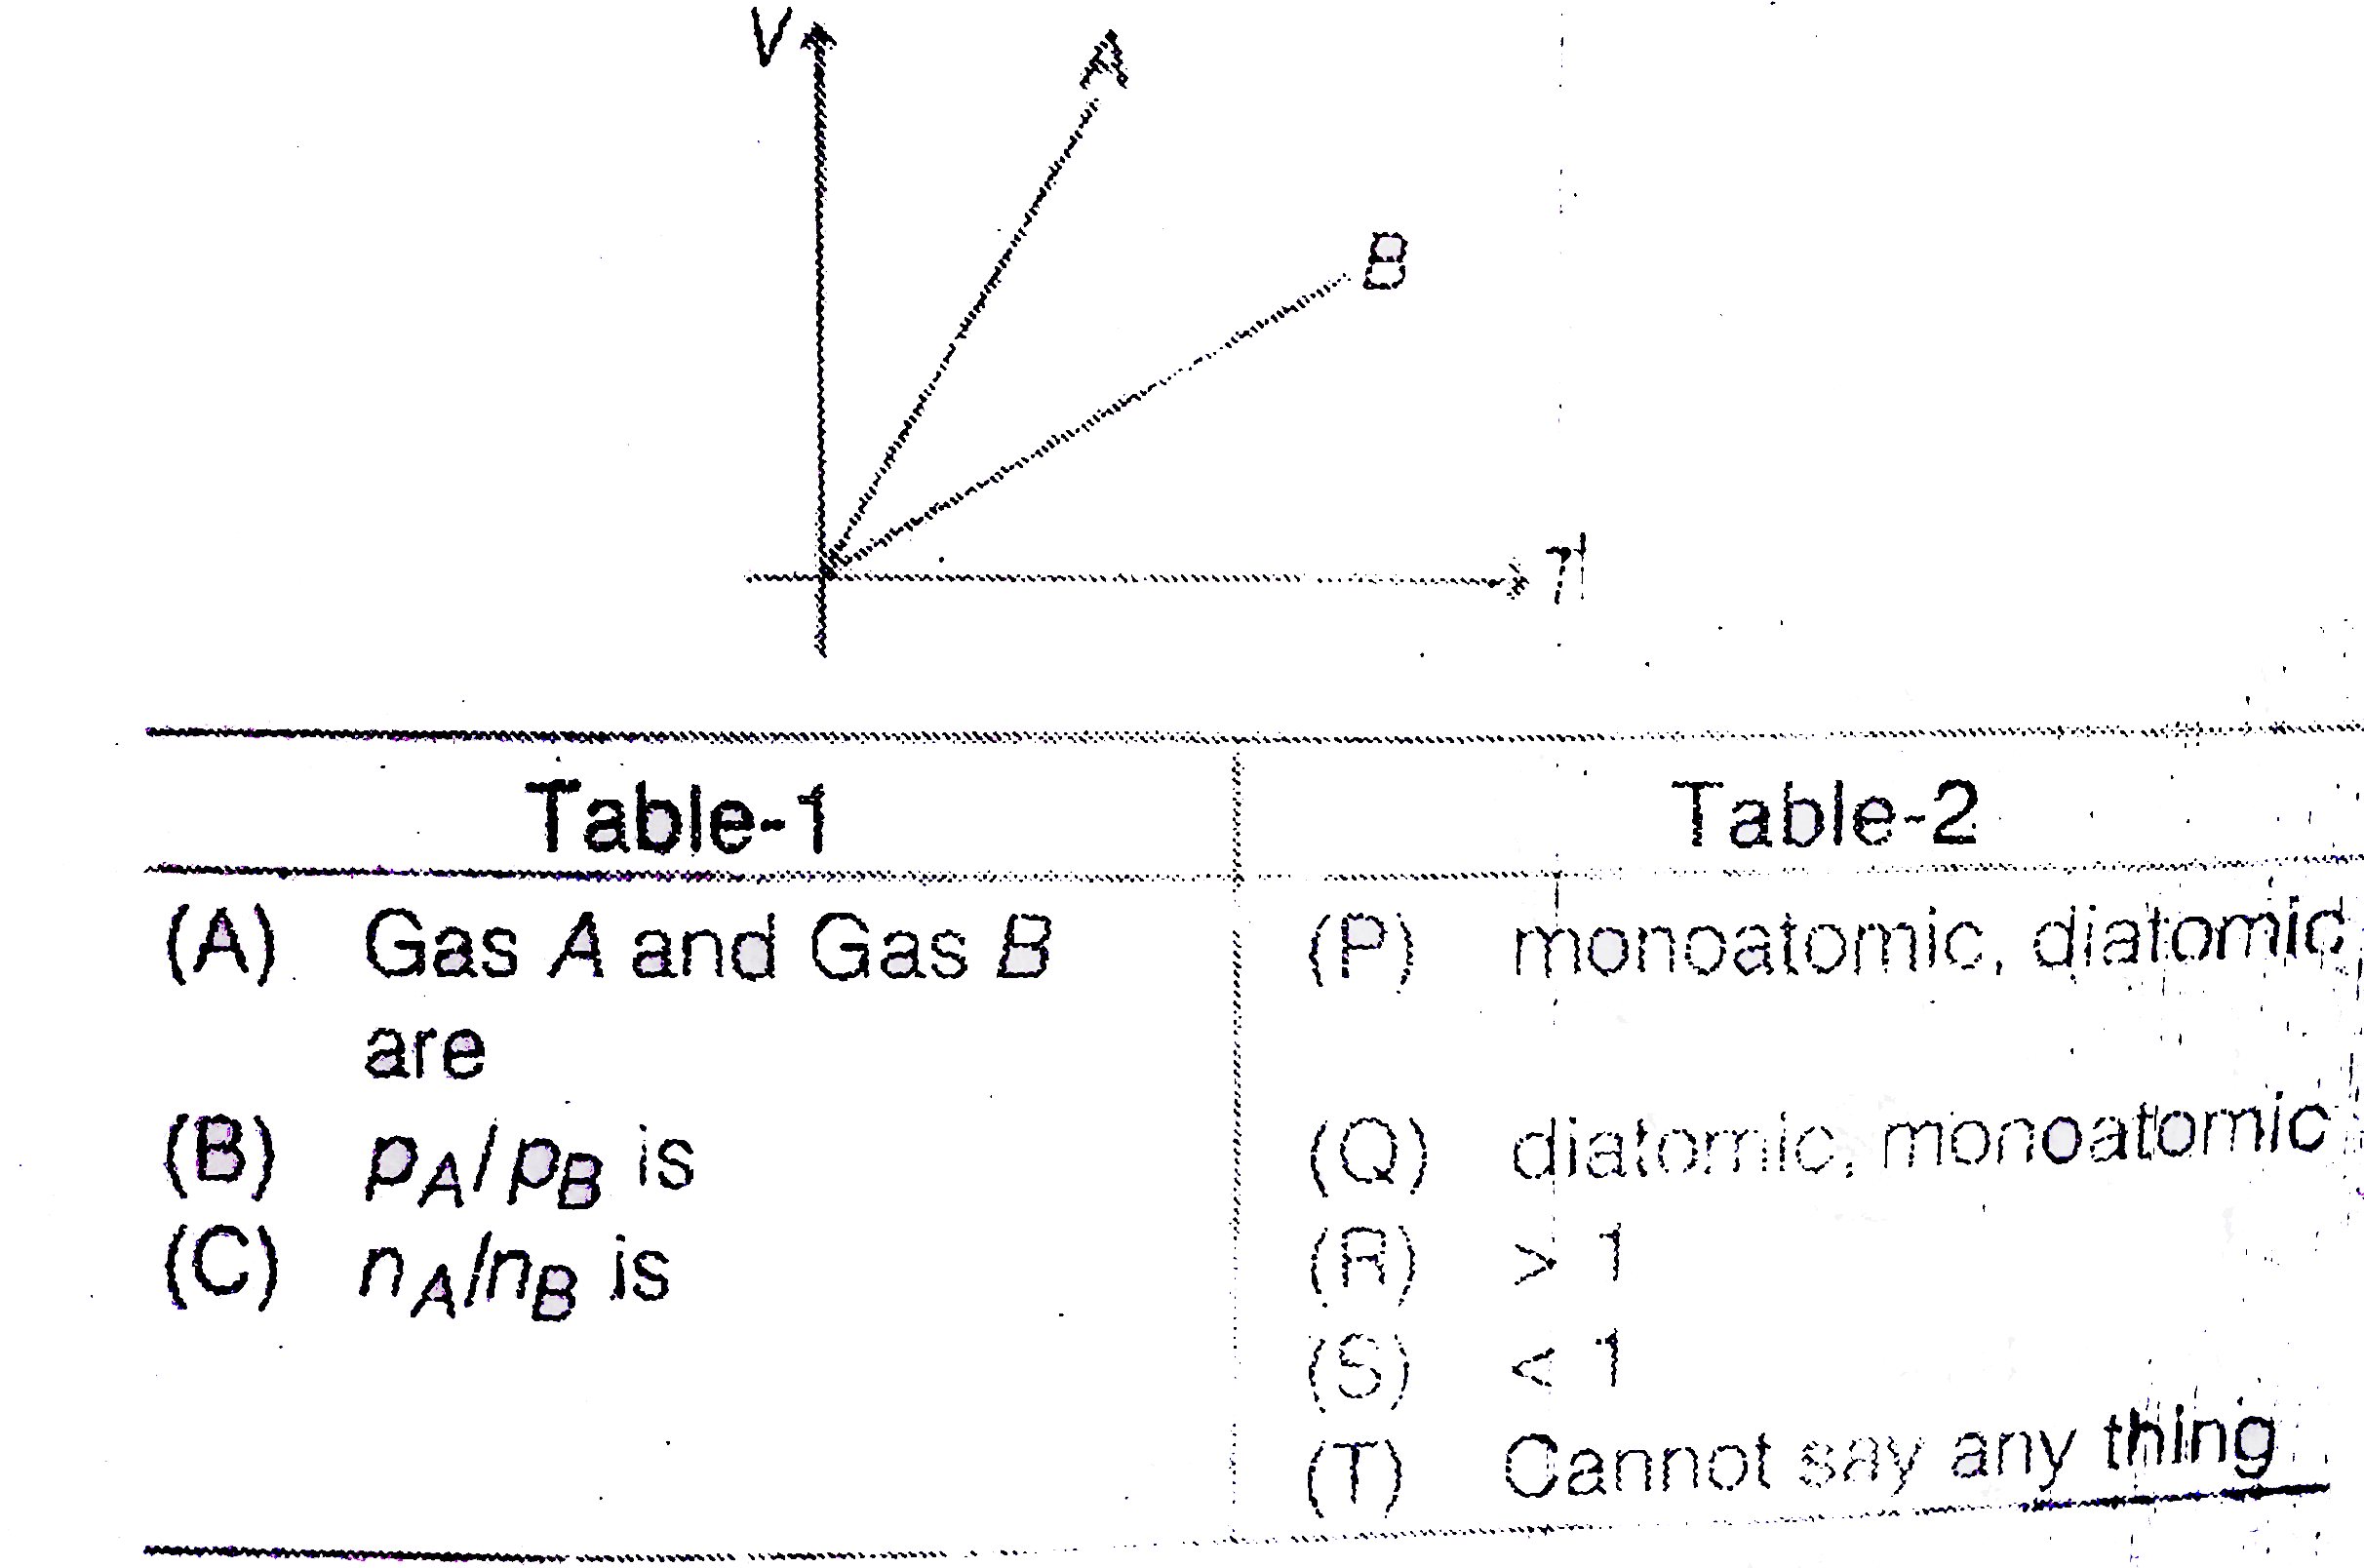
View SolutionIn the V-T graph shown in figure match the following.

View SolutionA conducting wire carrying current I is shown in the figure. The magnitude of magnetic field at the point P will be

View SolutionA conducting wire carrying current I is shown in the figure. The magnitude of magnetic field at the point P will be

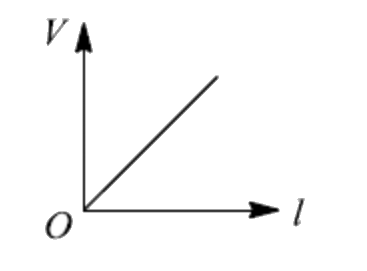
View SolutionThe V – I graph for a wire of copper of length L and cross -section area A is shown in the figure below . The slope of the graph will be
View Solution

