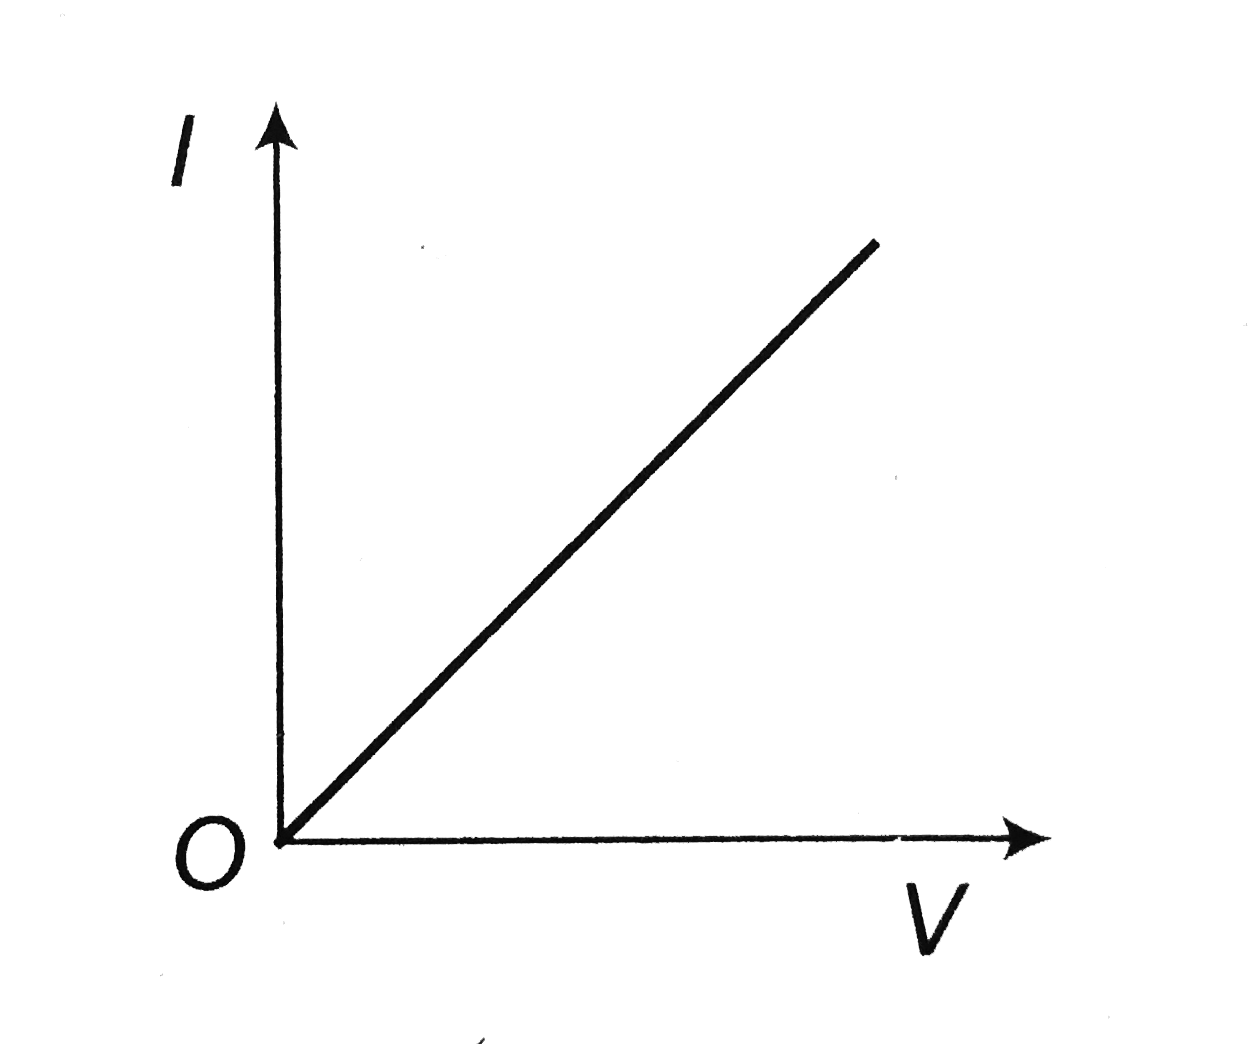
The V – I graph for a wire of copper of length L and cross -section area A is shown in the figure below . The slope of the graph will be
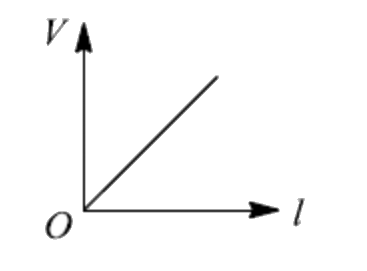
Less if the experiment is repeated at a higher temperature
More if wire of silver having the same dimension is used
Doubled if the length of the wire is doubled
Doubled if the length of the wire is halved
The correct Answer is:C
Step by step video & image solution for The V – I graph for a wire of copper of length L and cross -section area A is shown in the figure below . The slope of the graph will be by Physics experts to help you in doubts & scoring excellent marks in Class 12 exams.
Updated on:21/07/2023Similar Questions
Knowledge Check
A metal wire of length L1 and area of cross section A is attached to a rigid support. Another metal wire of length L2 and of the same cross sectional area is attached to the free end of the first wire. A body of mass M is then suspended from the free end of the second wire, if Y1 and Y2 are the Young's moduli of the wires respectively the effective force constant of the system of two wires is
A[(Y1Y2)A][2(Y1L2+Y2L1)]B[(Y1Y2)A](L1L2)2C[(Y1Y2)A](Y1L2+Y2L1)D[(Y1Y2)1/2A](L2+L1)1/2A metal wire of length L1 and area of cross section A is ttached to a rigid support. Another metal wire of length L2 and of the same cross sectional area is attached to the free end of the first wire. A body of mass M is then suspended from the free end of the second wire, if Y1 and Y2 are the Young's moduli of the wires respectively the effective force constant of the system of two wires is
AY1Y2A2(Y1L2+Y2L1)BY1Y2A(L1L2)1/2CY1Y2A(Y1L2+Y2L1)D(Y1Y2)1/2A(L1L2)1/2
Magnitude of slope of the shown graph.
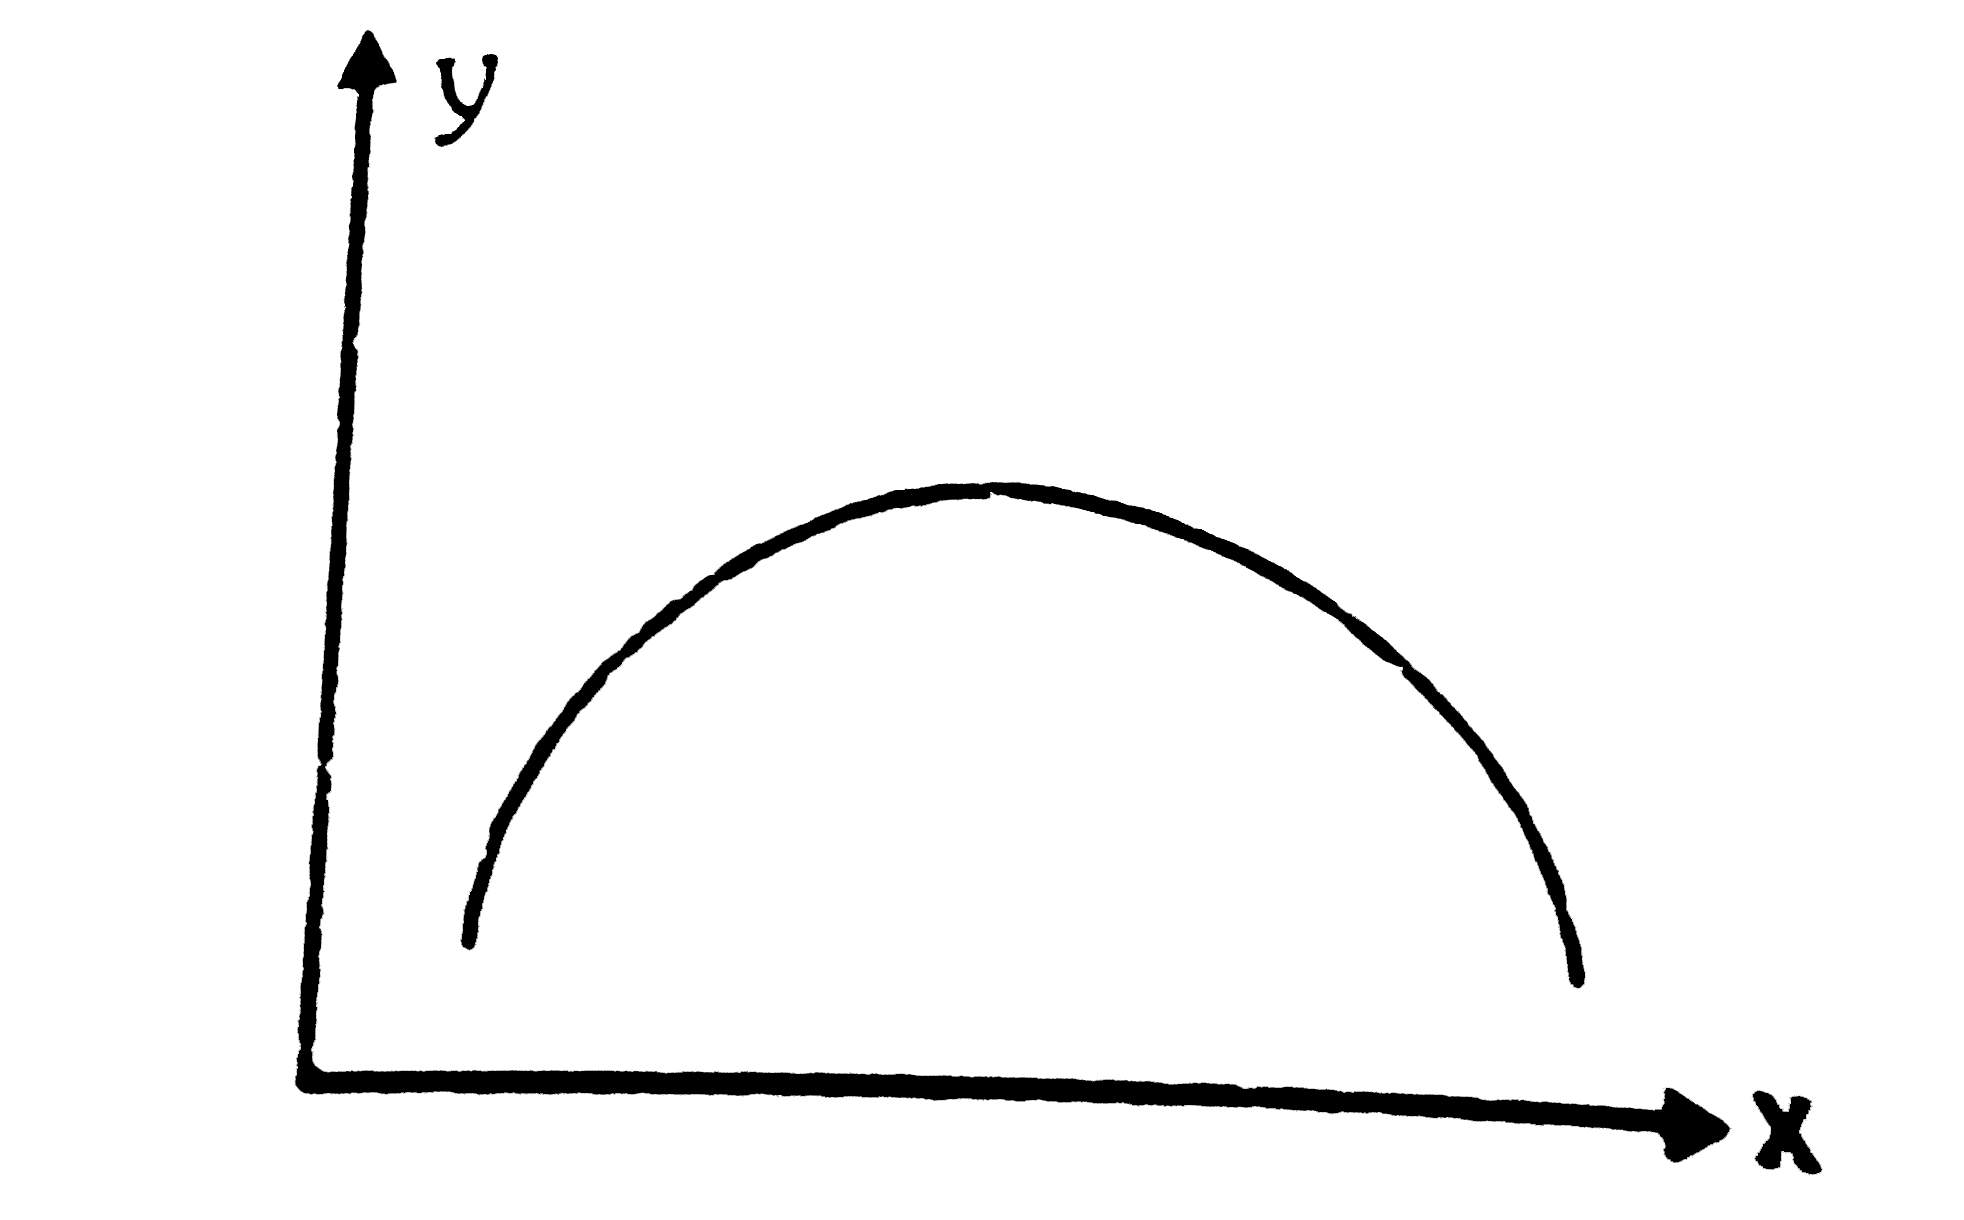
View SolutionMagnitude of slope of the shown graph.

View SolutionTwo concentric spherical sheels are as shown in figure. The V−r graph will be as
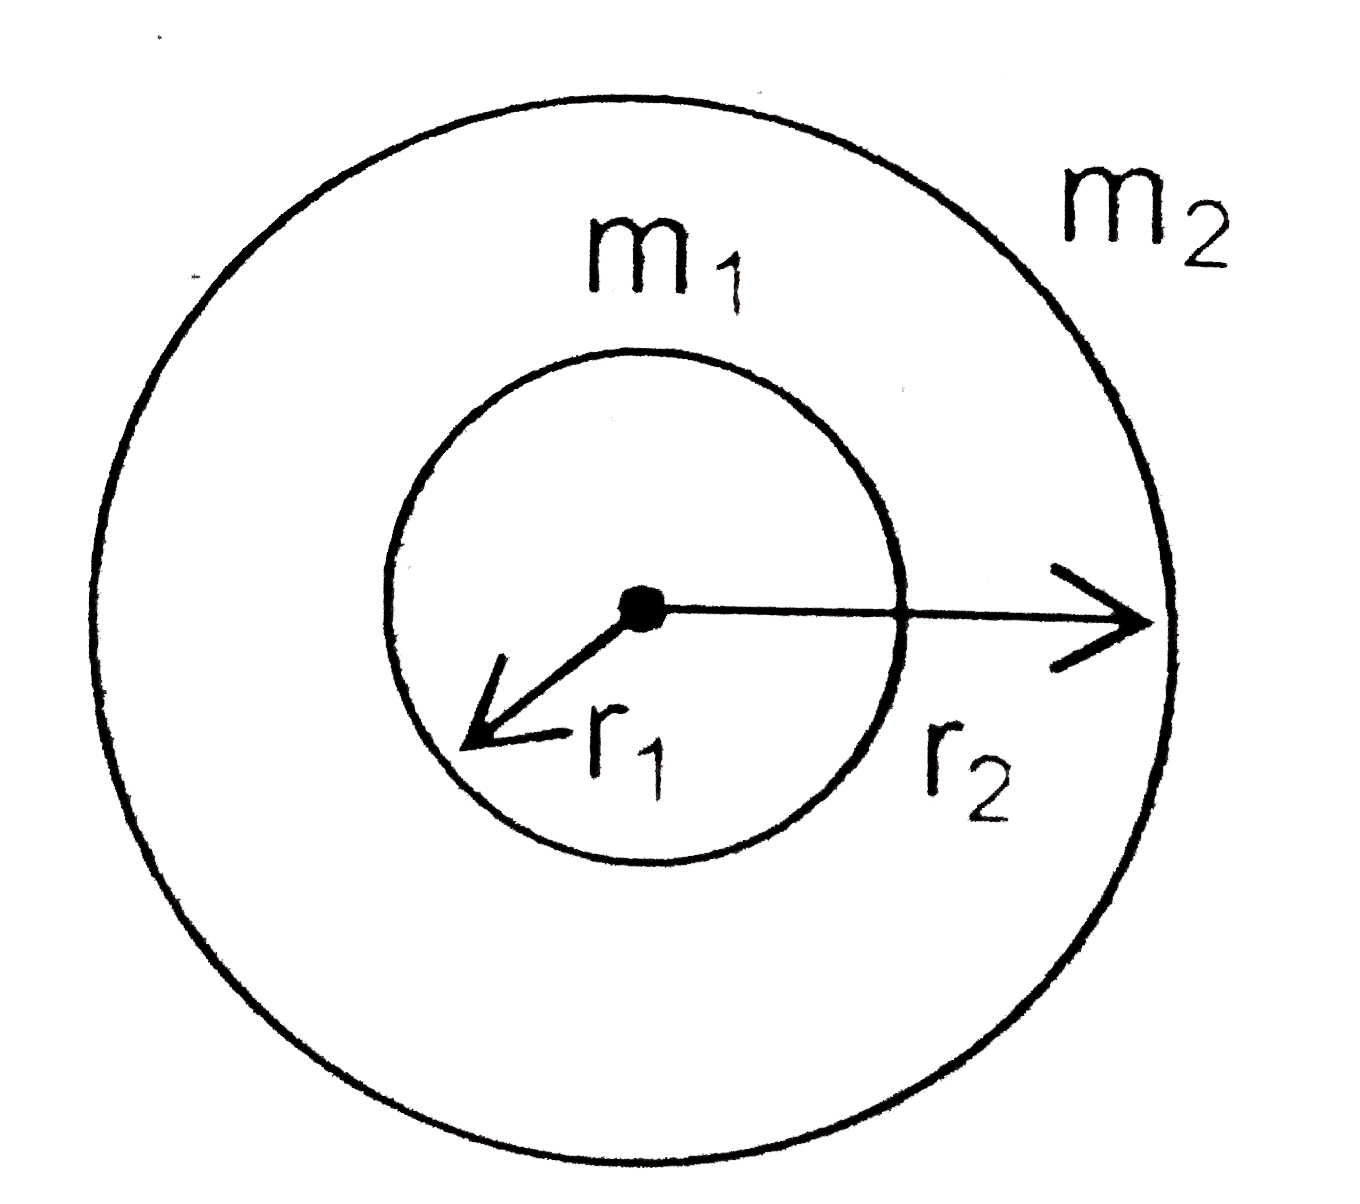
View SolutionTwo wires of equal length and cross-section area suspended as shown in figure. Their Young's modulus are Y1 and Y2 respectively. The equavalent Young's modulus will be
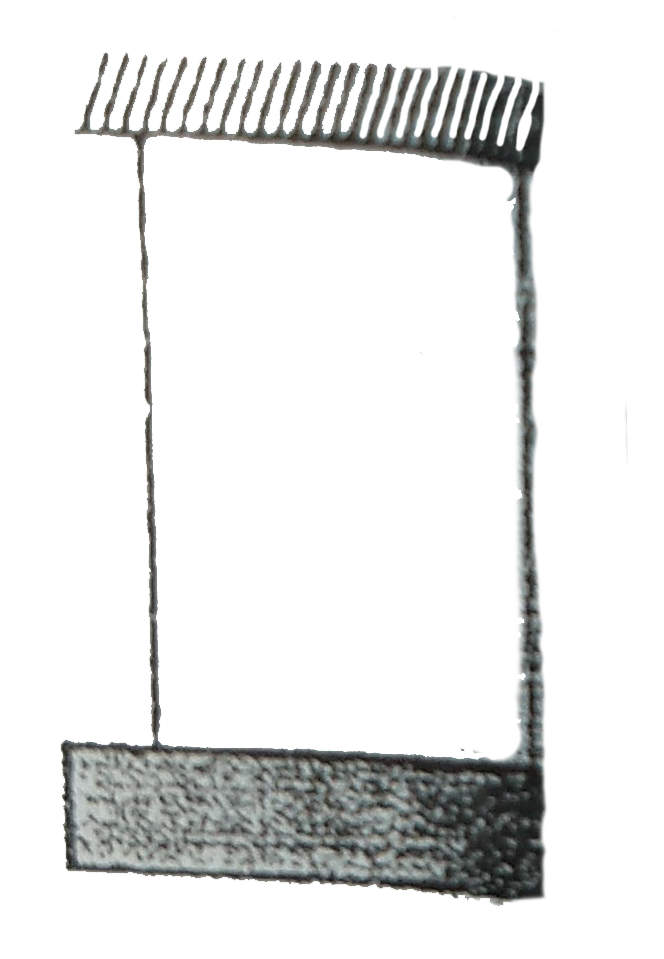
View SolutionWhen a force of 100 N is applied on a wire of uniform cross-section as shown in figure then length of wire is increased by 1 mm. Energy stored in the wire will be

View SolutionA current i passes through a wire of length l , radius of cross-section r and resistivity ρ . The rate of heat generation is
View Solution

