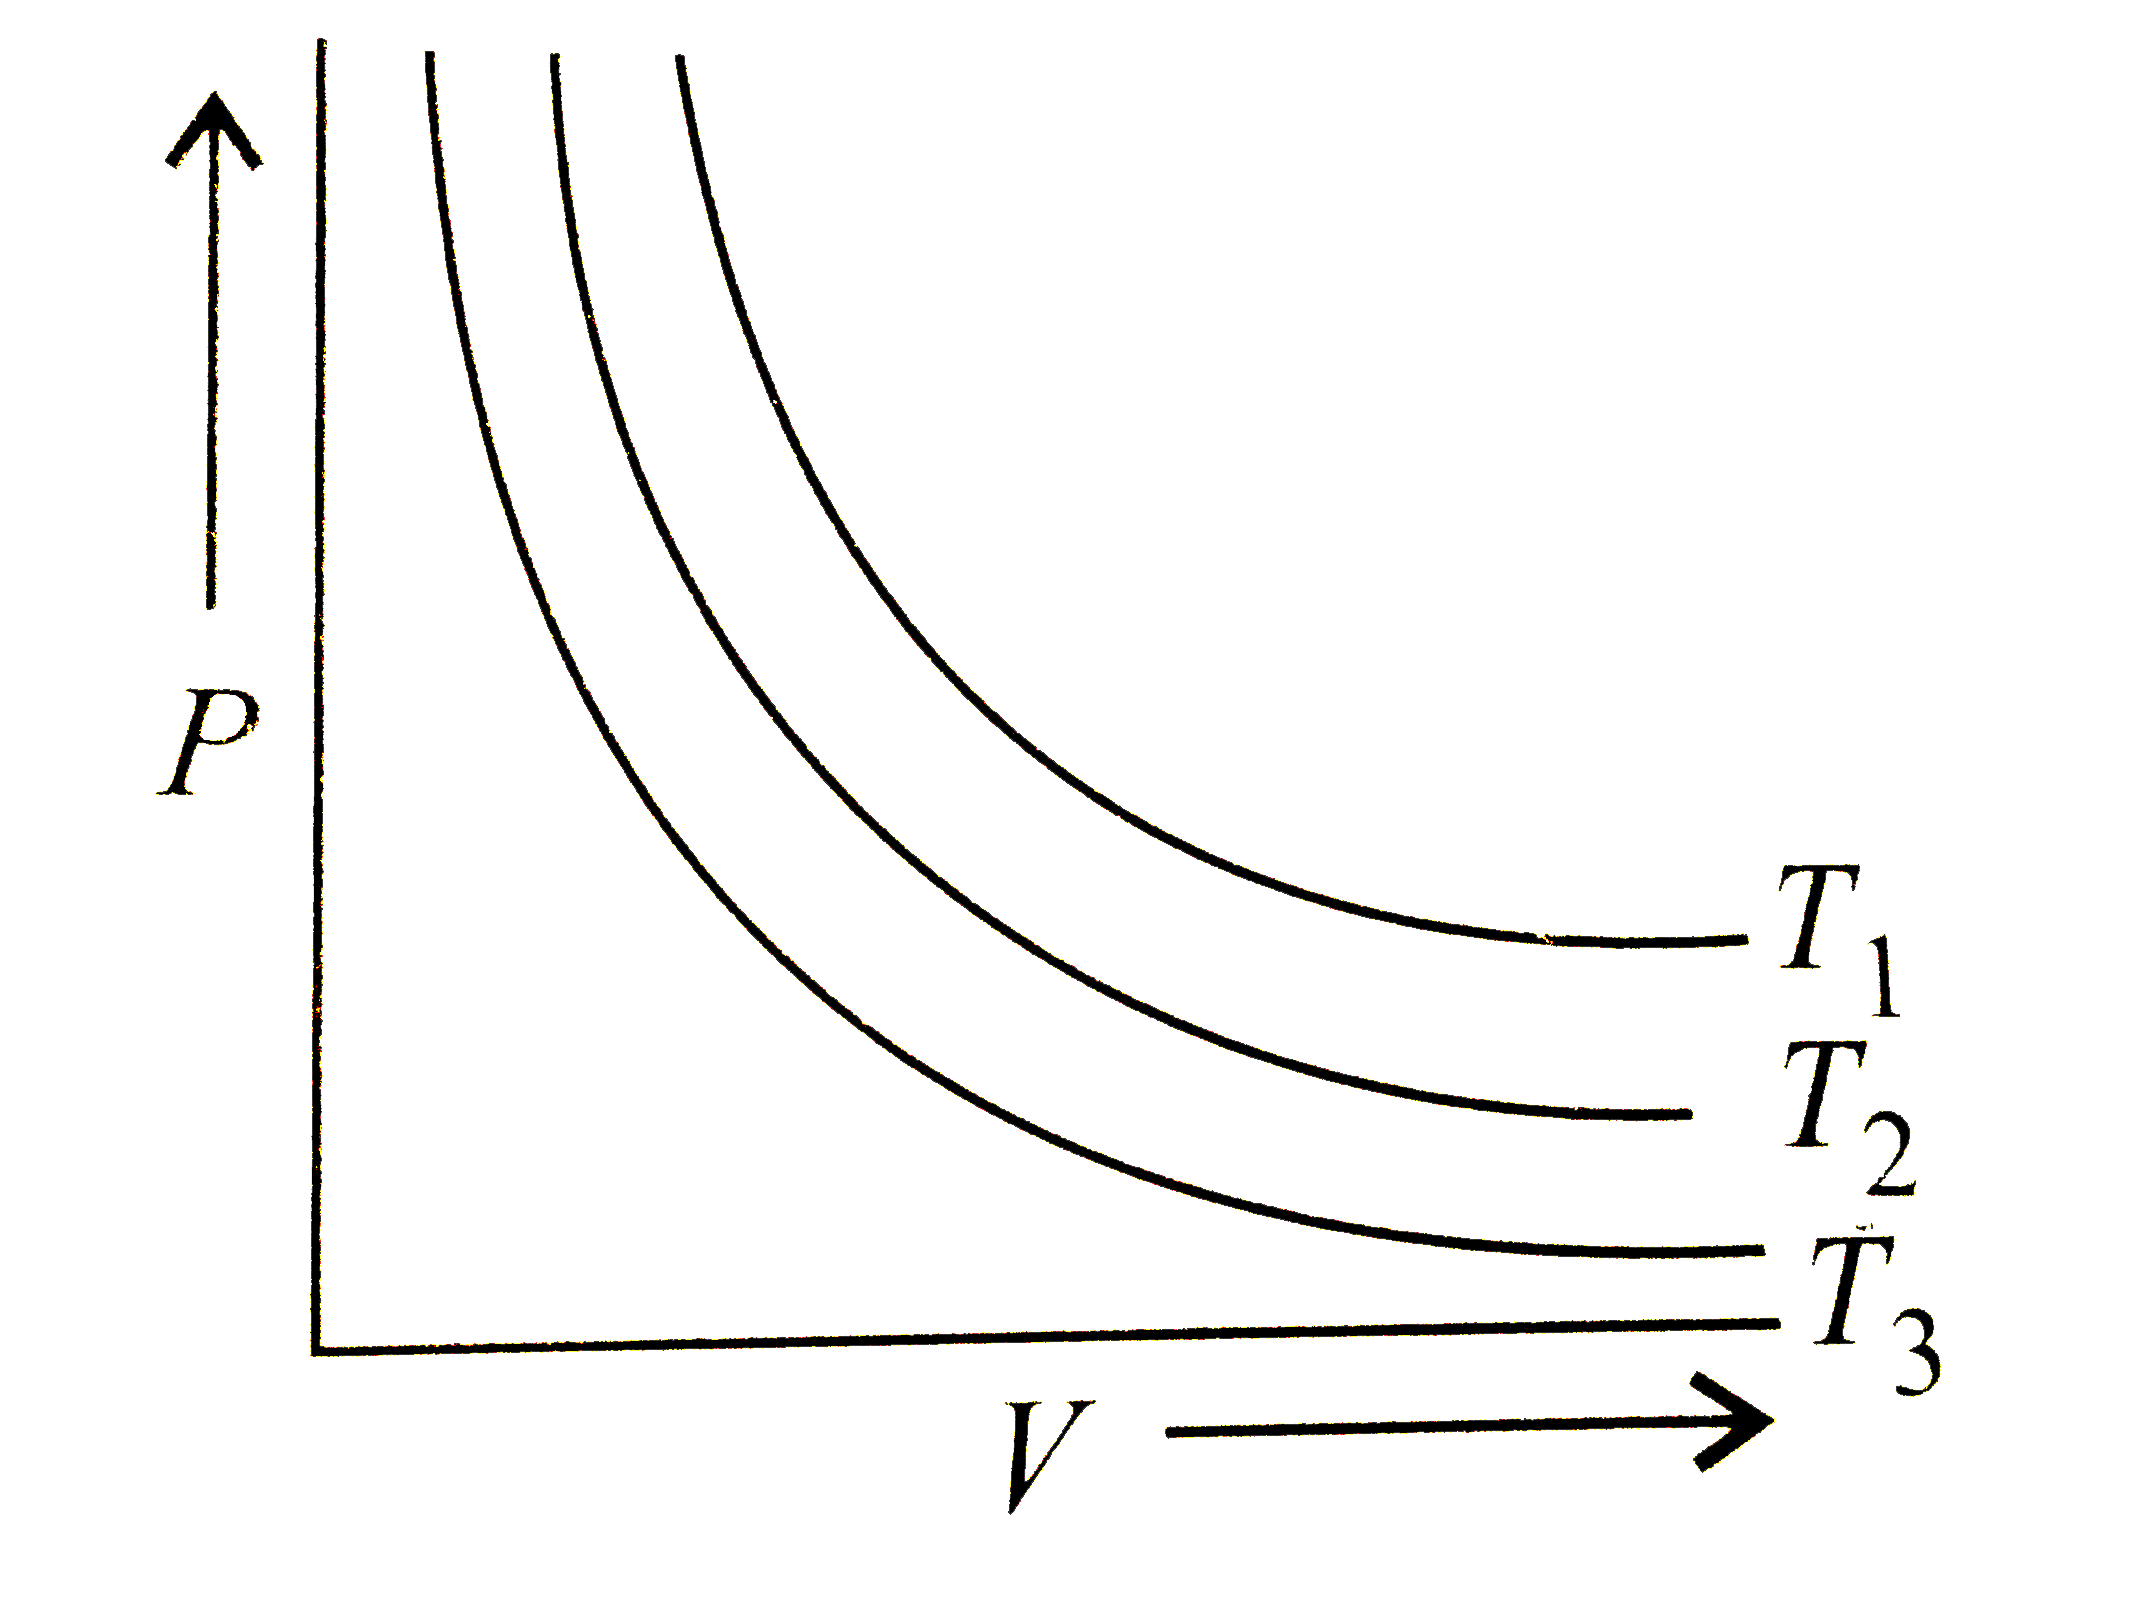
For a conductor, the given Ogure shows the graph of V→ I for different temperatures
then ..... .
T1<T2<T3
T1=T2=T3
T1>T2>T3
T2=T1+T32
The correct Answer is:A
T1<T2<T3

As temperature increases resistance also increases and slope of graph V→ I shows resistance . For T1 temperature ΔVΔI is minimum and for T3 temperature ΔVΔI is maximum.
Topper's Solved these Questions
- CURRENT ELECTRICITYBOOK - KUMAR PRAKASHANCHAPTER - CURRENT ELECTRICITYEXERCISE - SECTION [D] MULTIPLE CHOICE QUESTIONS (MCQs) (MCQs ASKED IN COMPETITIVE EXAMS)
21 Videos
- CURRENT ELECTRICITYBOOK - KUMAR PRAKASHANCHAPTER - CURRENT ELECTRICITYEXERCISE - SECTION [D] MULTIPLE CHOICE QUESTIONS (MCQs) (MCQs ASKED IN CBSE-PMT, AIPMT, NEET)
17 Videos
- CURRENT ELECTRICITYBOOK - KUMAR PRAKASHANCHAPTER - CURRENT ELECTRICITYEXERCISE - SECTION C (LONG ANSWER TYPE QUESTIONS )
5 Videos
- BOARD'S QUESTION PAPER MARCH-2020 BOOK - KUMAR PRAKASHANCHAPTER - BOARD'S QUESTION PAPER MARCH-2020 EXERCISE - PART-B SECTION -C
4 Videos
- DUAL NATURE OF RADIATION AND MATTERBOOK - KUMAR PRAKASHANCHAPTER - DUAL NATURE OF RADIATION AND MATTEREXERCISE - Section-D (MCQs asked in GUJCET/Board Exam)
1 Videos
Similar Questions
Knowledge Check
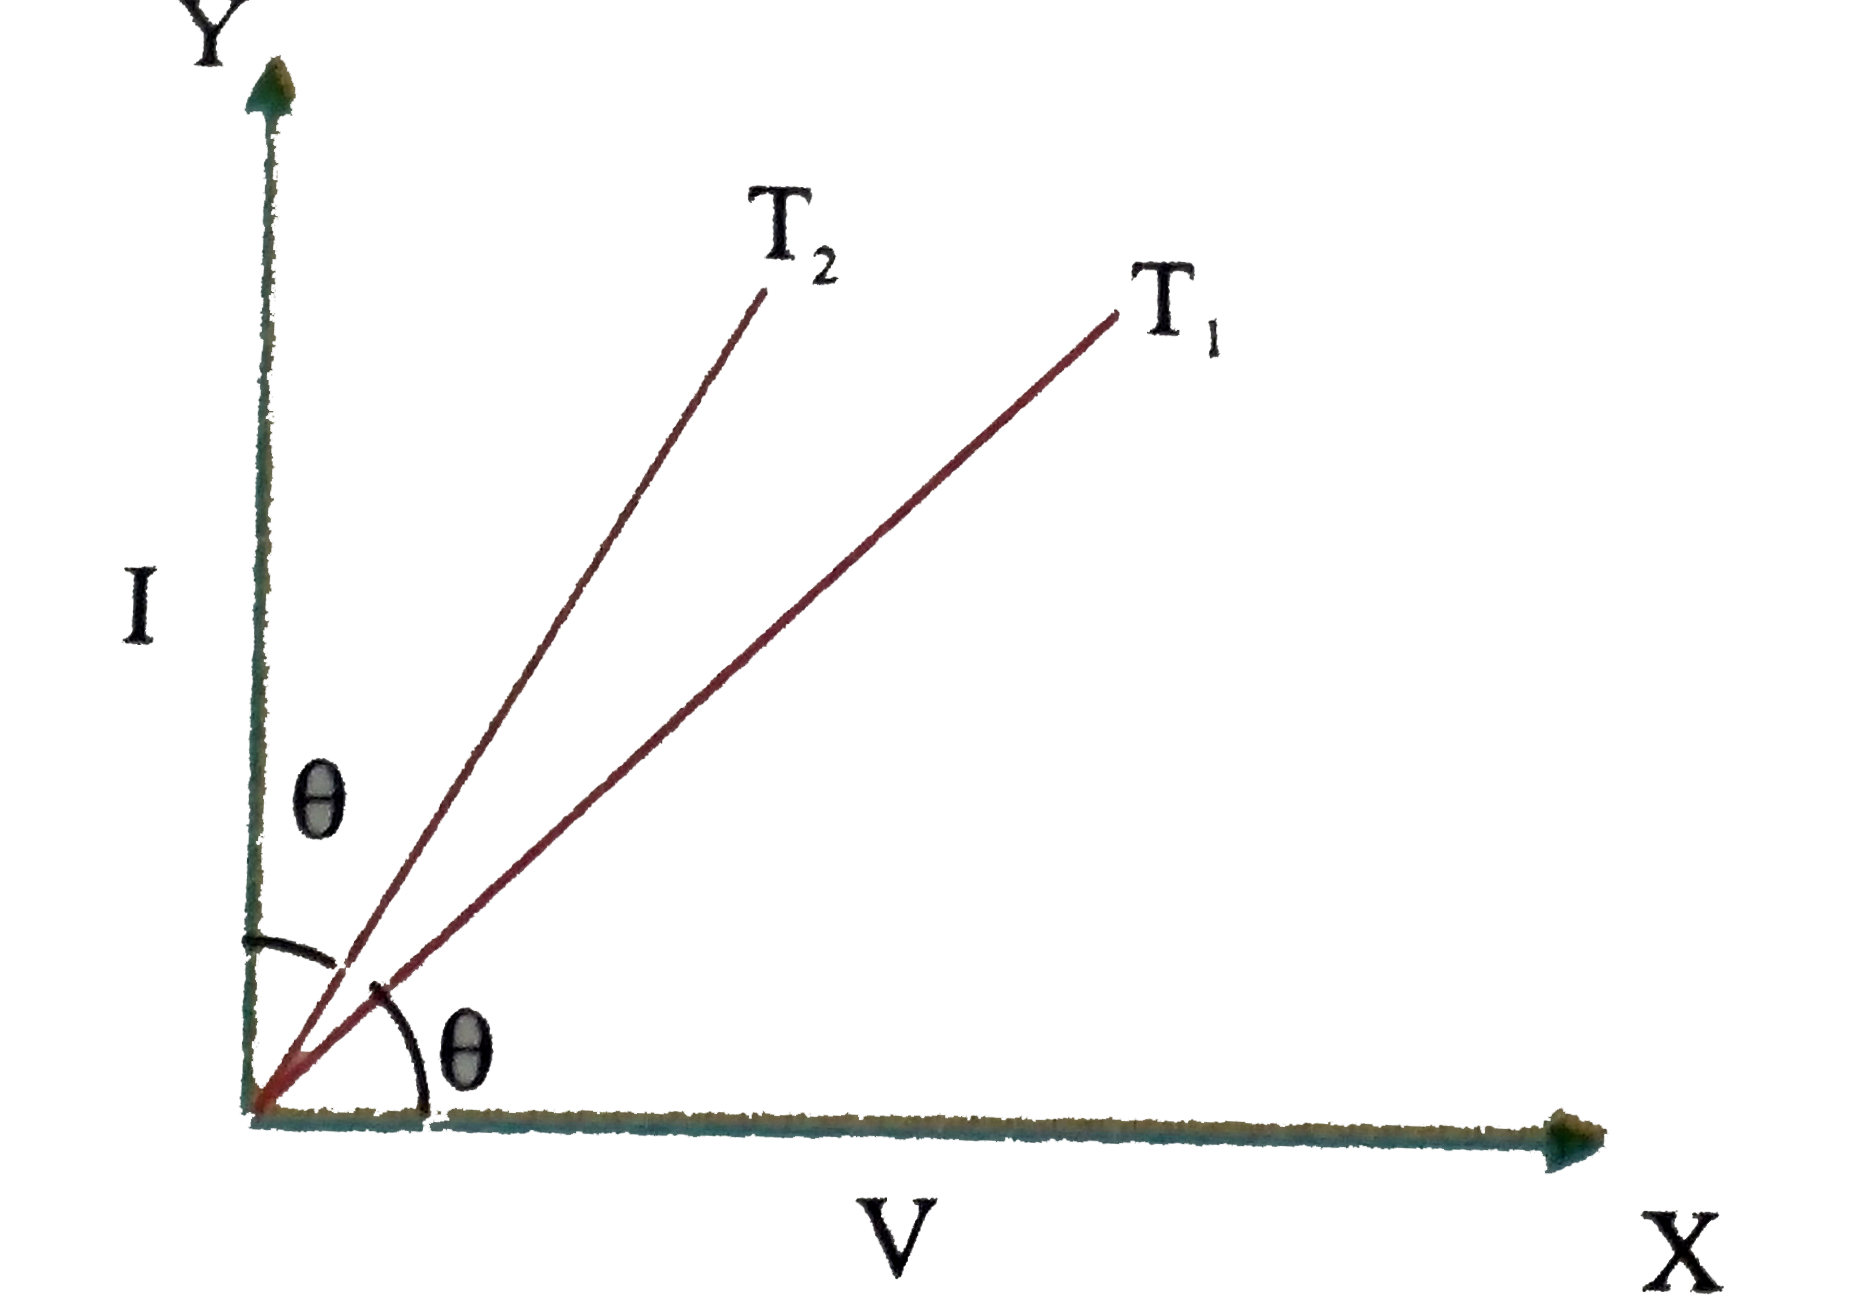
V−I graphs for a material is shown in the figure. The graphs are drawn at two different temperatures.AT1−T2∝cot2θBT1−T2∝sin2θCT1−T2∝tan2θDT1−T2∝cos2θAssertion : Current versus potential difference (i-V) graph for a conductor at two different temperatures T1 and T2 is shown in figure. Hence T1>T2.
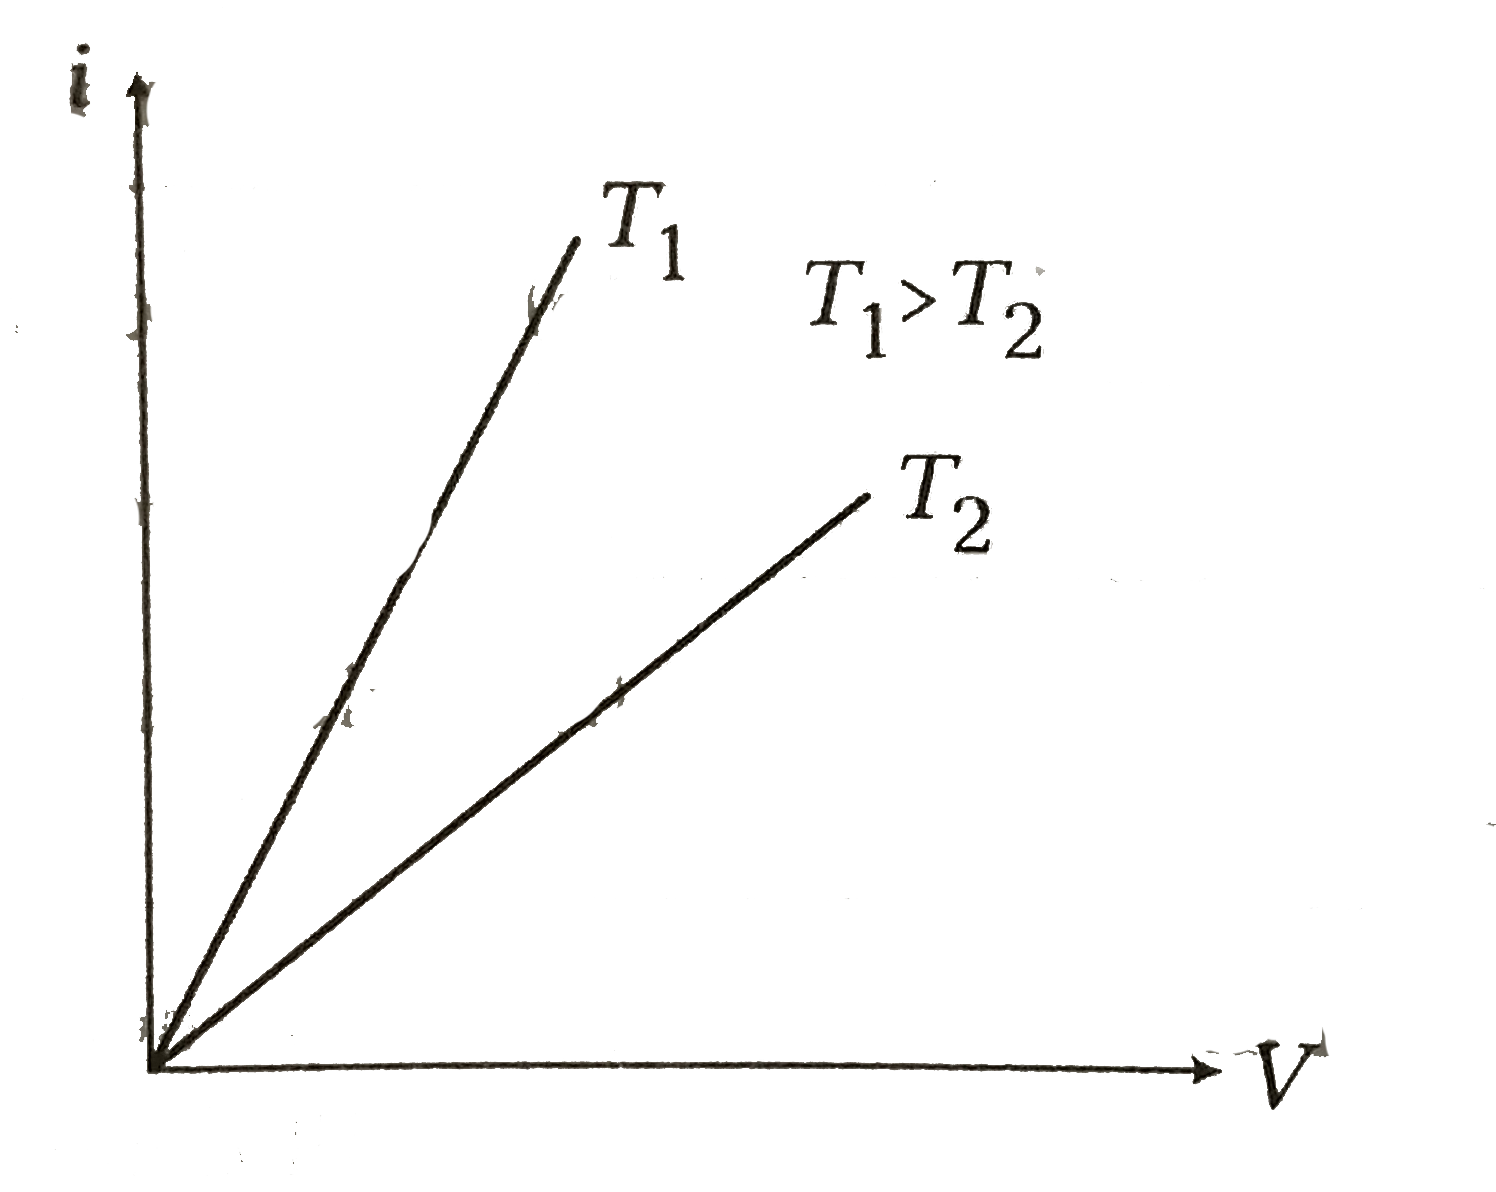
Reason : Resistance of a conductor increases with rise in temperature.AIf both Assertion and Reason are true and Reason is the correct explanation of Assertion.BIf both Assertion and Reason are true and Reason is not correct explanation of Assertion.CIf Assertion is true but Reason is false.DIf Assertion is false but Reason is true.
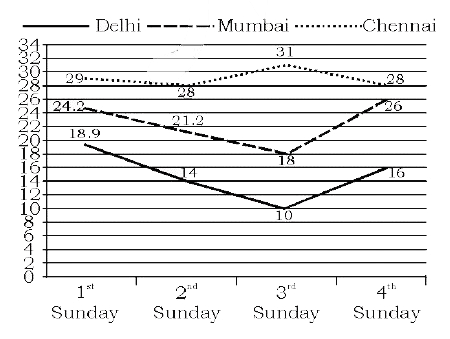
The line graph shows the temperature on four sundays of three cities
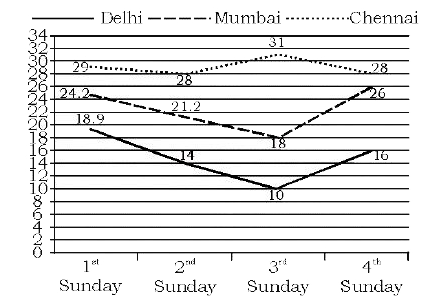
In the given line graph what was the difference in temperature between Delhi and Mumbai on the 2nd Sunday?
View SolutionThe line graph shows the temperature on four Sundays of three cities.
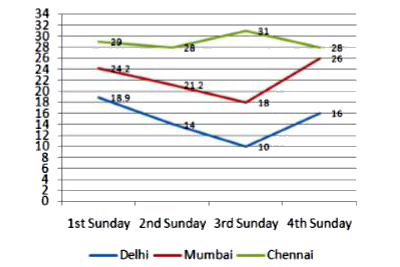
In the given line graph, what was the difference in temperature between Delhi and Mumbai on the 2nd Sunday ?
View SolutionThe line graph shows the temperature on four Sundays of three cities.
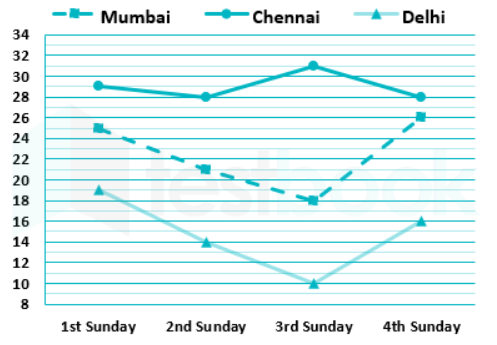
In the given line graph. what was the difference in temperature between Delhi and Chennai on the 3rd Sunday?
View SolutionFor a given metallic conductor , the variation of current through the conductor with potential difference applied across the conductor is shown in the given graph. If temperature of the conductor is increased , then slope tan theta
_PHY_E01_0010_Q01.png)
View SolutionFor a given metallic conductor , the variation of current through the conductor with potential difference applied across the conductor is shown in the given graph. If temperature of the conductor is increased , then slope tan theta
_PHY_E01_0010_Q01.png)
View SolutionAssertion : Current versus potential difference (i-V) graph for a conductor at two different temperatures T1 and T2 is shown in figure. Hence T1>T2.

Reason : Resistance of a conductor increases with rise in temperature.
View Solution

