For a simple pendulum the graph between length and time period will be
Hyperbola
Parabola
A curved line
A straight line
The correct Answer is:B
Step by step video, text & image solution for For a simple pendulum the graph between length and time period will be by Physics experts to help you in doubts & scoring excellent marks in Class 11 exams.
Updated on:21/07/2023Topper's Solved these Questions
- SIMPLE HARMONIC MOTIONBook:ERRORLESS Chapter:SIMPLE HARMONIC MOTIONExercise:Assertion & Reason
Explore 23 Videos
- SIMPLE HARMONIC MOTIONBook:ERRORLESS Chapter:SIMPLE HARMONIC MOTIONExercise:simple Harmonic Motion
Explore 21 Videos
- SIMPLE HARMONIC MOTIONBook:ERRORLESS Chapter:SIMPLE HARMONIC MOTIONExercise:Superposition of S.H. M and Resonance
Explore 14 Videos
- ROTATIONAL MOTIONBook:ERRORLESS Chapter:ROTATIONAL MOTIONExercise:Practice Problems (Problems based on motion of connected mass)
Explore 10 Videos
- SURFACE TENSIONBook:ERRORLESS Chapter:SURFACE TENSIONExercise:Exercise
Explore 214 Videos
Similar Questions
Knowledge Check
For a simple pendulum, the graph between T2andL (where T is the time period & Lis the length) is
Astraight line passing through originBparabolicCcircleDnone of the aboveIn an experiment , to find the loss of energy with respect to time in case of swinging simple pendulum , the graph between (amplitude)2 and time is
A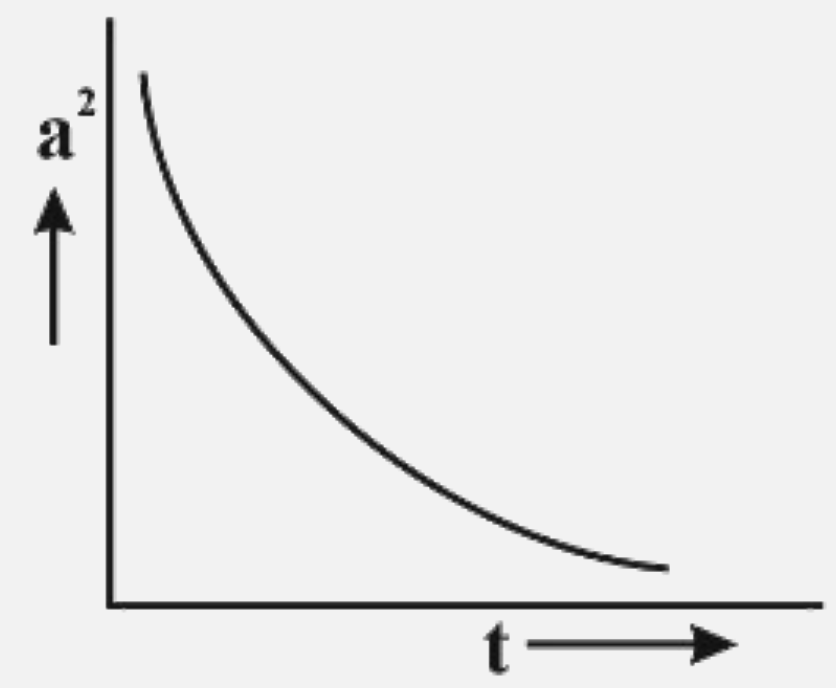 B
B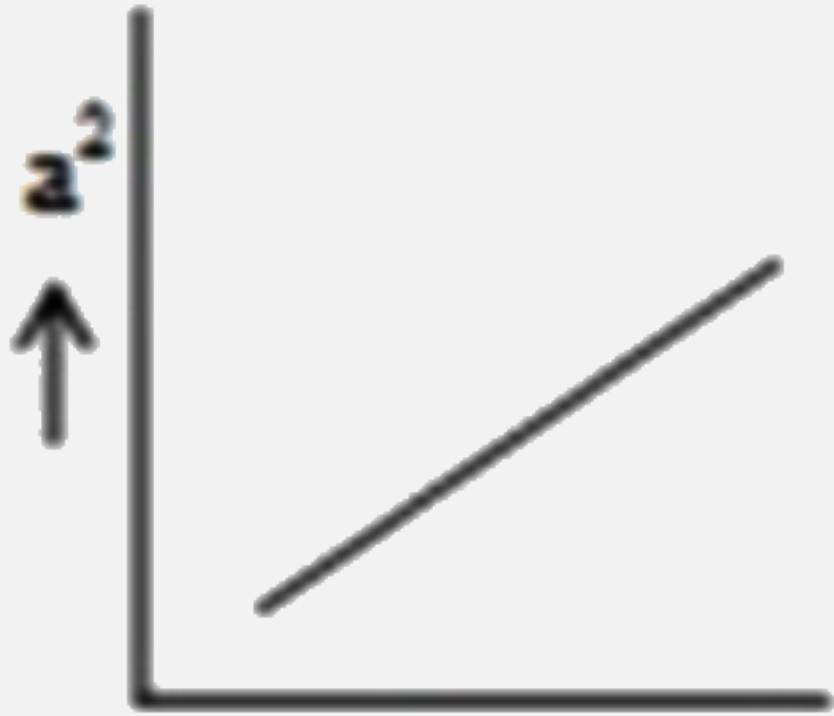 C
C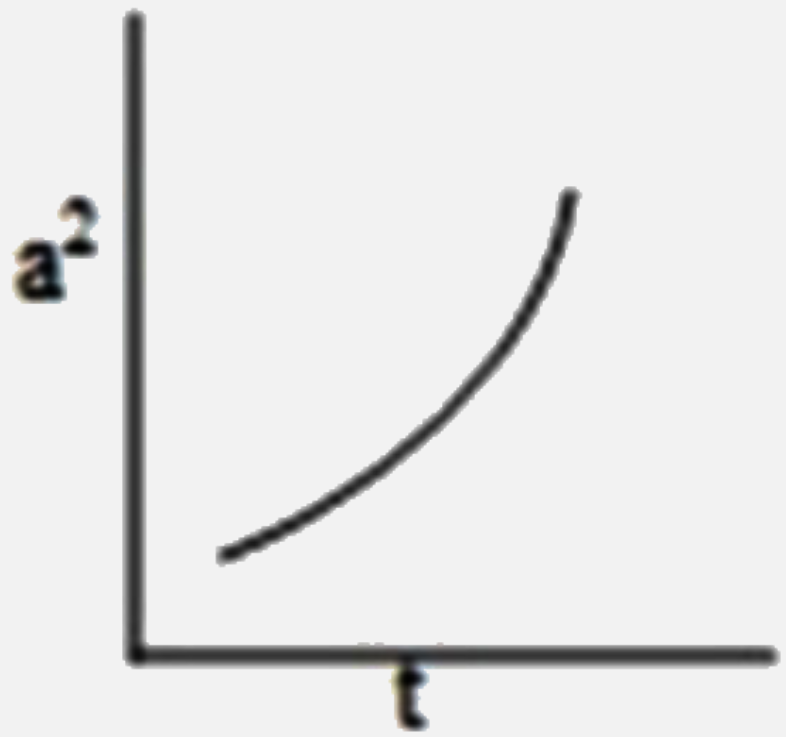 D
D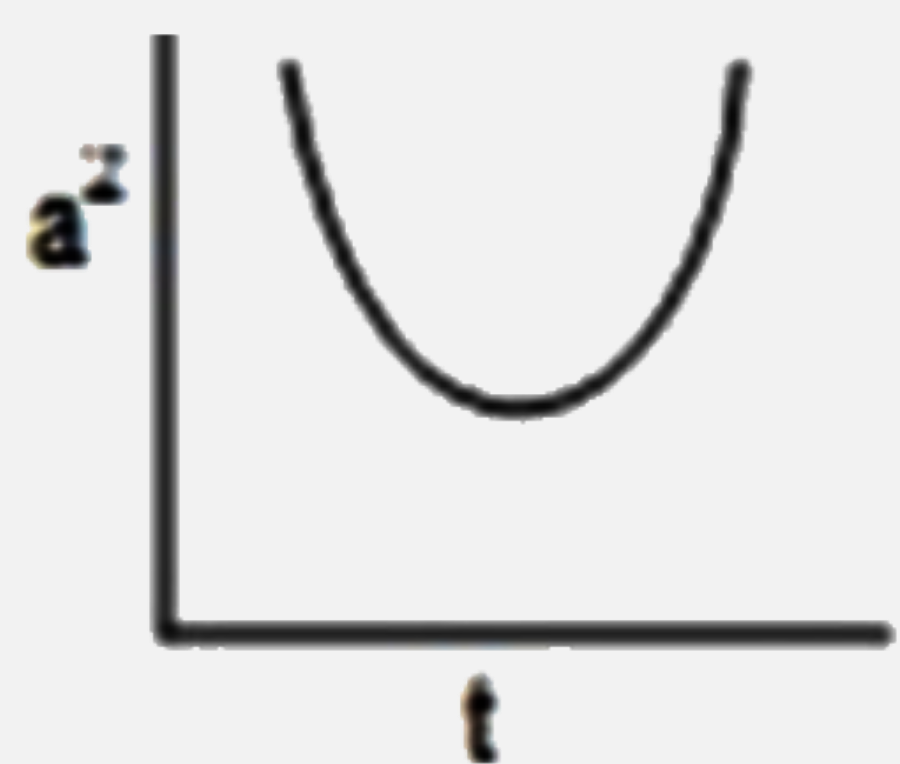
If the length of simple pendulum is increased by 300%, then the time period will be increased b
A1B2C3D4
In the case of a simple pendulum, a graph is drawn between the displacement and time taken for its oscillations as shown in the figure. Then
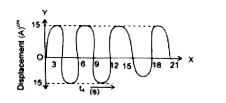
Time period of the pendulum bob is ______ s.
View SolutionIf the length of a simple pendulum is increased by 2%, then the time period
View SolutionIf the length of a simple pendulum is increased by 2%, then the time period
View SolutionIf the length of a simple pendulum is doubled then the % change in the time period is :
View SolutionTo study the dissipations of the energy of a simple pendulum, student plots a graph between square root of time and amplitude . The graph would be a
View Solution
