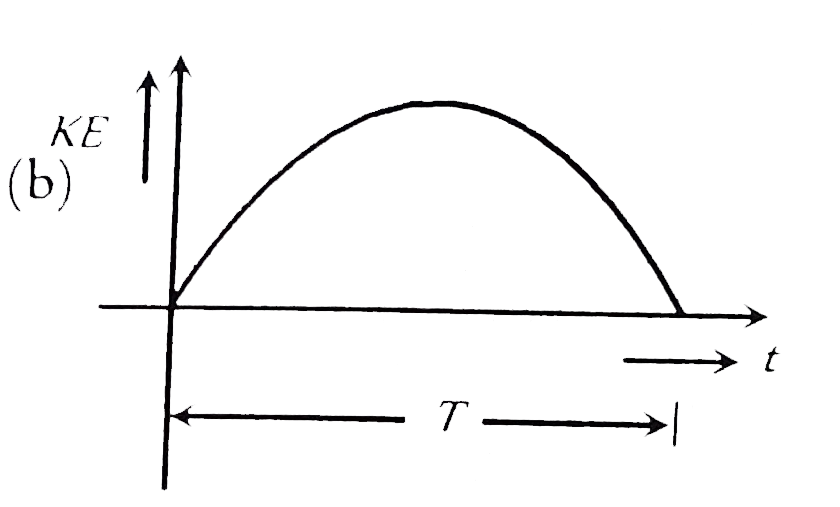
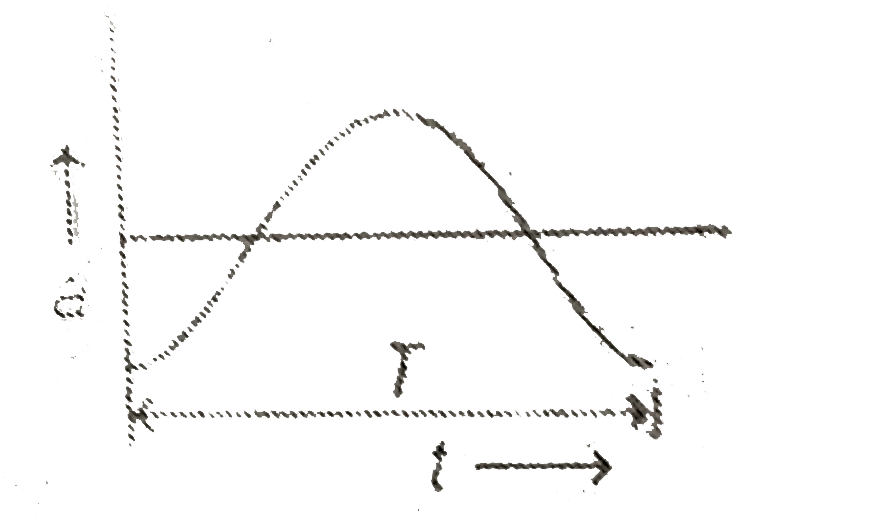
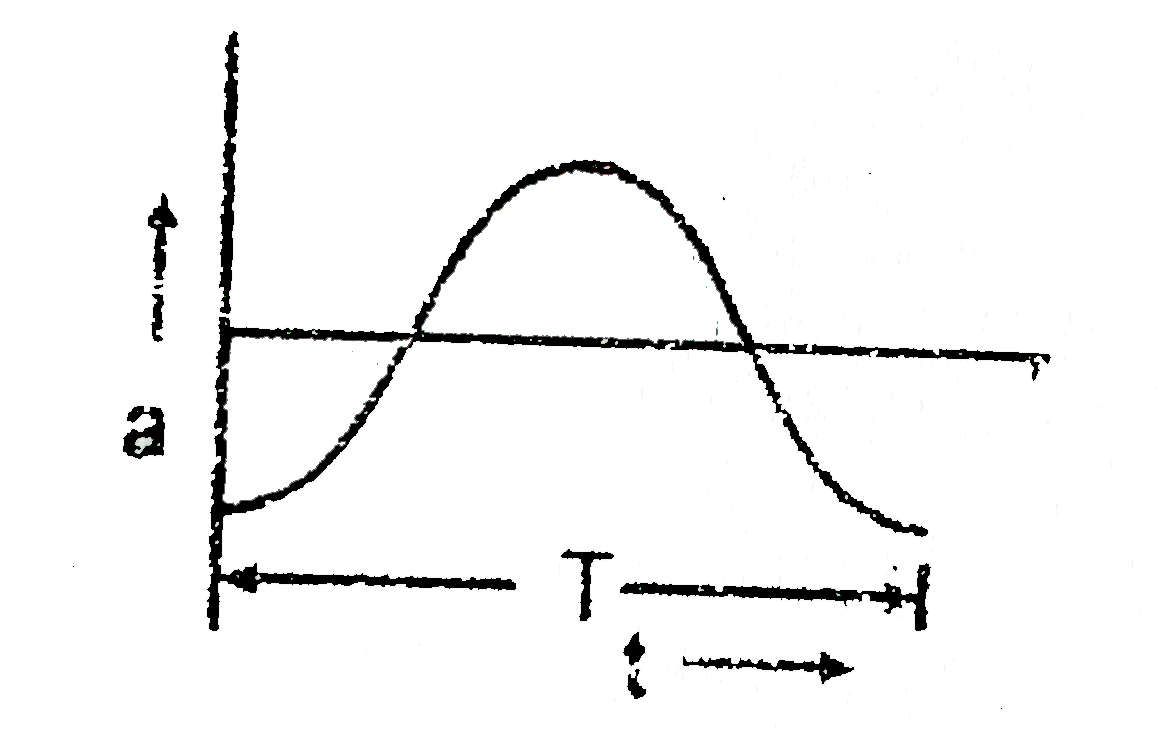
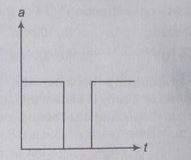
Acceleration A and time period T of a body in S.H.M. is given by a curve shown below. Then corresponding graph, between kinetic energy (K.E.) and time t is correctly represented by 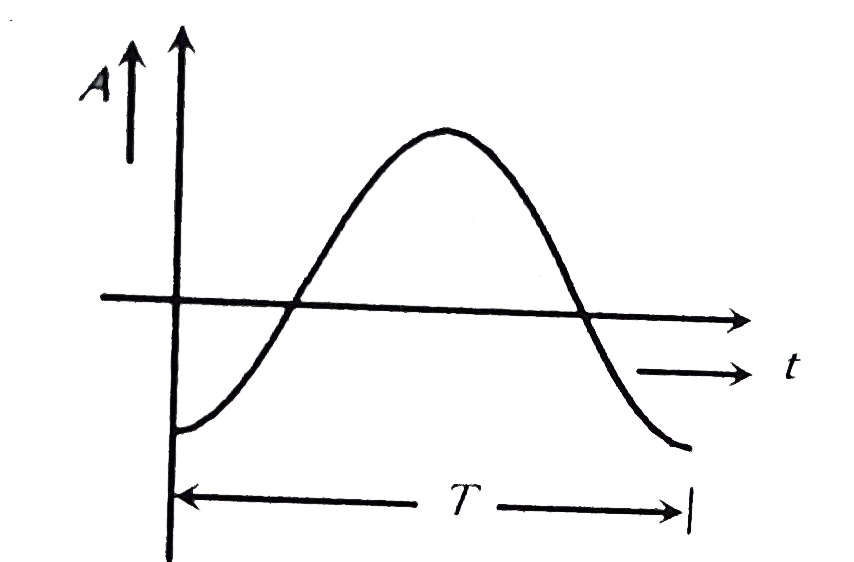
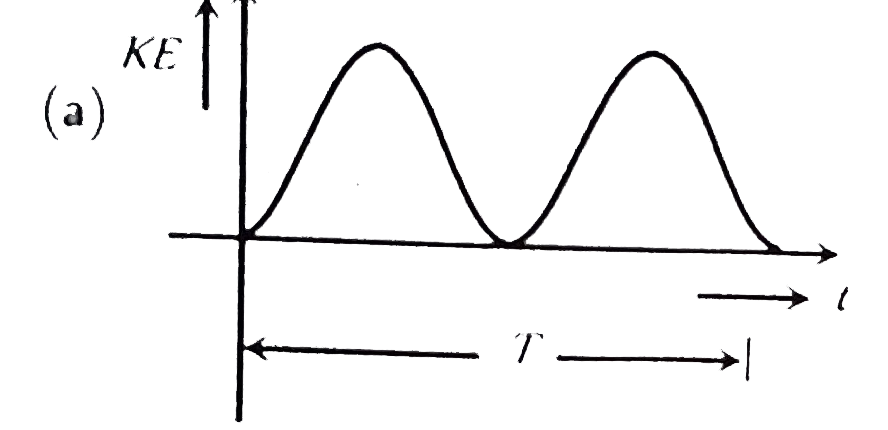
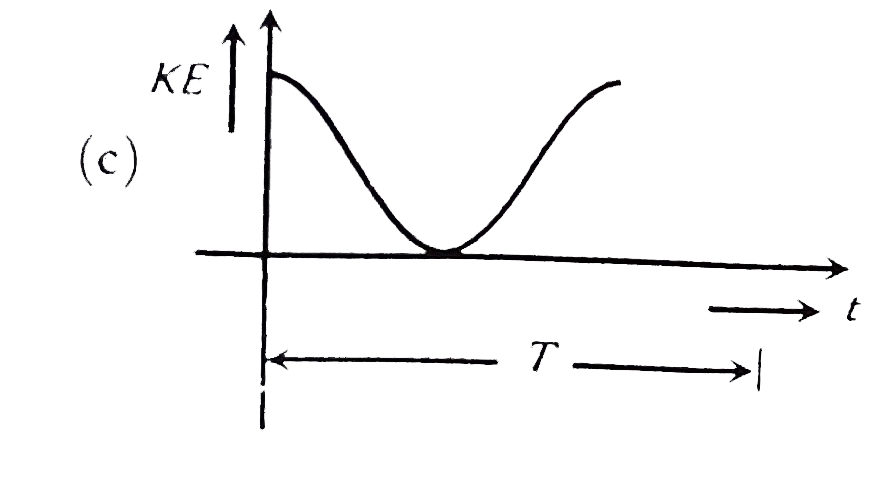
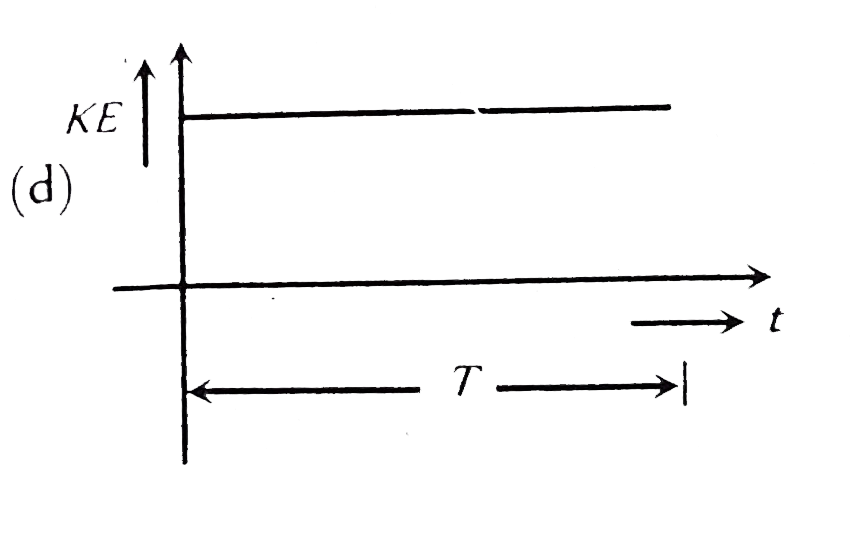
The correct Answer is:A
Step by step video, text & image solution for Acceleration A and time period T of a body in S.H.M. is given by a curve shown below. Then corresponding graph, between kinetic energy (K.E.) and time t is correctly represented by by Physics experts to help you in doubts & scoring excellent marks in Class 11 exams.
Updated on:21/07/2023Topper's Solved these Questions
- SIMPLE HARMONIC MOTIONBOOK - ERRORLESS CHAPTER - SIMPLE HARMONIC MOTIONEXERCISE - Assertion & Reason
23 Videos
- SIMPLE HARMONIC MOTIONBOOK - ERRORLESS CHAPTER - SIMPLE HARMONIC MOTIONEXERCISE - simple Harmonic Motion
21 Videos
- SIMPLE HARMONIC MOTIONBOOK - ERRORLESS CHAPTER - SIMPLE HARMONIC MOTIONEXERCISE - Superposition of S.H. M and Resonance
14 Videos
- ROTATIONAL MOTIONBOOK - ERRORLESS CHAPTER - ROTATIONAL MOTIONEXERCISE - Practice Problems (Problems based on motion of connected mass)
10 Videos
- SURFACE TENSIONBOOK - ERRORLESS CHAPTER - SURFACE TENSIONEXERCISE - Exercise
214 Videos
Similar Questions
Knowledge Check
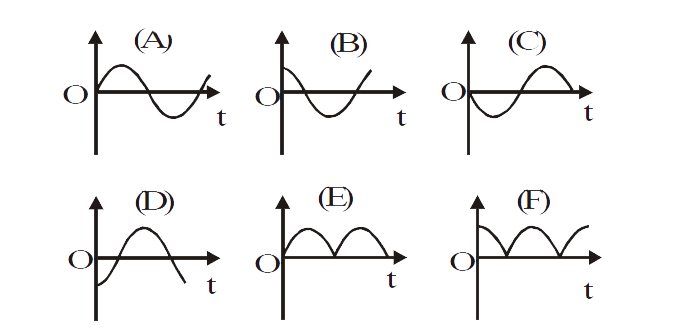
Acceleration versus time graph of a body in SHM is given by a curve shown below. T is the time period. Then corresponding graph between kinetic energy KE and time t is correctly represented by
 A
A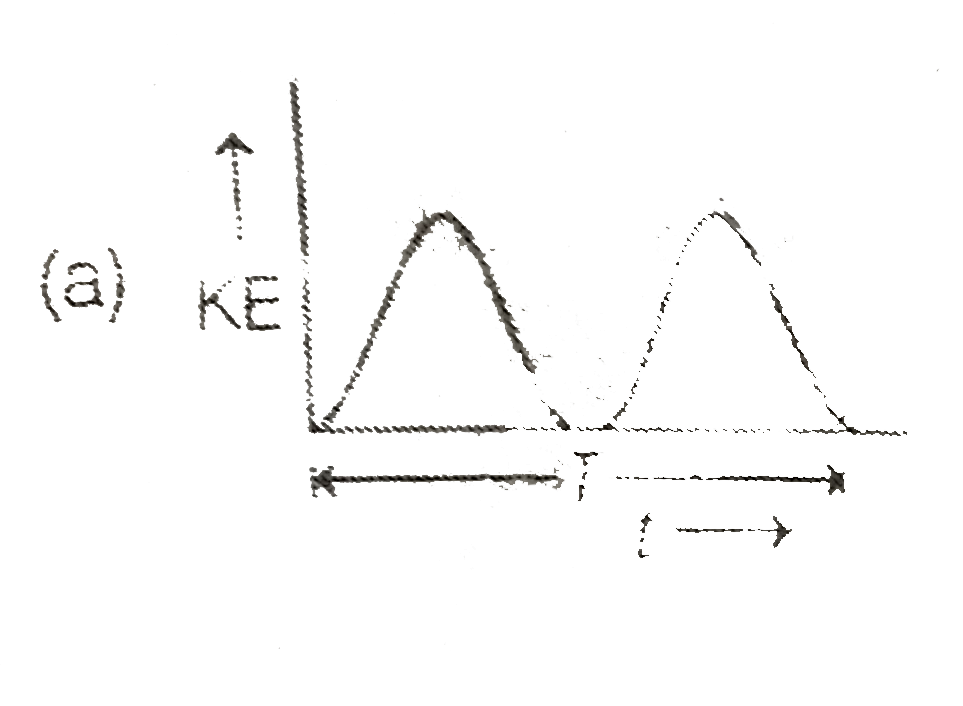 B
B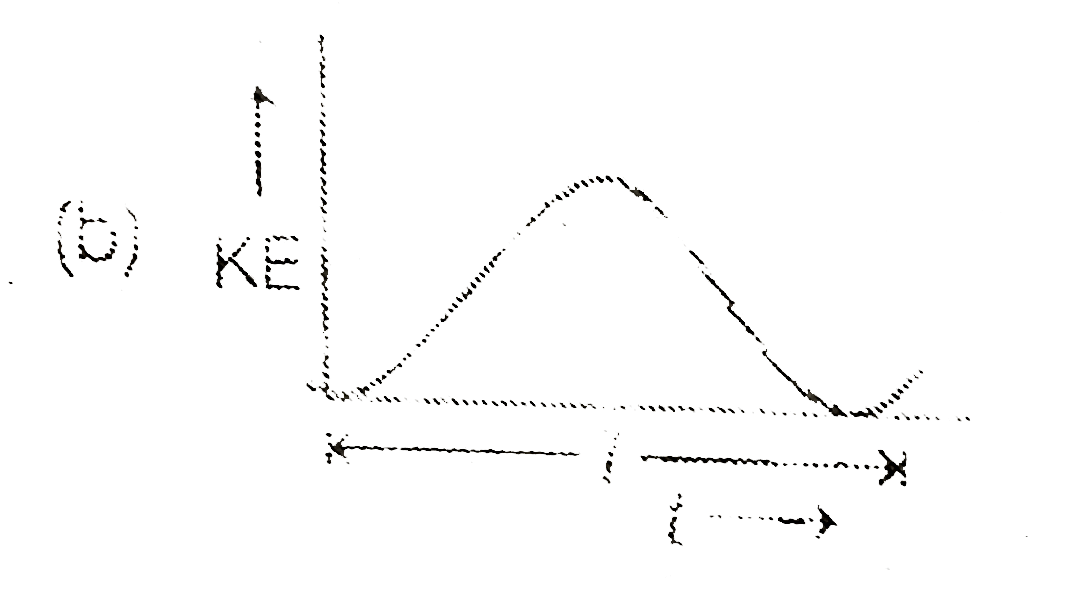 C
C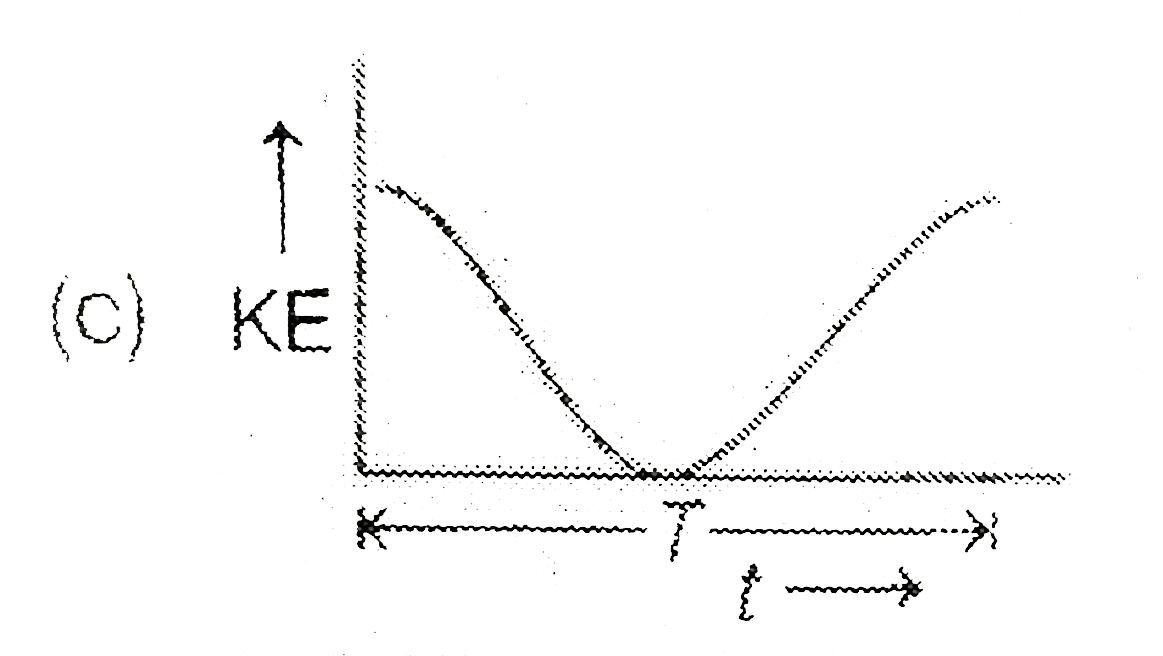 D
D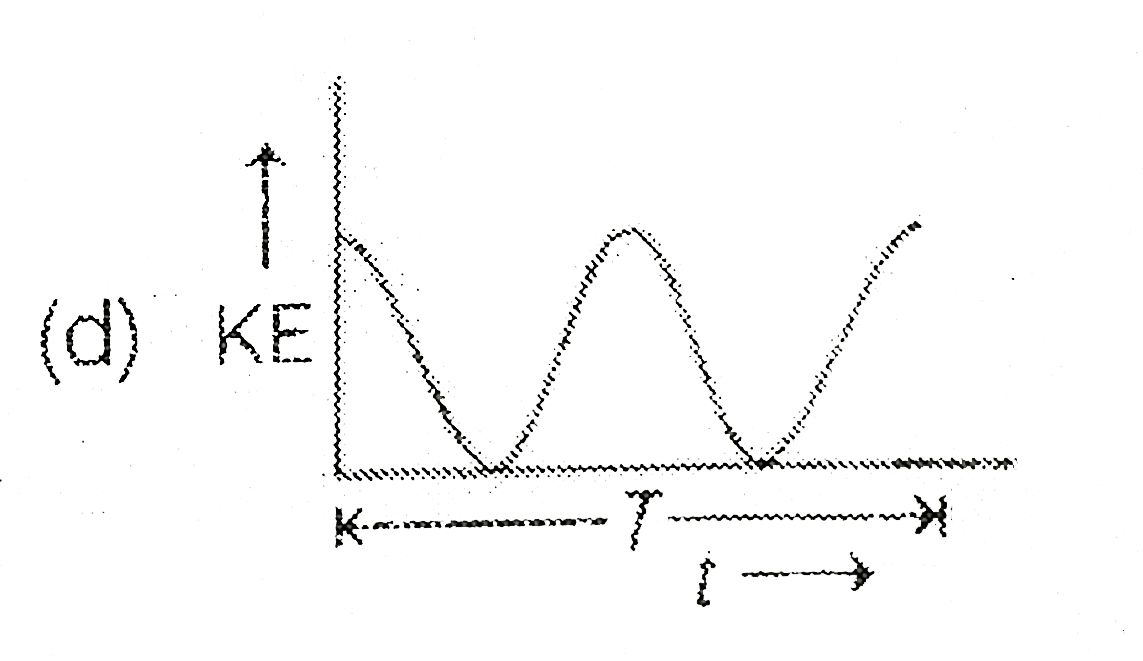
Acceleration a versus time t graph of a body in SHM is given by a curve shown below. T is the time period Then corresponding graph between kinetic energy KE and time t is correctly represented by
 A
A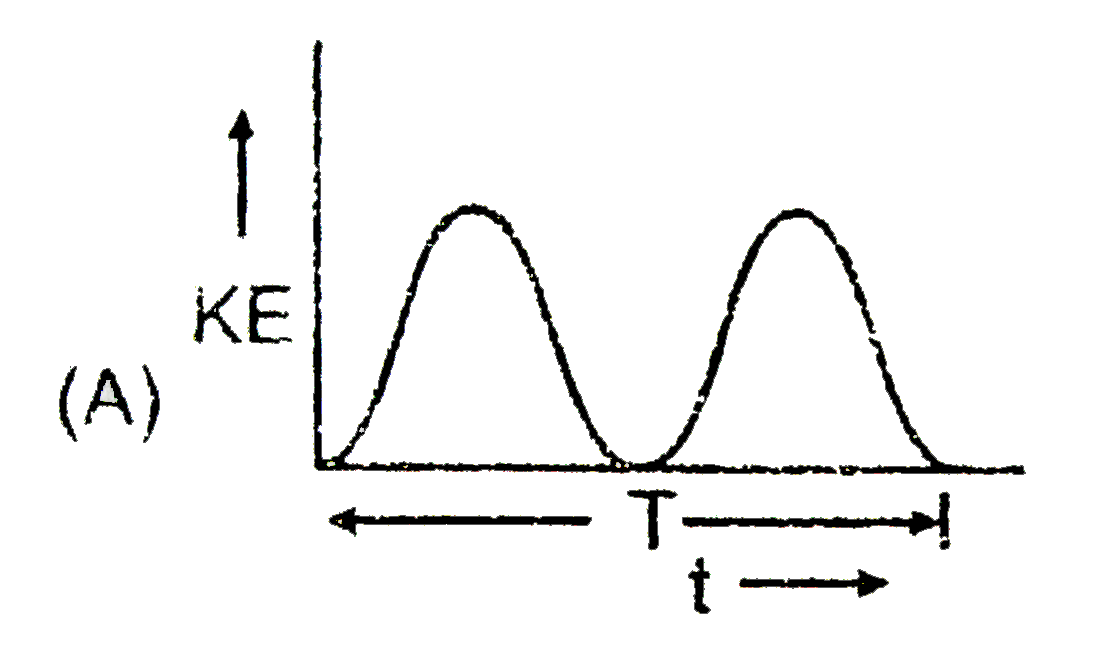 B
B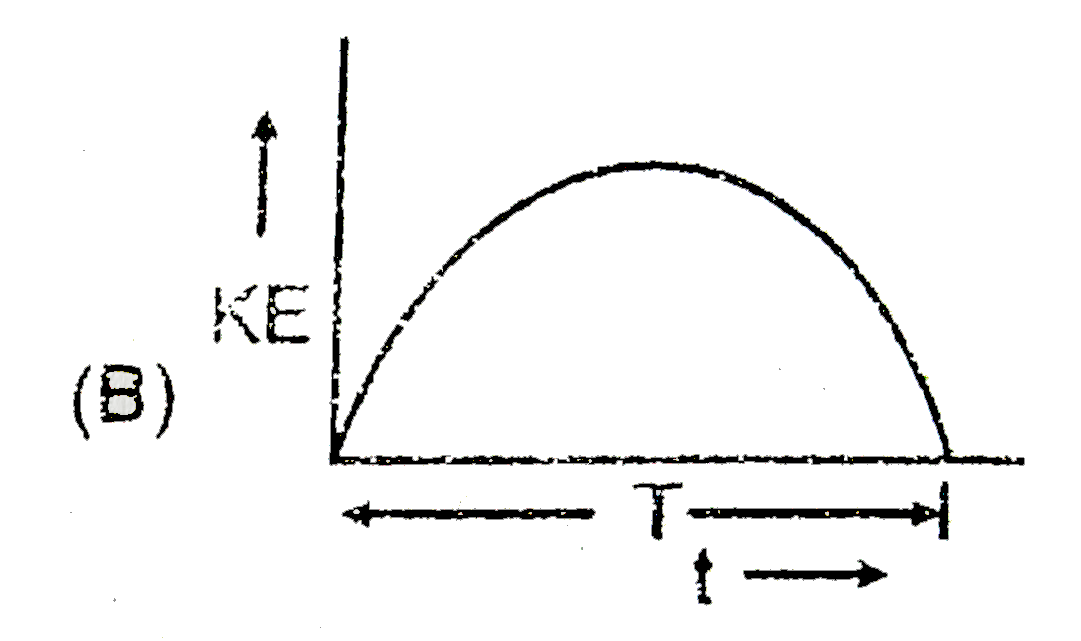 C
C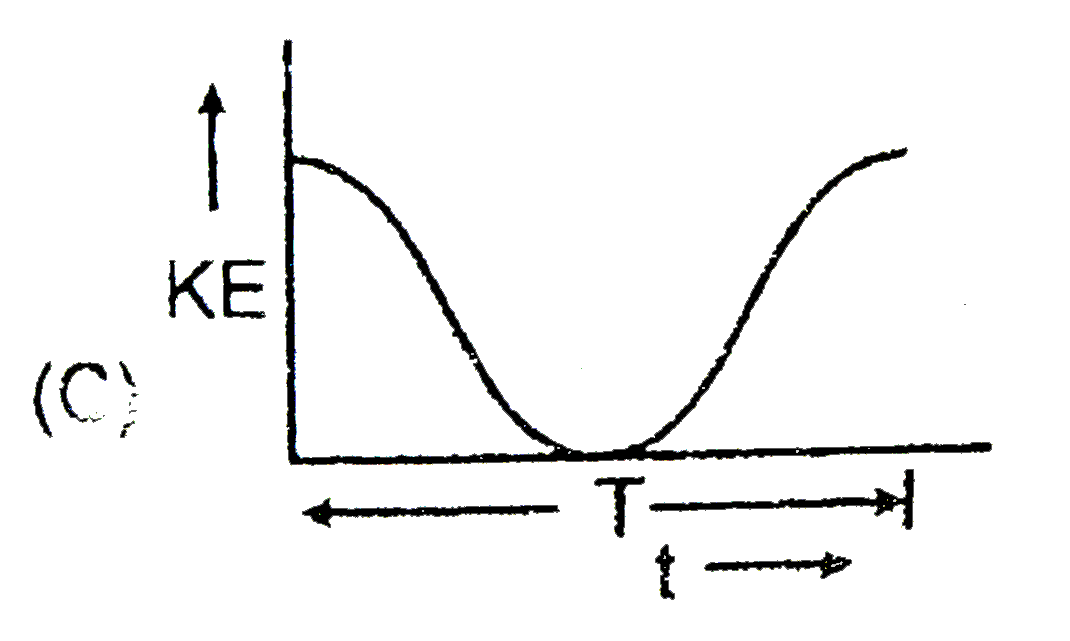 D
D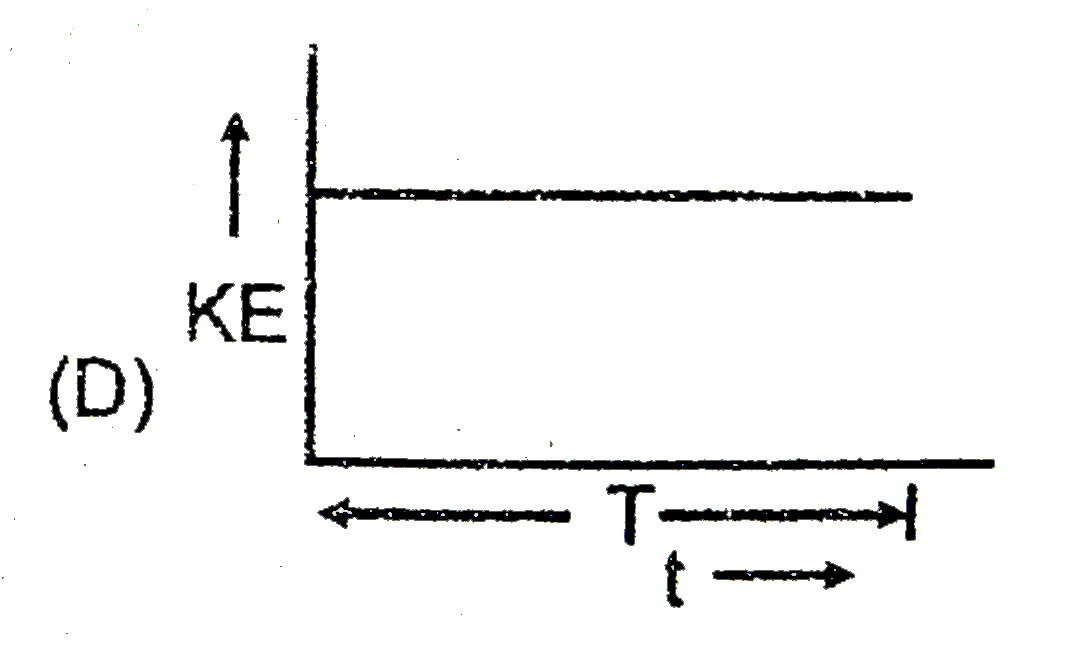
In S.H.M., the graph between kinetic energy K and time 't' is
A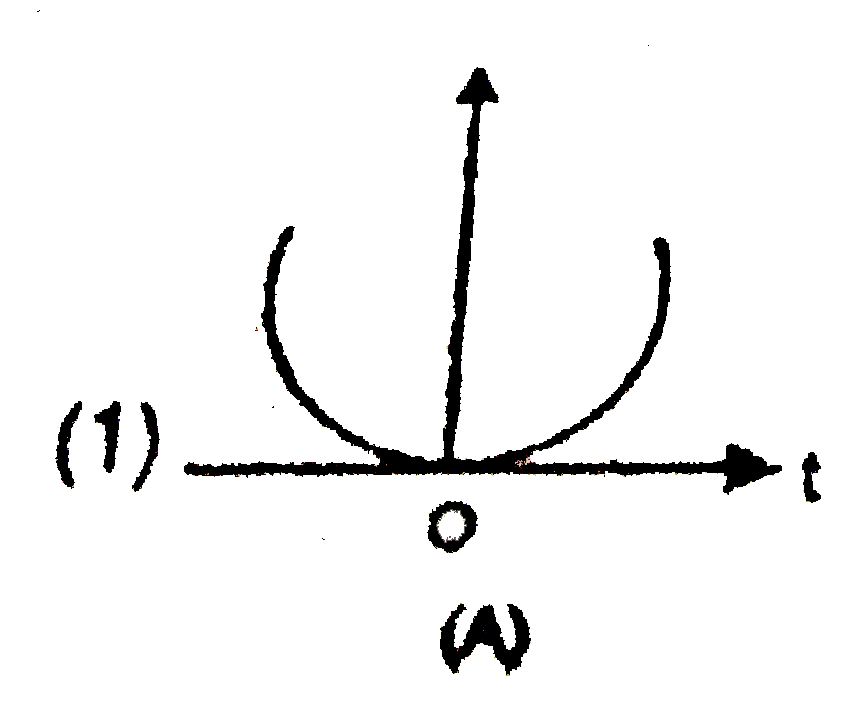 B
B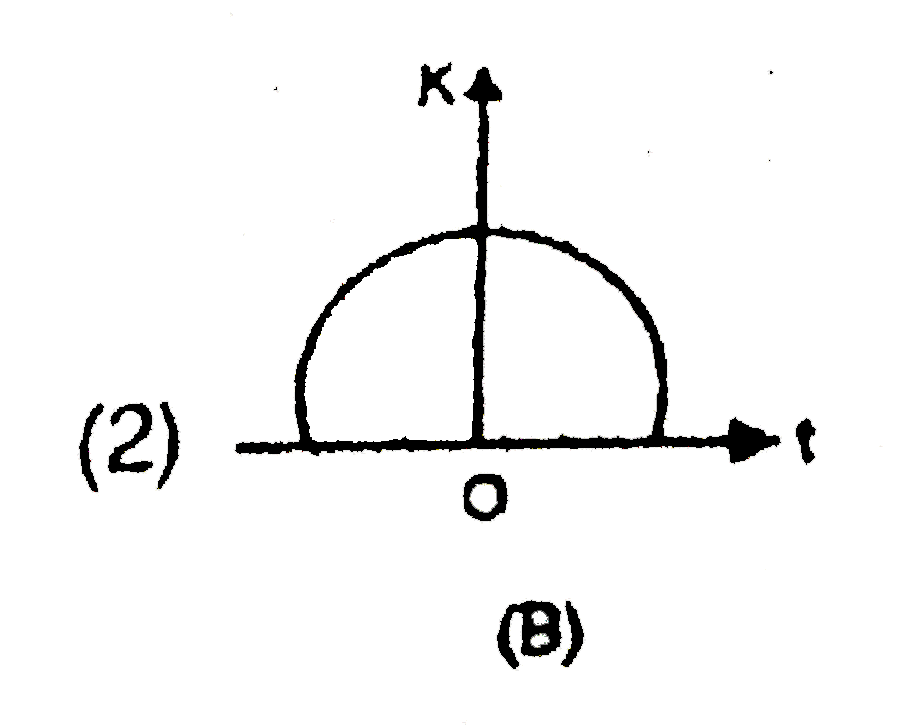 C
C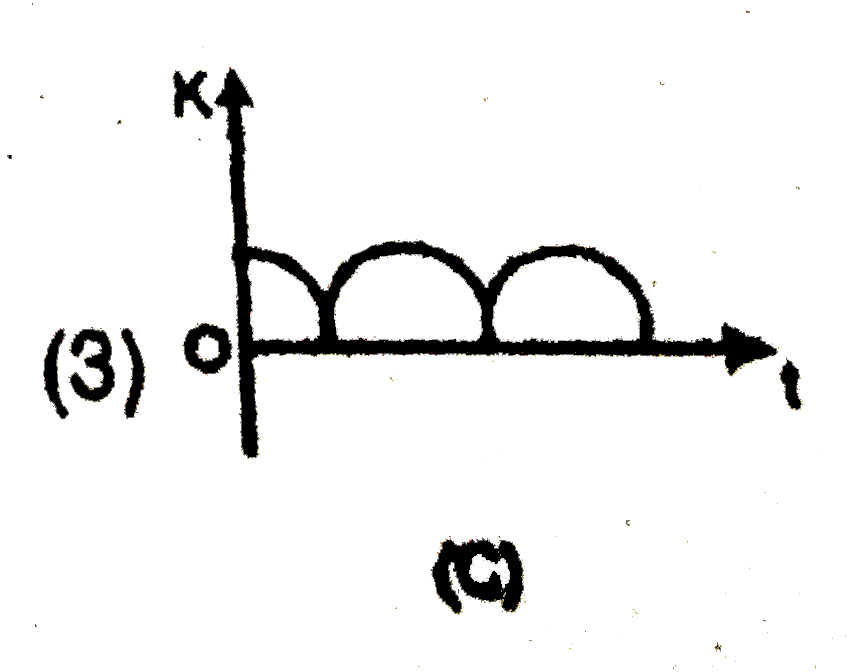 D
D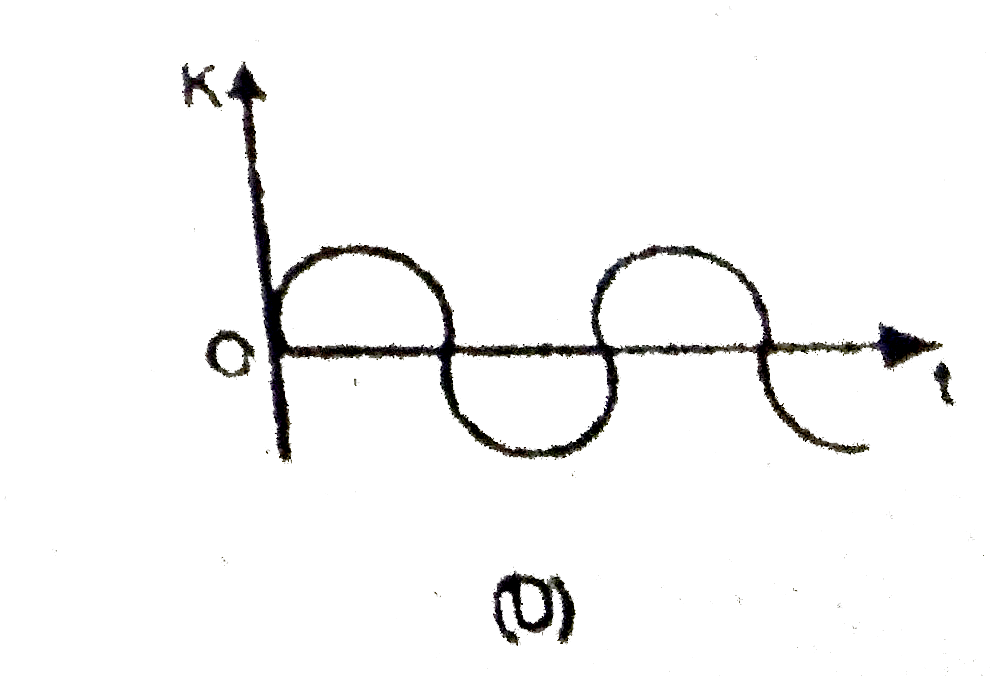
The graph between kinetic energy and displacement of a particle performing S.H.M. is
View SolutionAcceleration time graph of a body is shown below the corresponding velocity time graph of the same body is
View SolutionAcceleration time graph of a body is shown below the corresponding velocity time graph of the same body is

View SolutionIf a body is realeased from the top of a tower, the graph between distance (x) and time (t) is correctly shown by
View SolutionThe graph between L and T is correctly shown by
View Solution
