Frequencies of X-rays of different materials are measured. Which one of the graphs in figure (44-Q1) may represent the relation between the frequency v and the atomic number Z.

The correct Answer is:D
Step by step video, text & image solution for Frequencies of K_alpha X-rays of different materials are measured. Which one of the graphs in figure (44-Q1) may represent the relation between the frequency v and the atomic number Z. by Physics experts to help you in doubts & scoring excellent marks in Class 12 exams.
Topper's Solved these Questions
- BOOK - HC VERMACHAPTER - X-RaysEXERCISE - Objective 28videos
X-Rays
- BOOK - HC VERMACHAPTER - X-RaysEXERCISE - Exercises27videos
X-Rays
- BOOK - HC VERMACHAPTER - X-RaysEXERCISE - Short Answer10videos
X-Rays
- BOOK - HC VERMACHAPTER - THERMAL AND CHEMICAL EFFECT OF ELECTRIC CURRENTEXERCISE - Exercises24videos
THERMAL AND CHEMICAL EFFECT OF ELECTRIC CURRENT
Similar Questions
If a graph is plotted between 1/v and 1/u , which one of the graph shown in figure is approximately correct ?
View SolutionSuppose the energy of Ka X-rays of two elements P and Q are 826.2eV and 2947.8eV, respectively, then the number of elements lying between P and Q according to their atomic number is
View Solution
Knowledge Check
- Question 1 - Select One
Which one of the follwing represents the variation of capacitive reactance (XC) with the frequency (v) of the voltage source ? .
A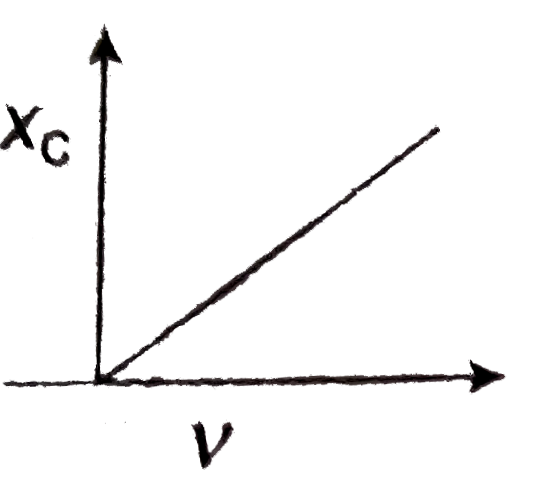 B
B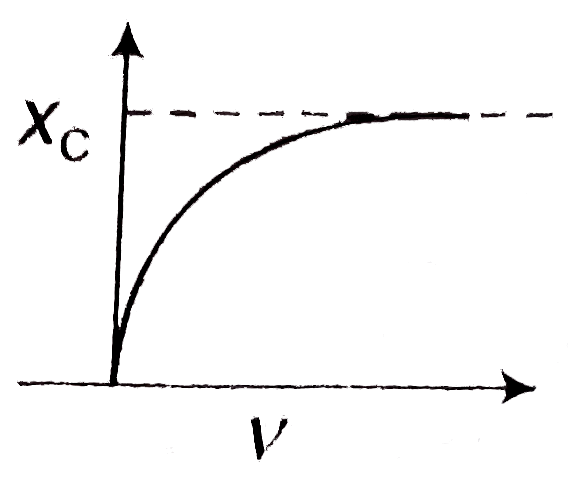 C
C D
D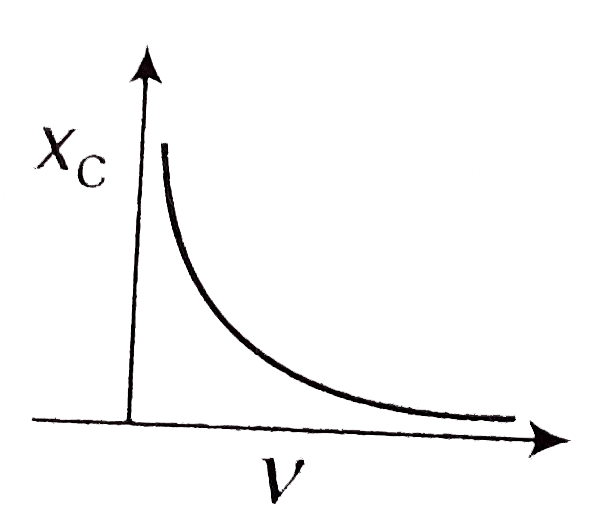
- Question 2 - Select One
An AC source of variable frequency f is connected to an LCR series circuit. Which one of the graphs in figure represents the variation of current of current I in the circuit with frequency f?
A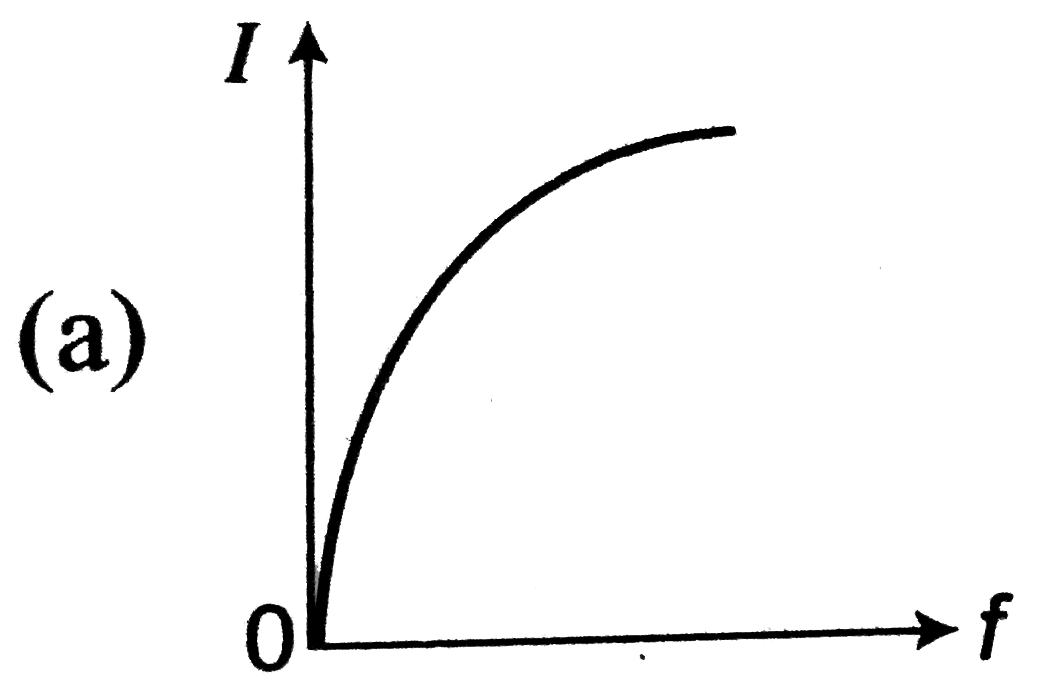 B
B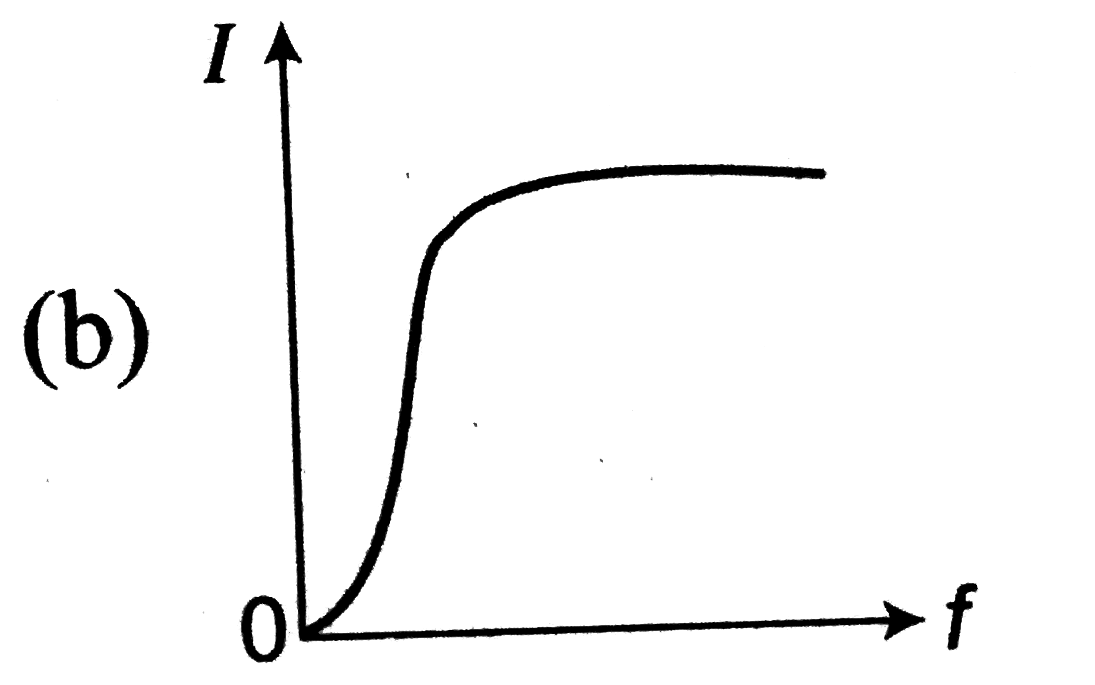 C
C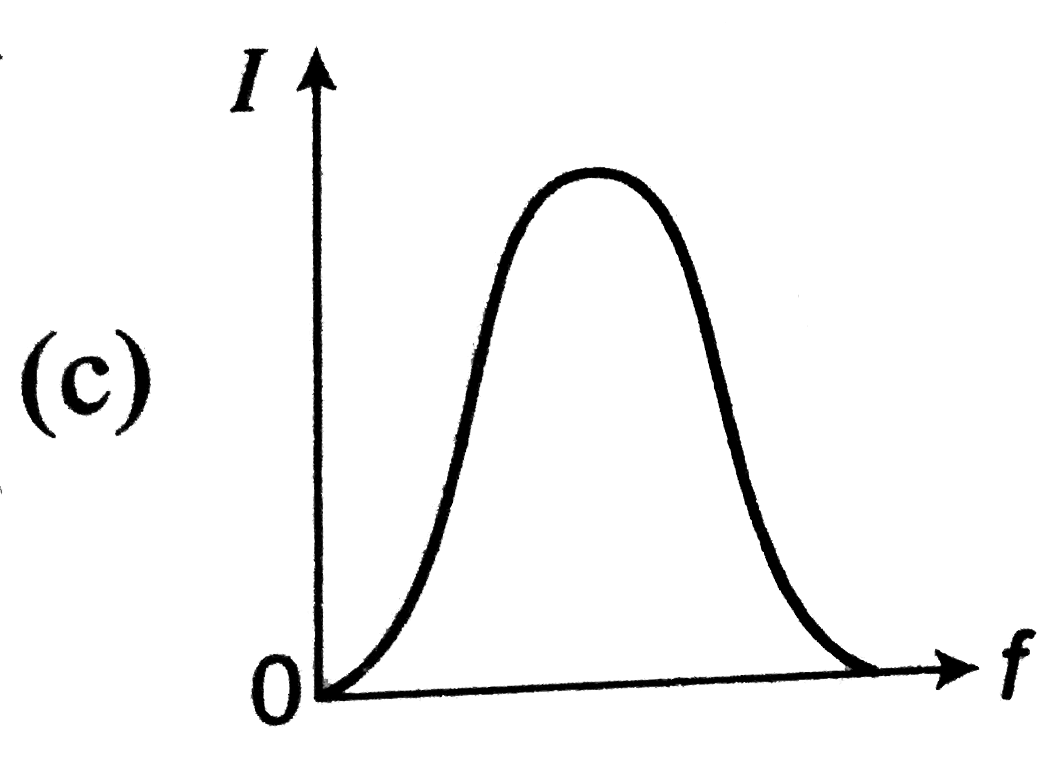 D
D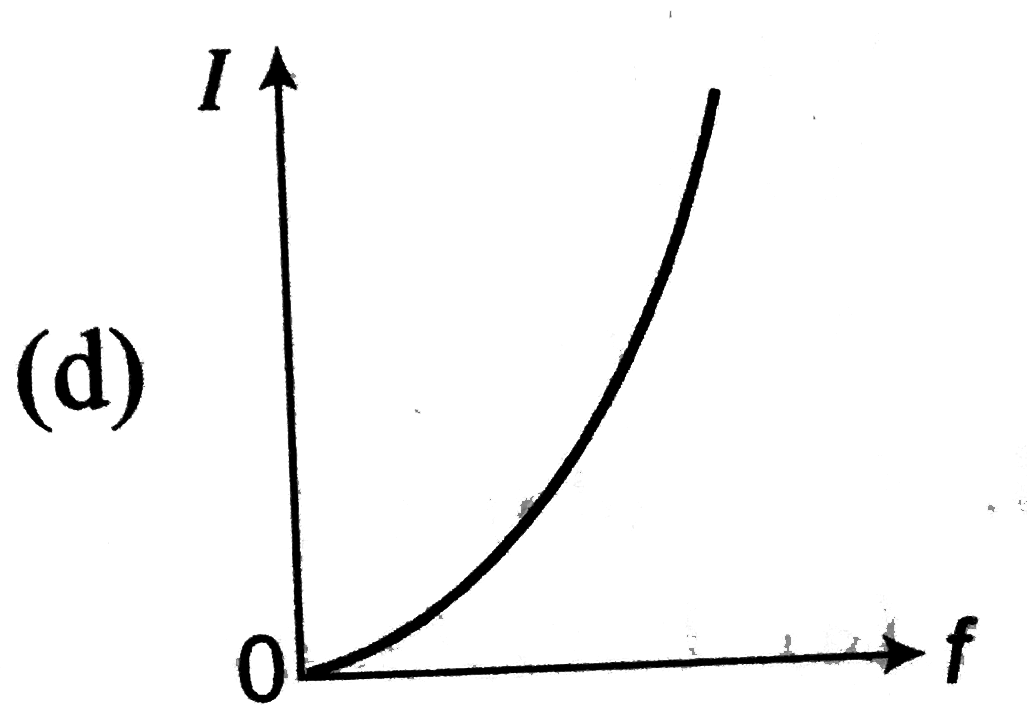
- Question 3 - Select One or More
Figure shows the variation of frequency of a characteristic X -ray and atomic number.
 AThe characteristic X-ray is KαBThe characteristic X- ray is KβCThe energy of photon emitted when this X-ray is emitted by a metal having z=101 is 204keVDThe energy of photon emitted when this X-ray is emitted by a metal having z=101 is 102keV
According to Moseley, a straight line graph is obtained on plotting:
Where, v is frequency and Z is atomic number.View Solution
Figure shows the displacement tiime (x-t) graph of a body moving in a straight line which one of the graph shown in figure represents the velocity- time (v-t) graph of the motion of the body.View SolutionSelect the correct statement :
Which of the following graph represents Mosely's experiement.
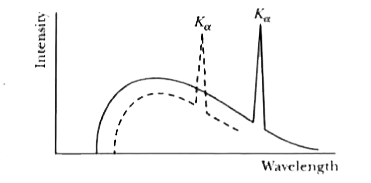
(v= frequency of X-rays)View SolutionThe following figure shows the intensity-wavelength relations of x-rays coming from two different Coolidge tubes. The solid curve represents the relation for tube A in which the potential difference between the target and the filament is VA and the atomic number of the target material is ZA. These quantities are VBandZB for the other tube. Then
 View Solution
In X-ray spectrum wavelength λ of line Kα depends on atomic number Z as
View Solution

