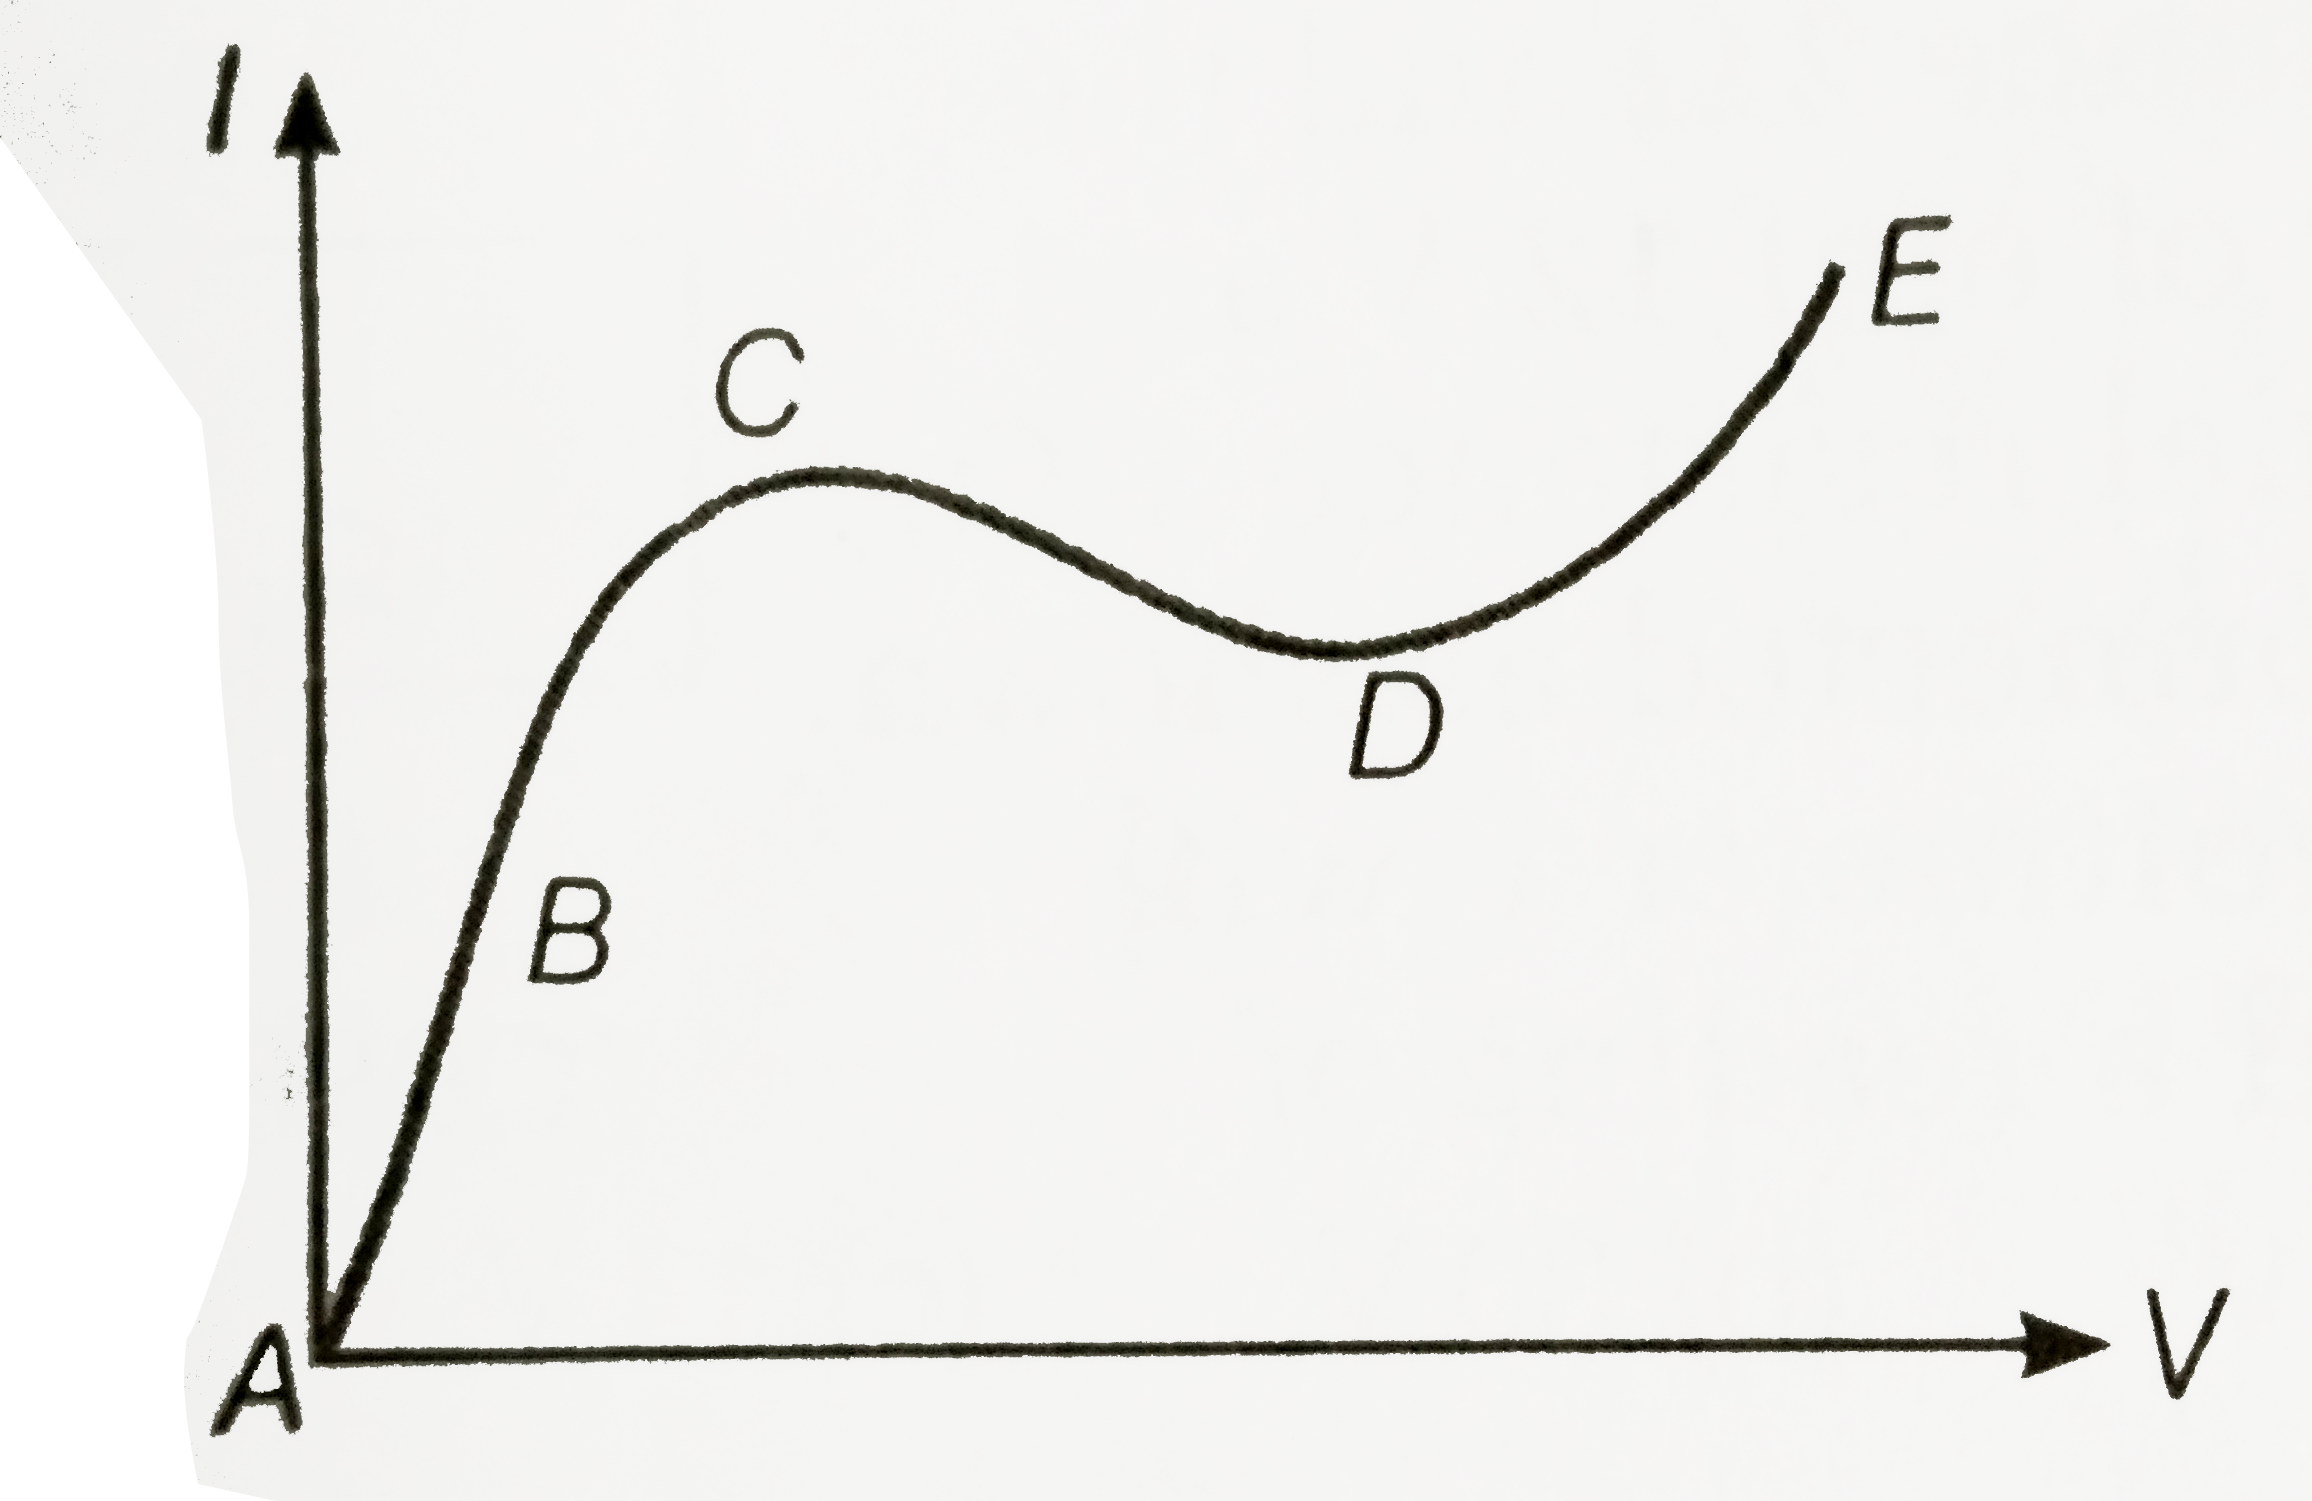
From the graph between current (I) and voltage (V) shown below, identify the portion corresponding to negative resistance.

AB
BC
CD
DE
The correct Answer is:C
The portion of the graph in which the current decreases when voltage increases shows the negative resistance. Hence the portion CD shows the negative resistance.
Topper's Solved these Questions
- BOOK - DISHA PUBLICATIONCHAPTER - CURRENT ELECTRICITYEXERCISE - EXERCISE-1 Concept Builder (Topicwise) Topic 2: Resistance, Conductance and Resistivity14videos
CURRENT ELECTRICITY
- BOOK - DISHA PUBLICATIONCHAPTER - CURRENT ELECTRICITYEXERCISE - EXERCISE-1 Concept Builder (Topicwise) Topic 3: Combination of Resistors10videos
CURRENT ELECTRICITY
- BOOK - DISHA PUBLICATIONCHAPTER - CURRENT ELECTRICITYEXERCISE - EXERCISE-2 Concept Applicator23videos
CURRENT ELECTRICITY
- BOOK - DISHA PUBLICATIONCHAPTER - CONCEPT BUILDEREXERCISE - Exercise-2 Concept Applicator27videos
CONCEPT BUILDER
- BOOK - DISHA PUBLICATIONCHAPTER - DUAL NATURE OF RADIATION AND MATTEREXERCISE - EXERCISE -2 : CONCEPT ALLPLICATOR30videos
DUAL NATURE OF RADIATION AND MATTER
Similar Questions
From the given between current I and voltage V shown in figure , indentify the portion corresponding to negative resistance
 View Solution
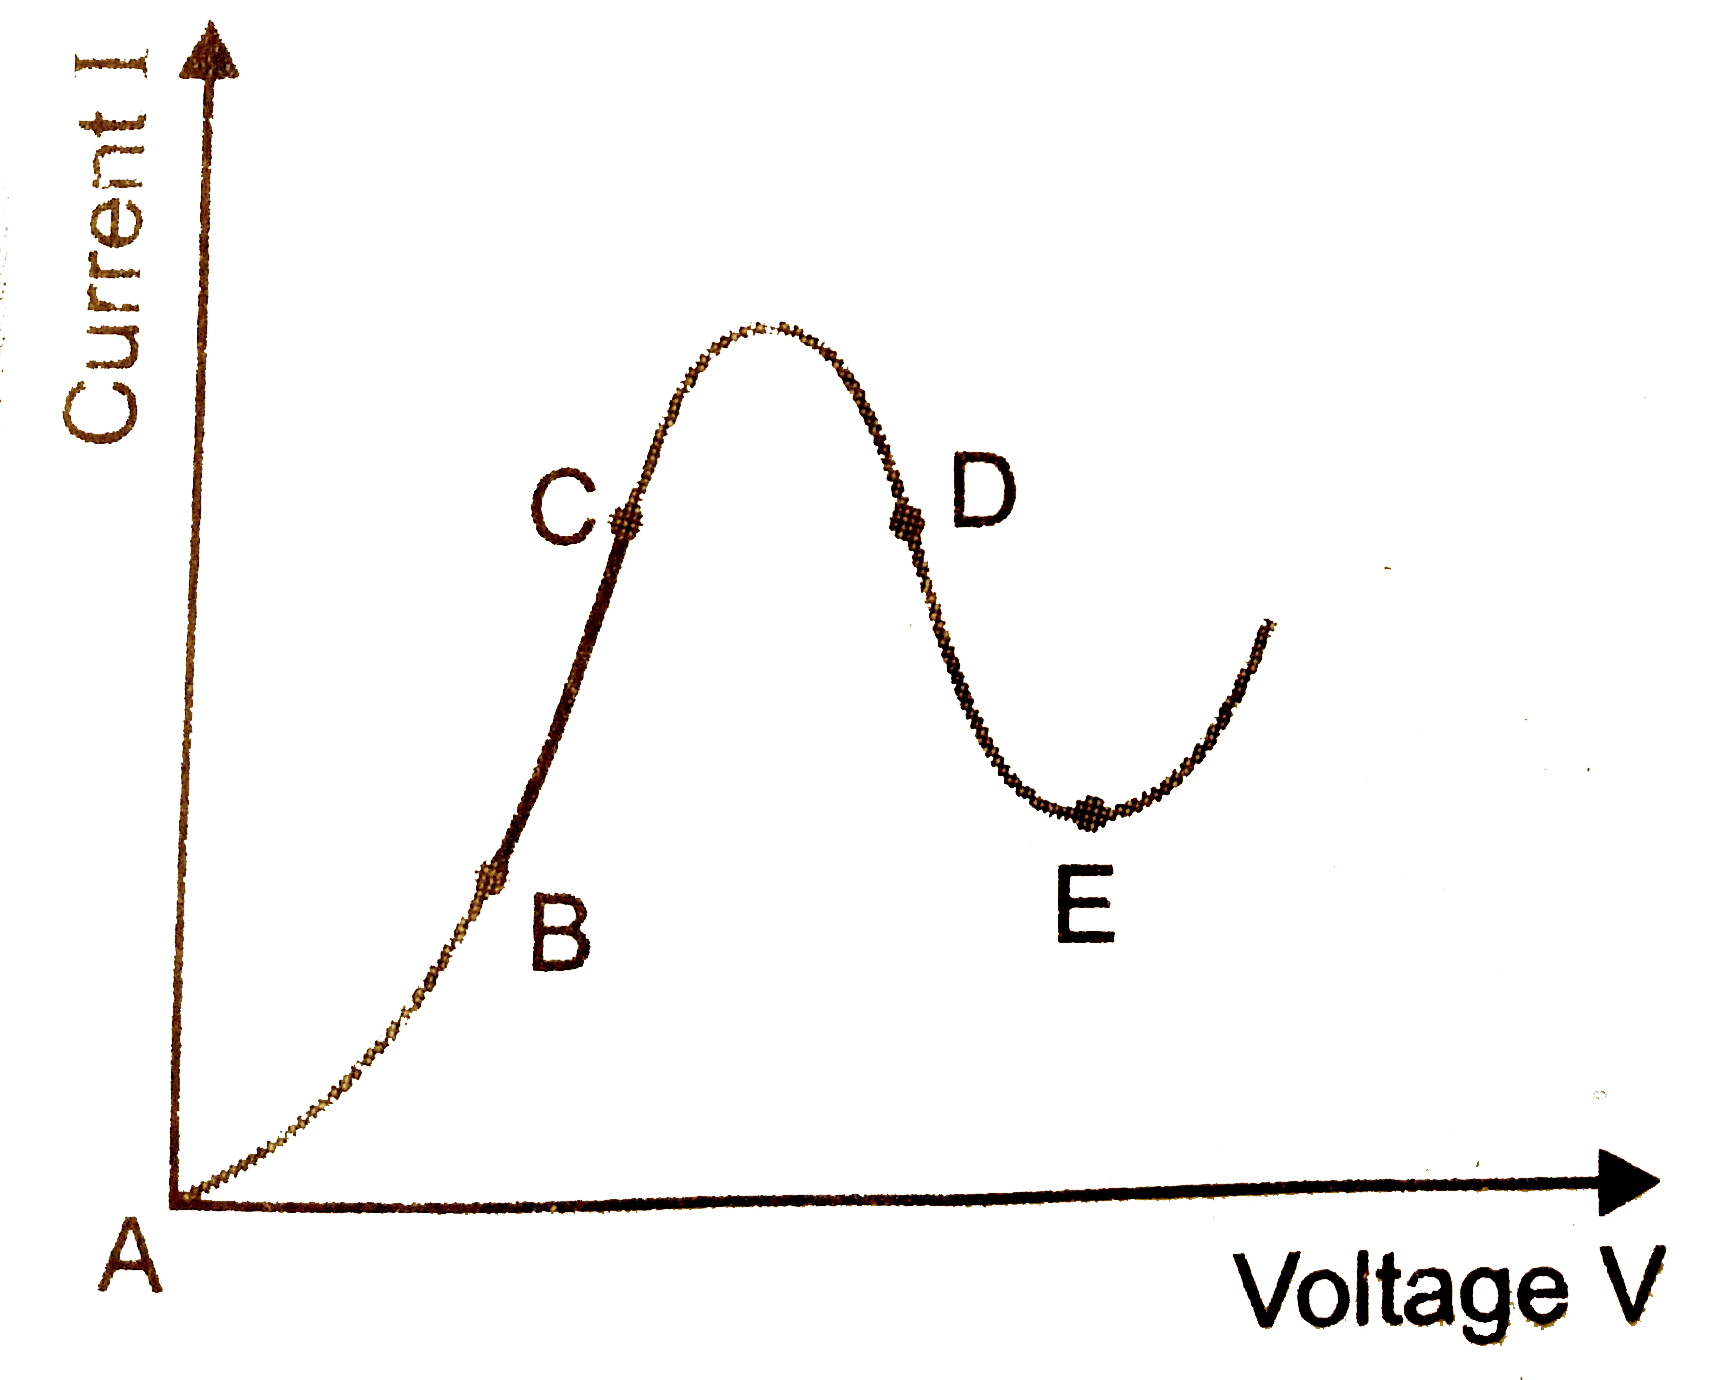
Graph showing the variation of current versus voltage for a material GaAs is shown in figure. Identify the region of (i) negative resistance (ii) where Ohm's law is obeyed.
 View Solution
Knowledge Check
- Question 1 - Select One
From the given between current I and voltage V shown in figure , indentify the portion corresponding to negative resistance
 ADEBCDCBCDAB
 - Question 2 - Select One
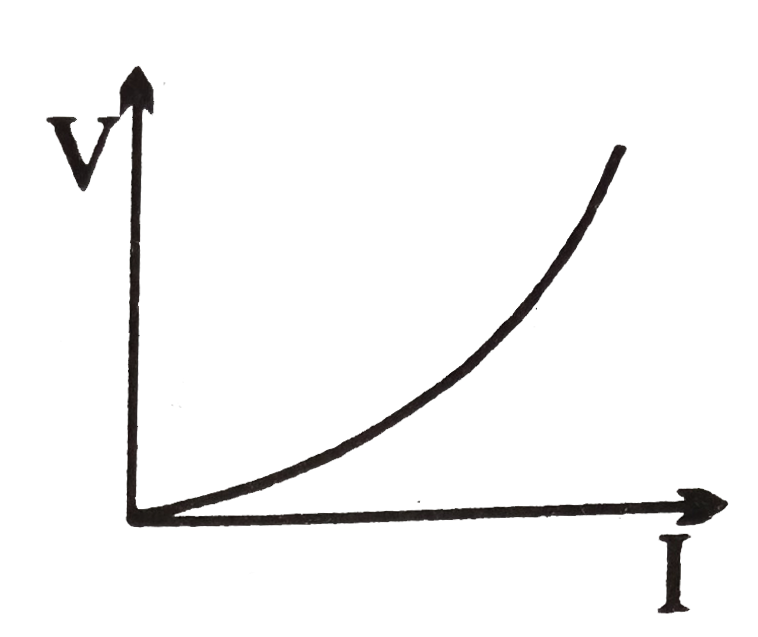
The variation of current (I) and voltage (V) is as shown in figure A. The variation of power P with current I is best shown by which of the following graph
 A
A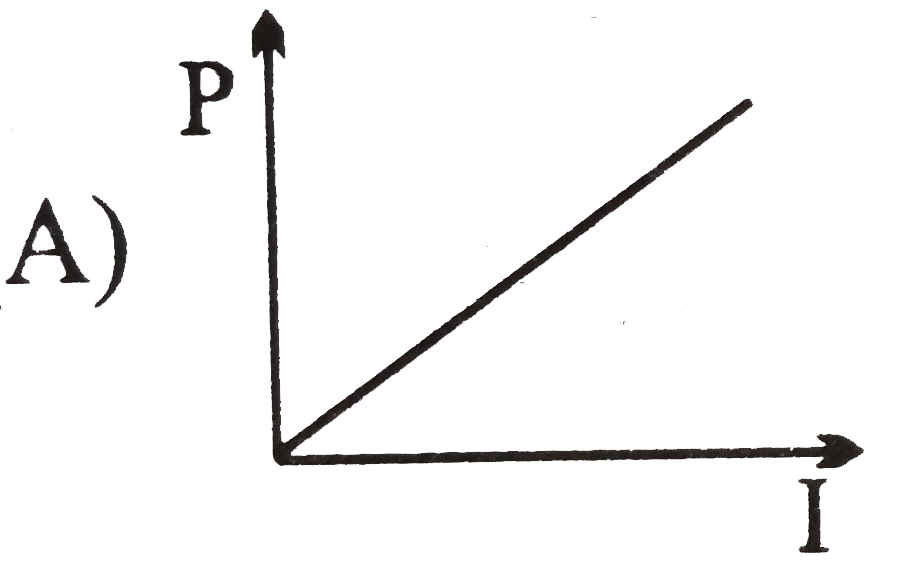 B
B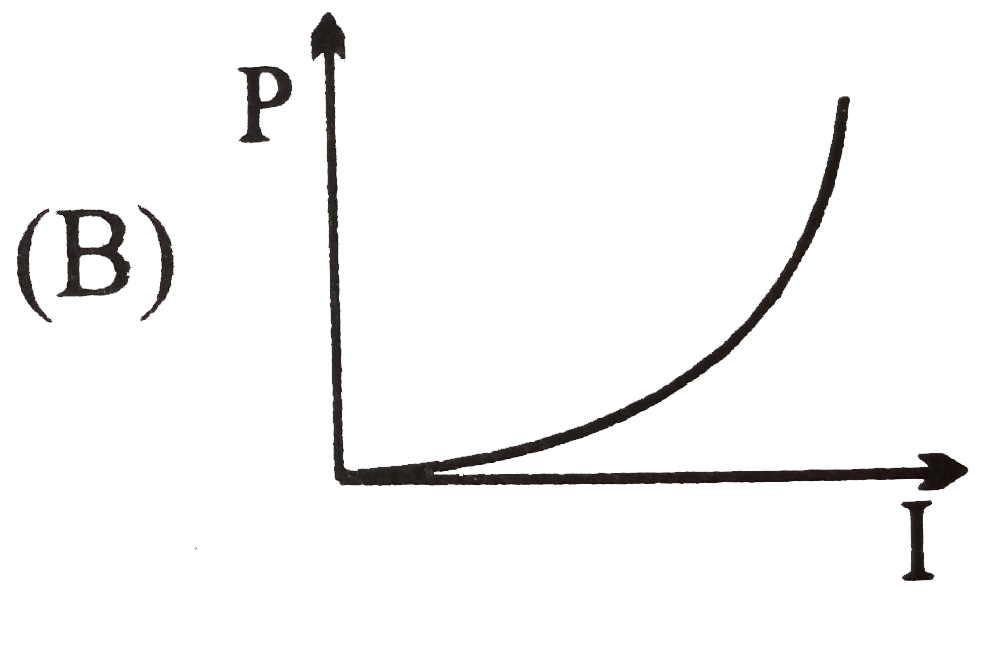 C
C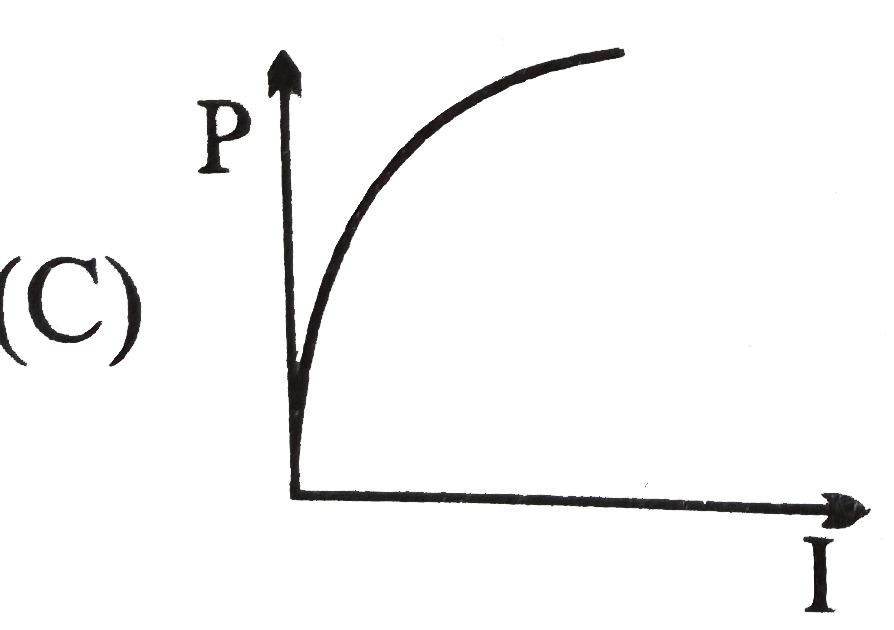 D
D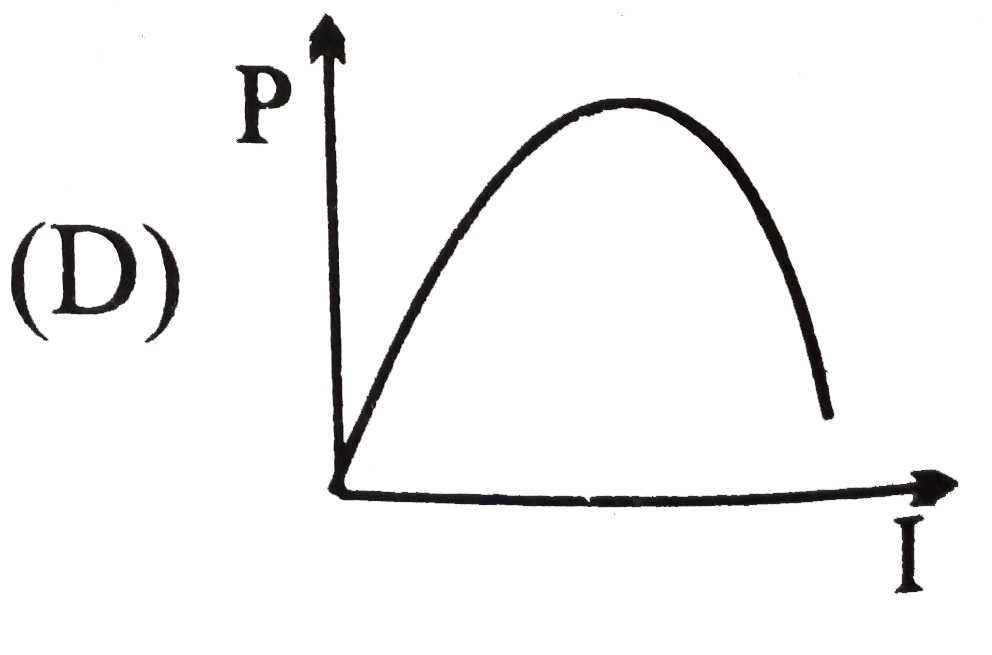
Graph showing the variation of current versus voltage for a material GaAs is shown in figure. Identify the region of (i) negative resistance (ii) where Ohm's law is obeyed.
 View Solution
The values of current (I) flowng through a given resistor of resistance (R ), for the corresponding values of potential difference (V) across the resistor are as given below :

Plot a graph between current (I) and potential difference (V) and determine the resistance (R ) of the resistor.View SolutionFind the current I & voltage V in the circuit shown.
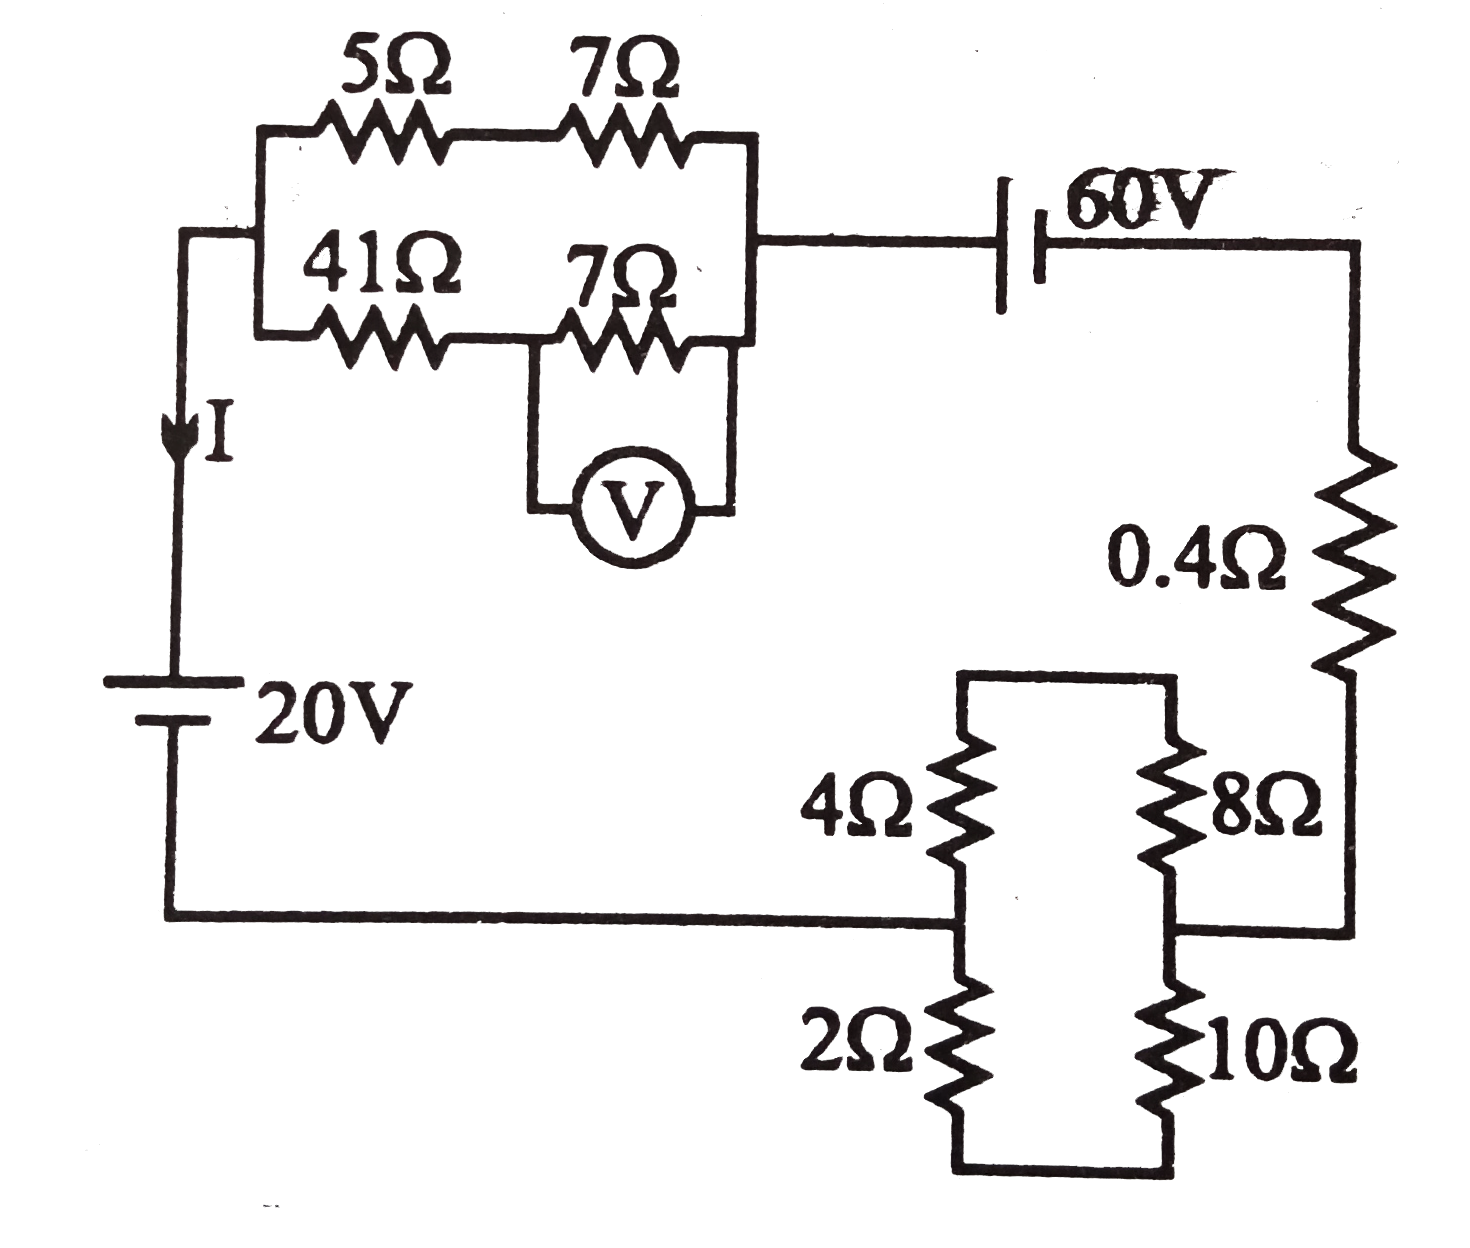 View Solution
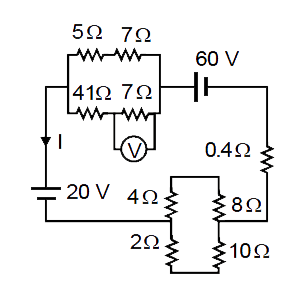
Find the current I & voltage V in the circuit shown.
 View Solution
The variation of current (I) and voltage (V) is as shown in figure A. The variation of power P with current I is best shown by which of the following graph
 View Solution
The graphs between current (1) and voltage (v) for three linear resistors 1,2 and 3 are given below:
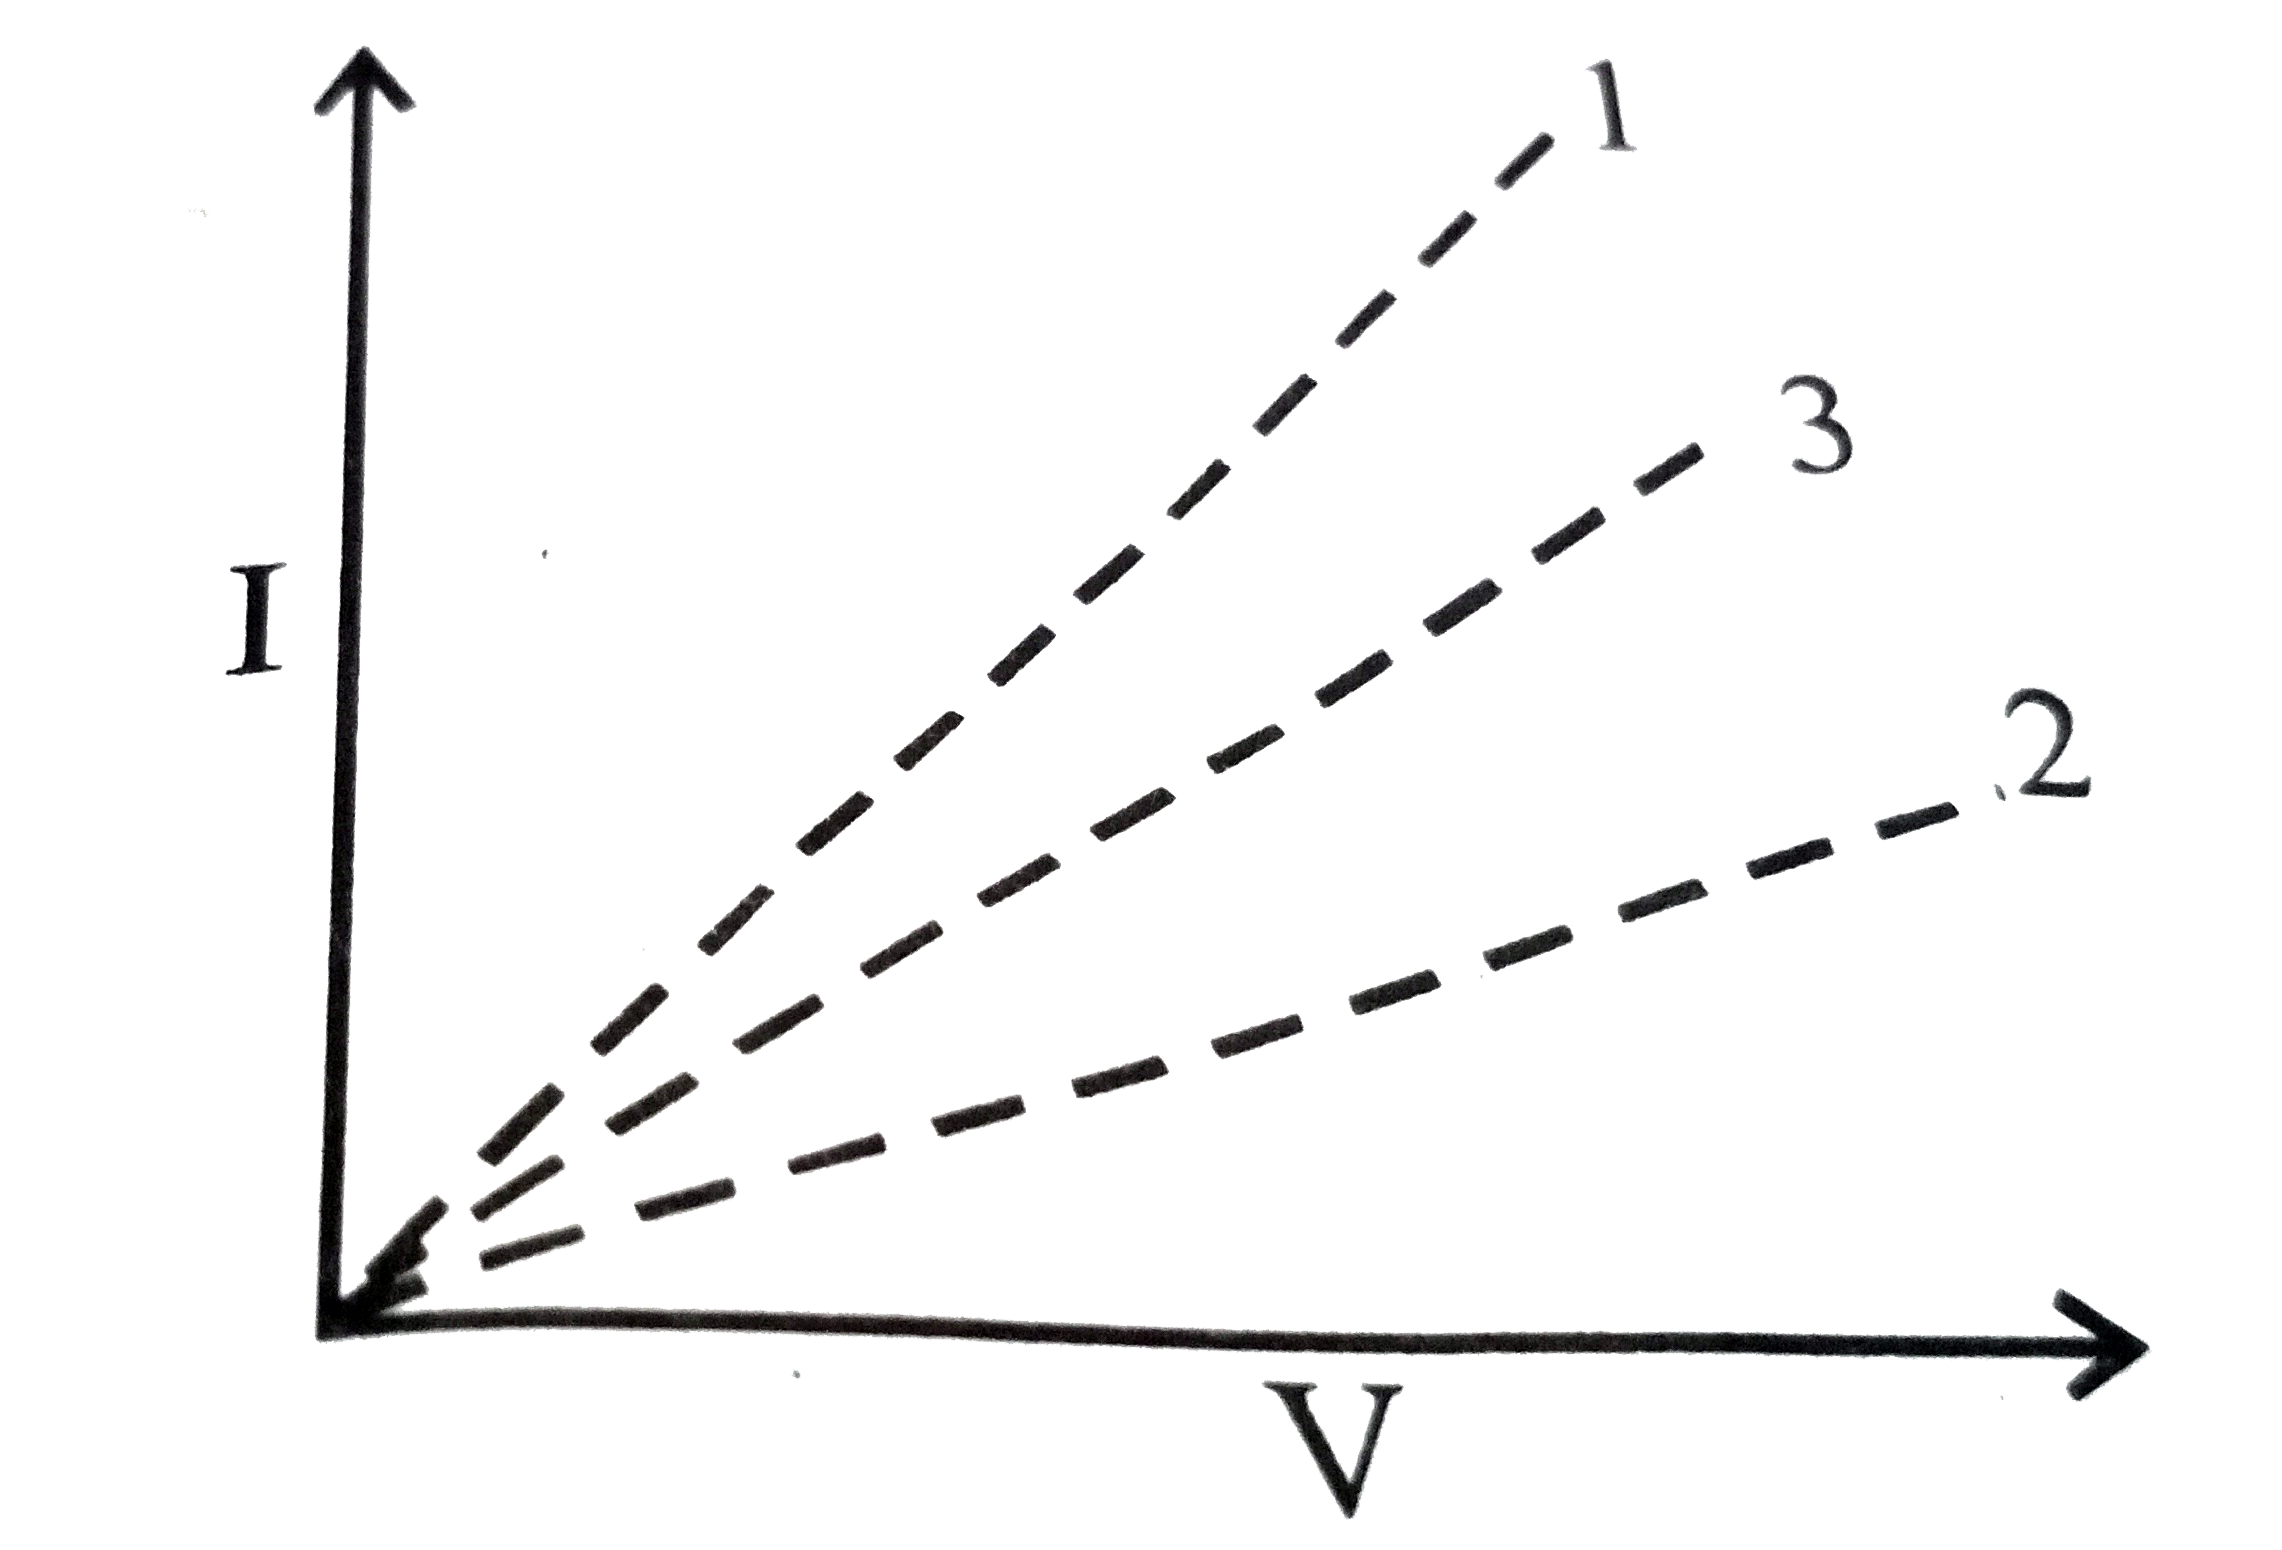
If R1,R2 and R3 are the resistances of these resistors, then which one of the following is correct?View Solution

