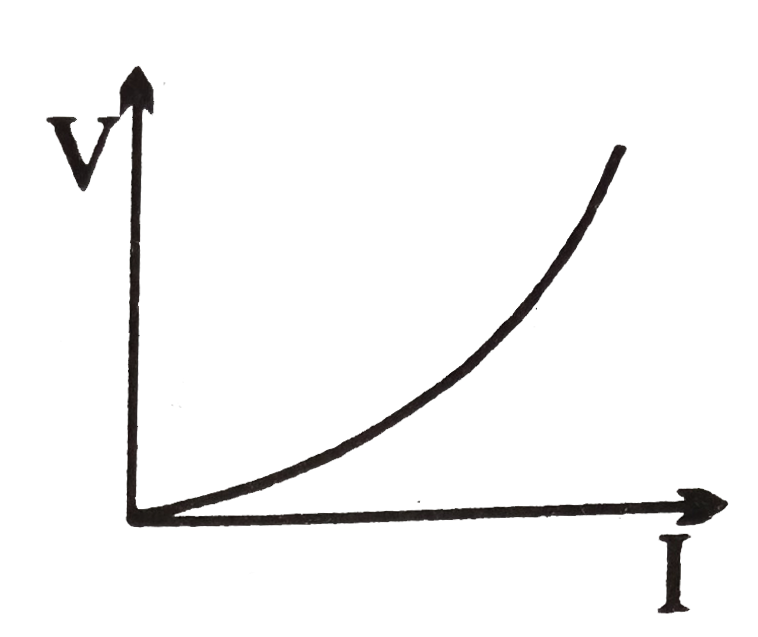
The variation of current (I) and voltage (V) is as shown in figure A. The variation of power P with current I is best shown by which of the following graph
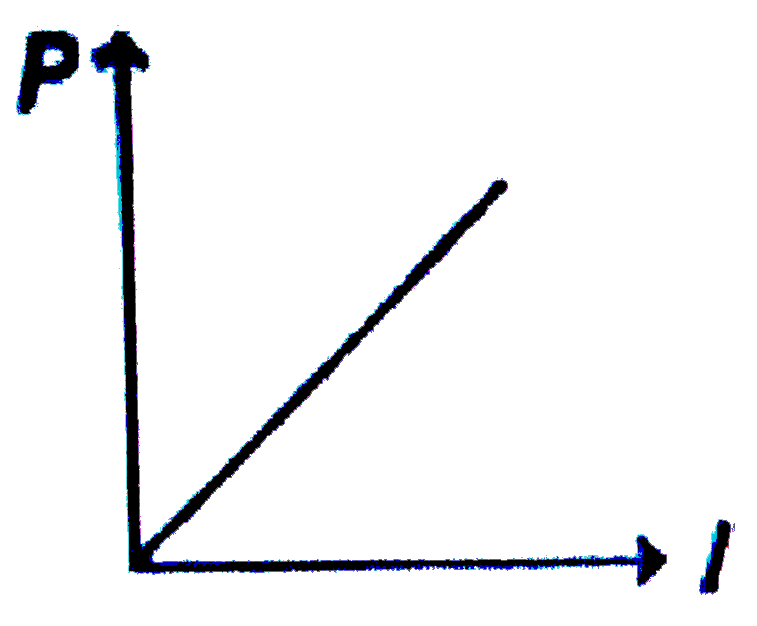
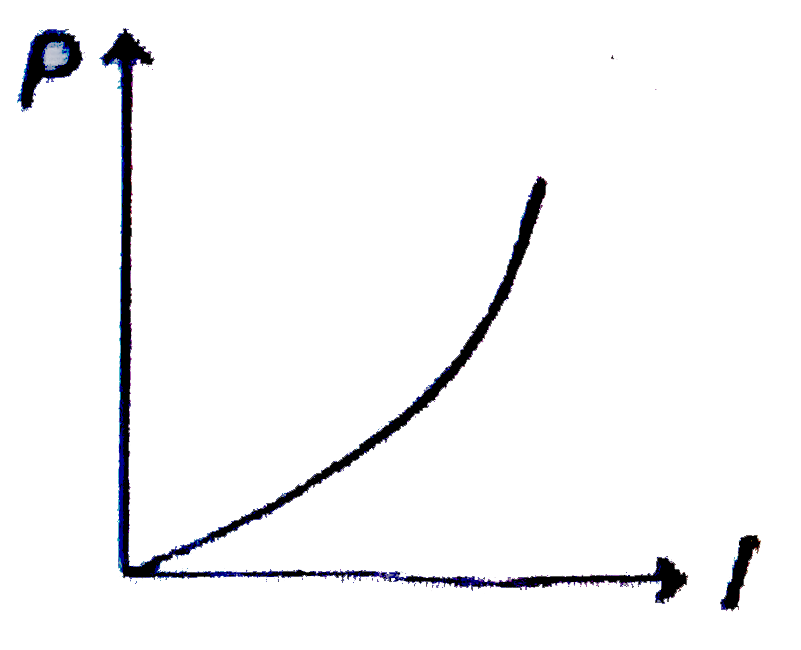
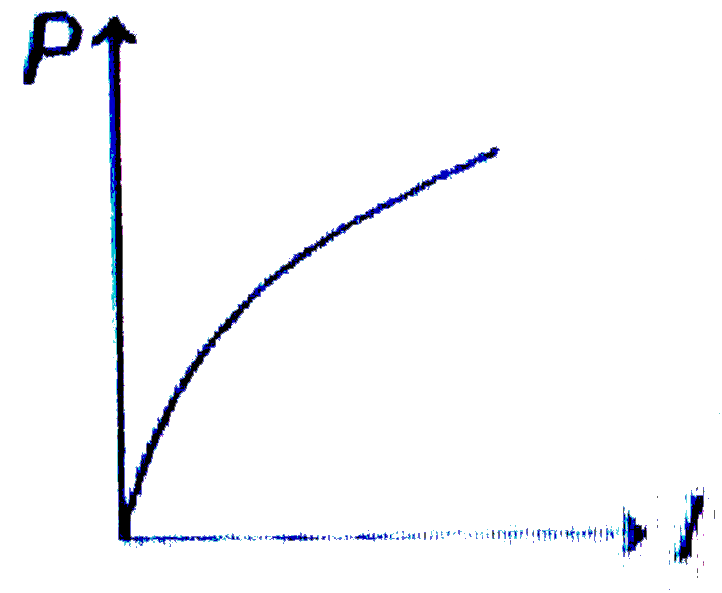
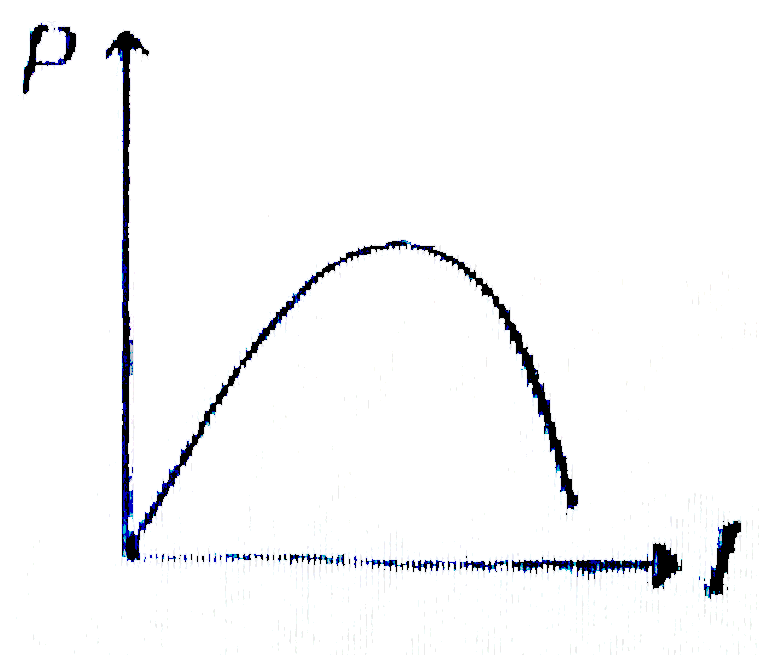
The correct Answer is:B
Step by step video & image solution for The variation of current (I) and voltage (V) is as shown in figure A. The variation of power P with current I is best shown by which of the following graph by Physics experts to help you in doubts & scoring excellent marks in Class 11 exams.
Updated on:21/07/2023Topper's Solved these Questions
Similar Questions
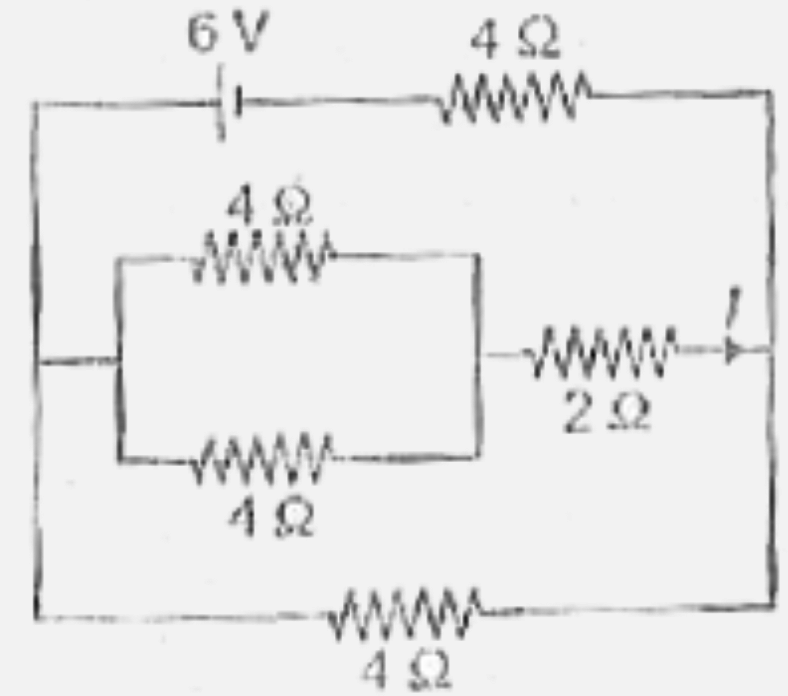
In an electric circuit shown alongside, find
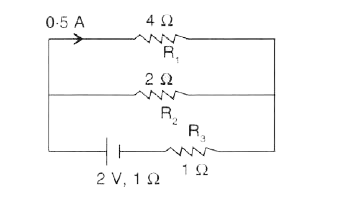
terminal voltage of the battery
View SolutionCurrent I in the network shown in figure
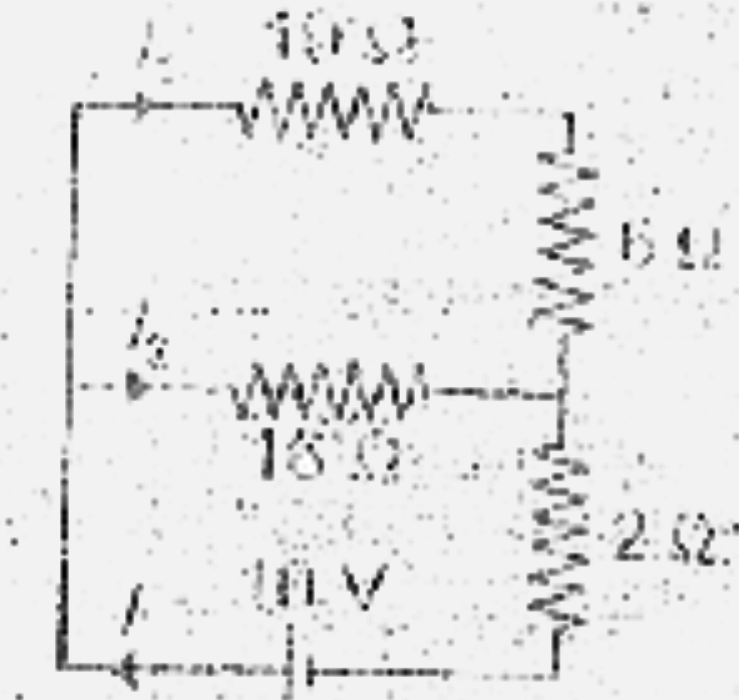
View SolutionThe value of current i, in the electrical network as shown in the figure is

View SolutionIn the circuit as shown in figure, the ratio of current i1/i2 is
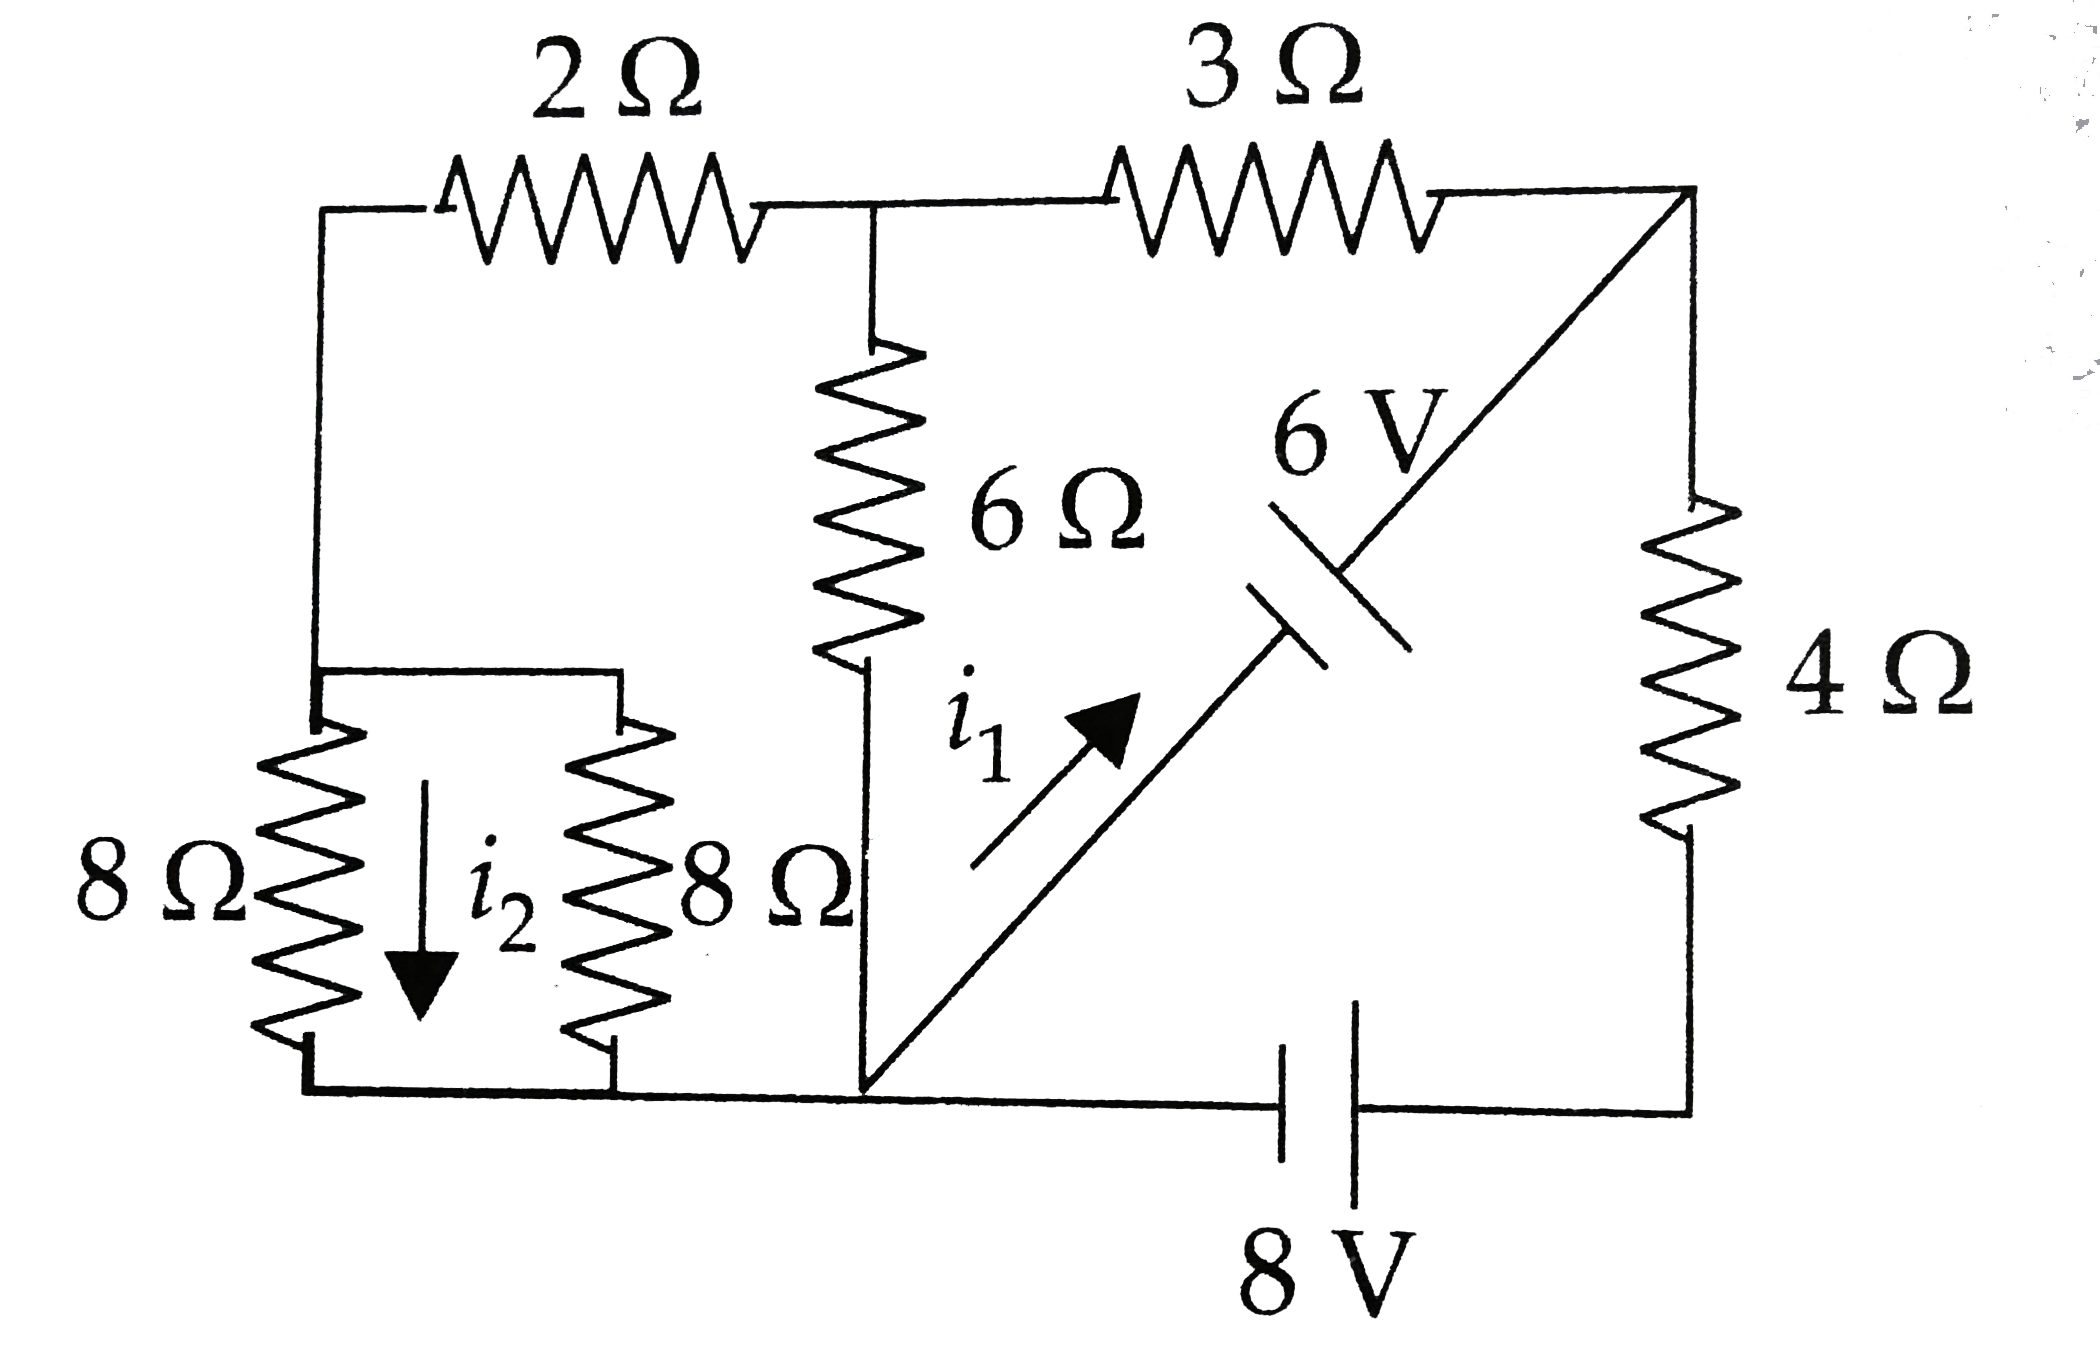
View SolutionThe current I in the circuit shown below is
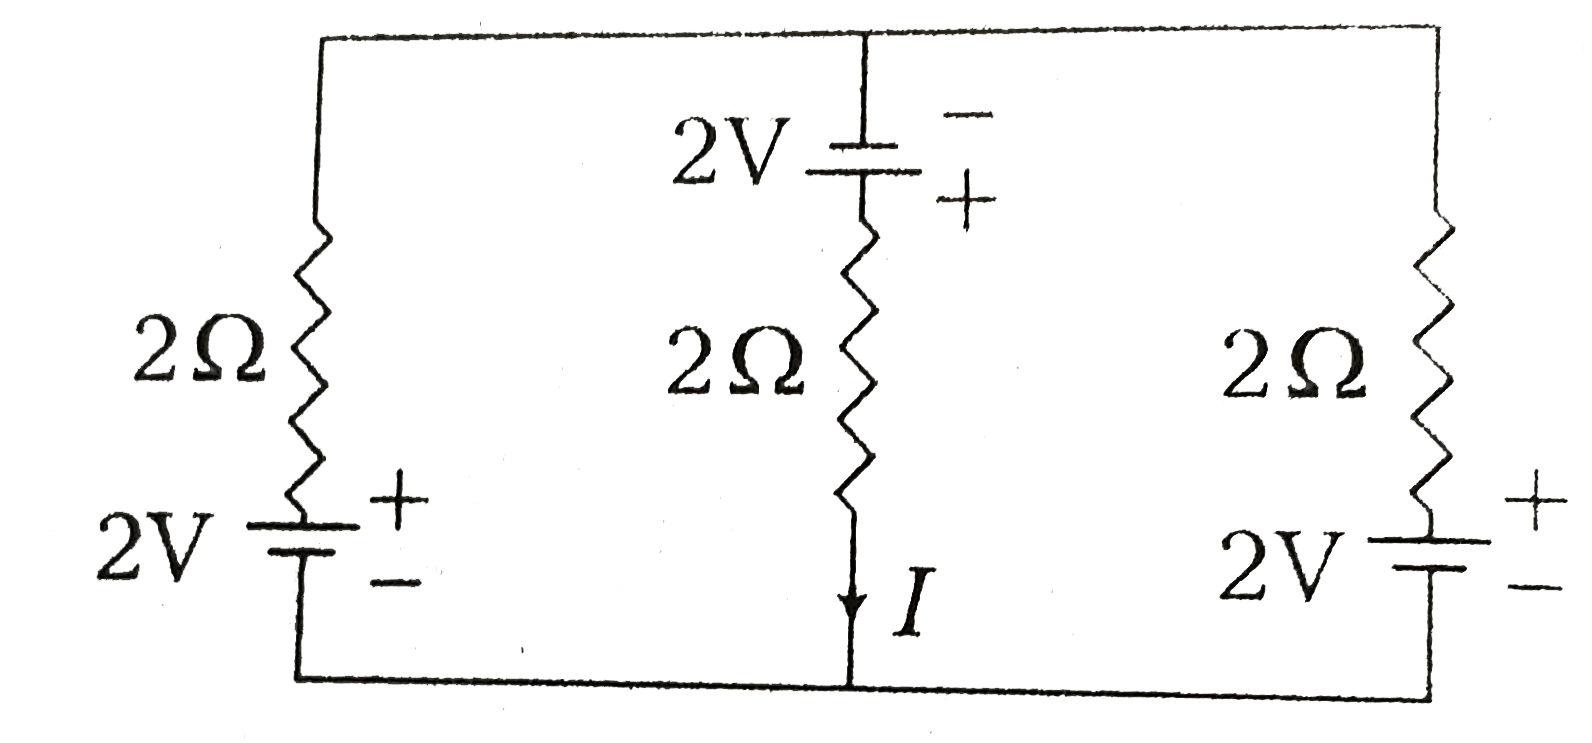
View SolutionThe current I shown in the circuit is
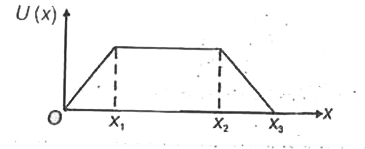
View SolutionThe variation of potential energy U of a system is shown in figure. The force acting on the system is best represented by
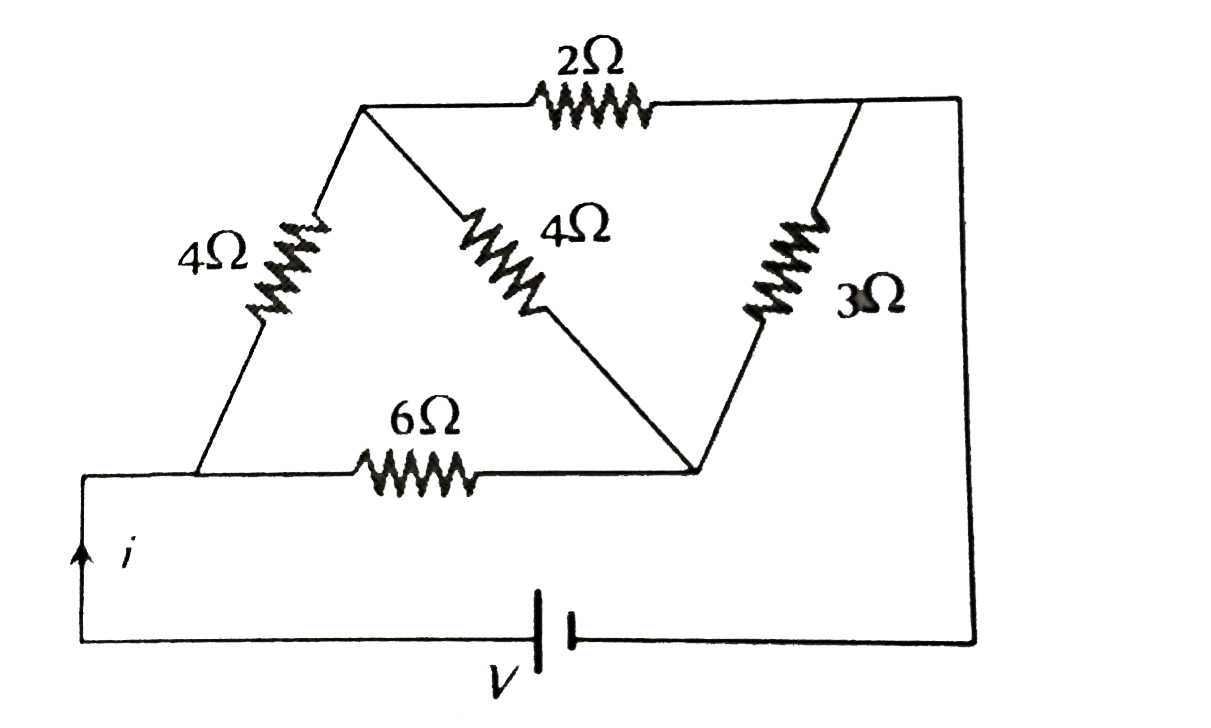
View SolutionFor the network shown in the figure the value of the current i is -

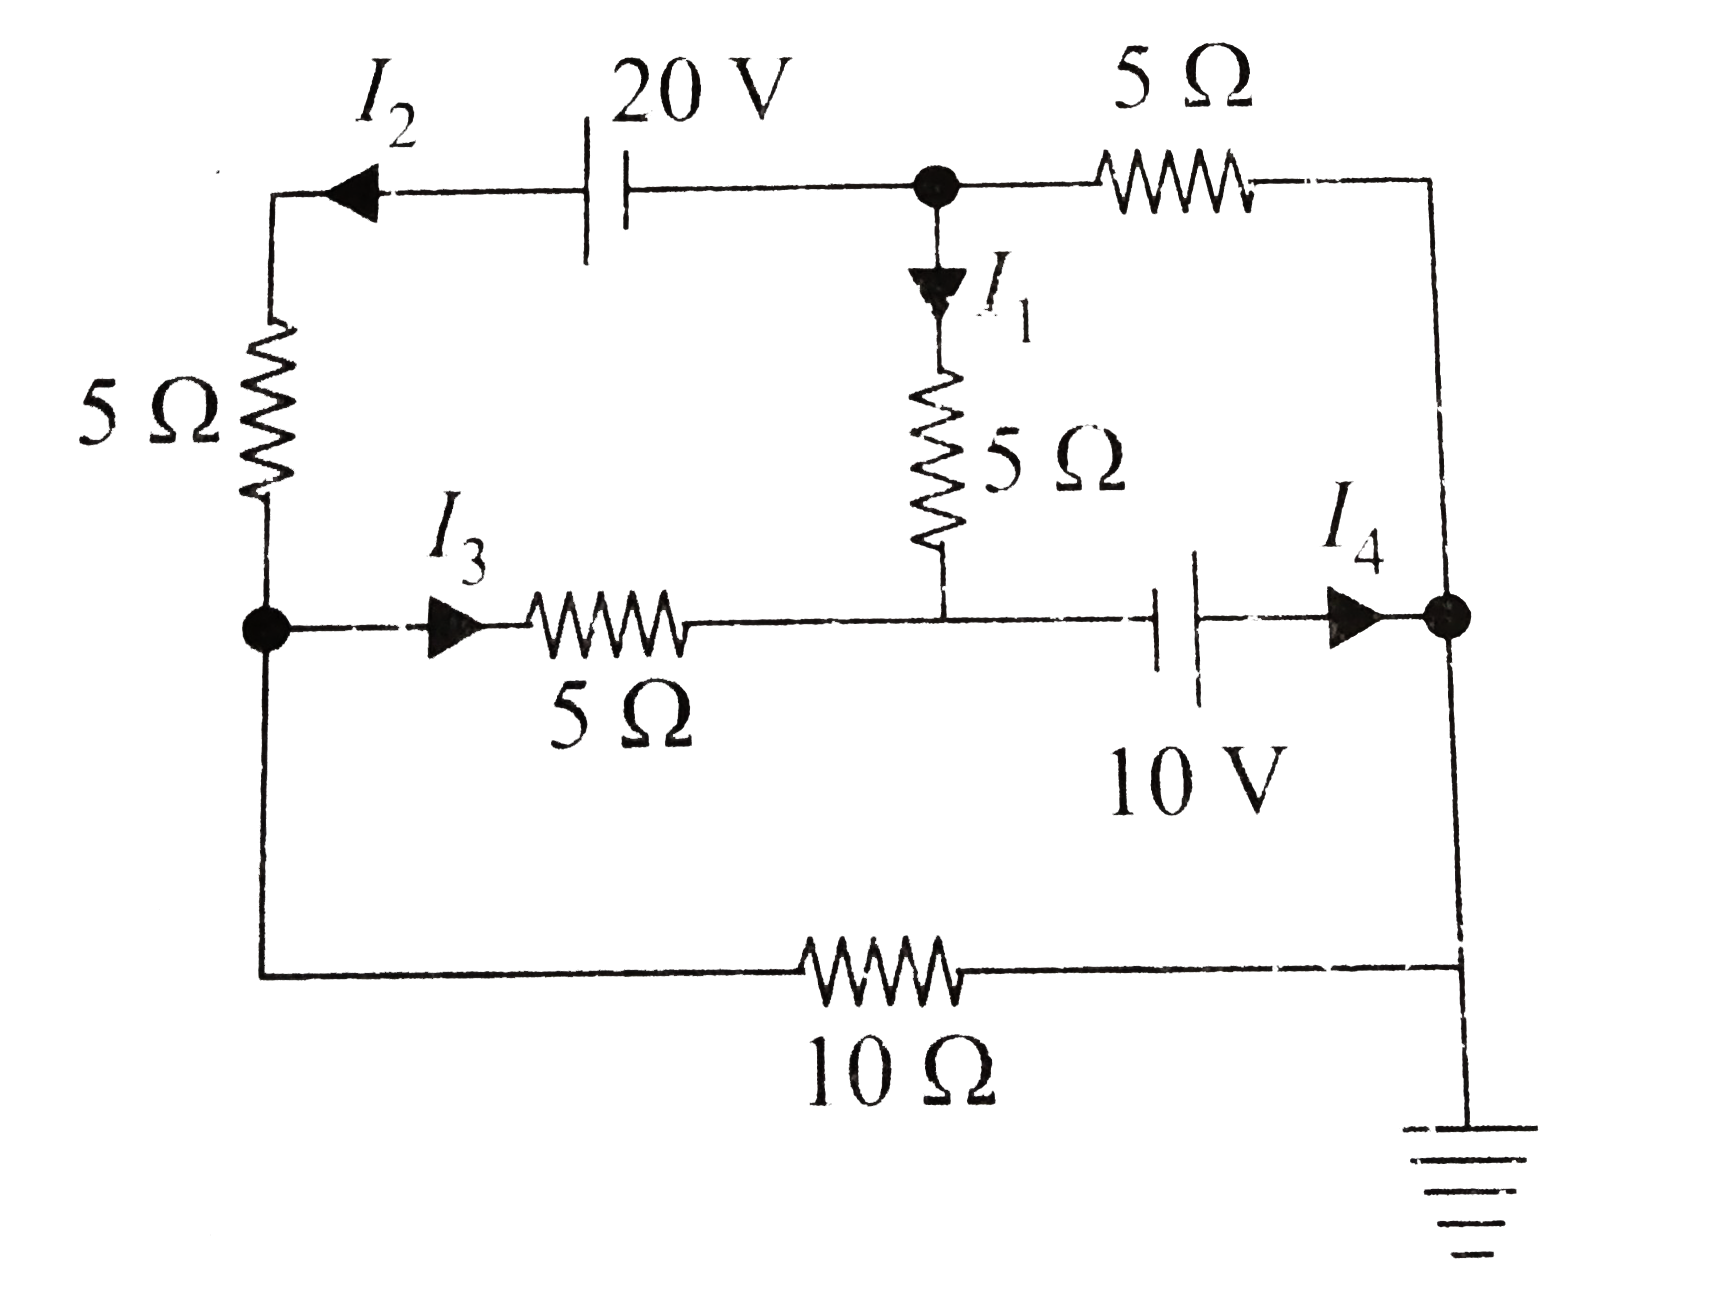
View SolutionIn the circuit shown in the figure
 .
.
The value of current I4 is
View SolutionFor the network shown in the figure the value of the current i is
View Solution
