Identify the graph which correctly represents the variation of capacitive reactance XC with frequency


The correct Answer is:B
XC=1ωC=12πfC⇒XC∝1f
Topper's Solved these Questions
- ALTERNATING CURRENTBOOK - A2ZCHAPTER - ALTERNATING CURRENTEXERCISE - Different Ac Circuits
30 Videos
- ALTERNATING CURRENTBOOK - A2ZCHAPTER - ALTERNATING CURRENTEXERCISE - Power In Ac Circuits
21 Videos
- ALTERNATING CURRENTBOOK - A2ZCHAPTER - ALTERNATING CURRENTEXERCISE - Section D - Chapter End Test
30 Videos
- ATOMIC PHYSICSBOOK - A2ZCHAPTER - ATOMIC PHYSICSEXERCISE - Section D - Chapter End Test
30 Videos
Similar Questions
Explain the term 'capacitive reactance'.Show graphically the variation of capacitive reactance with frequency of the applied alternating voltage.
An a.c. voltage E=E0sinωt is applied a across a pure capacitor C.Show mathematically that the current flowing through it leads the applied voltage by a phase angle of π/2
View SolutionWhat is the value of capacitive reactance (XC) in DC circuits ?
View Solution
Knowledge Check
Identify the graph which correctly reperesents the variation of capacitive reactance XC with frequency
A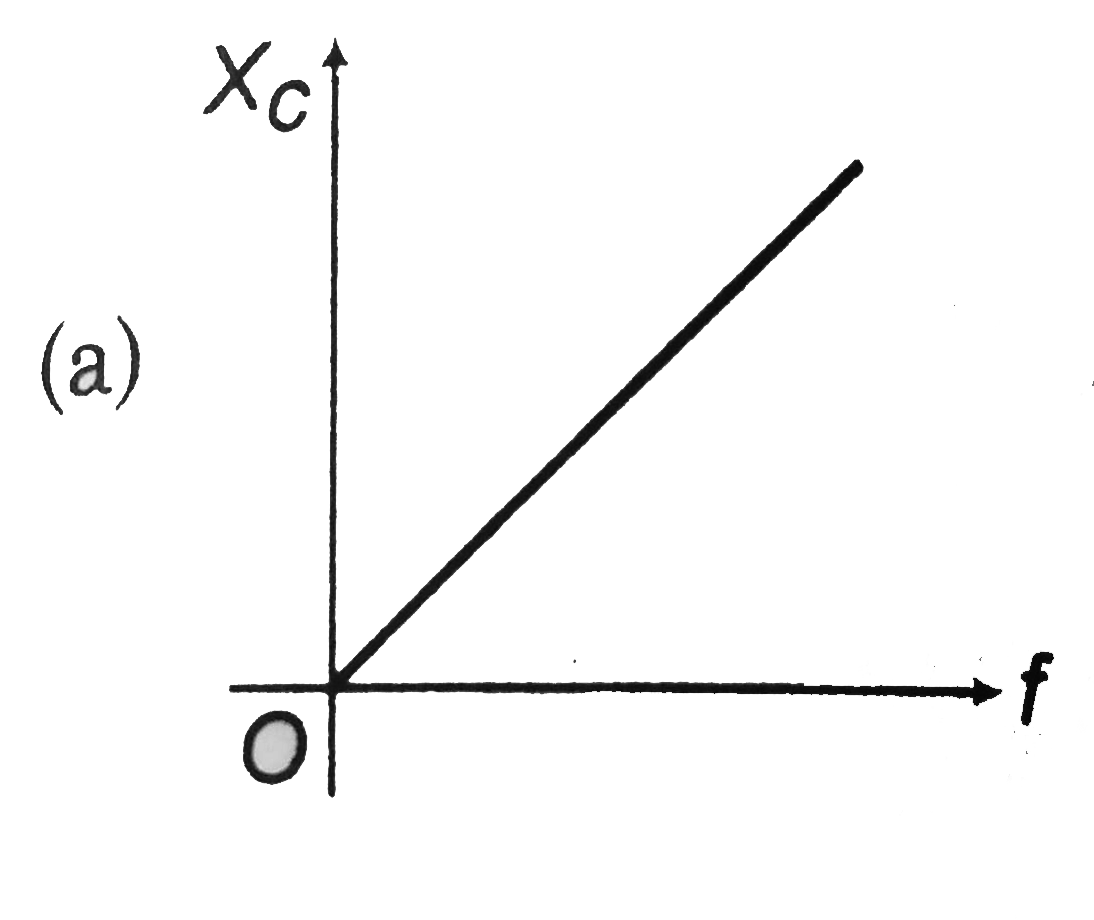 B
B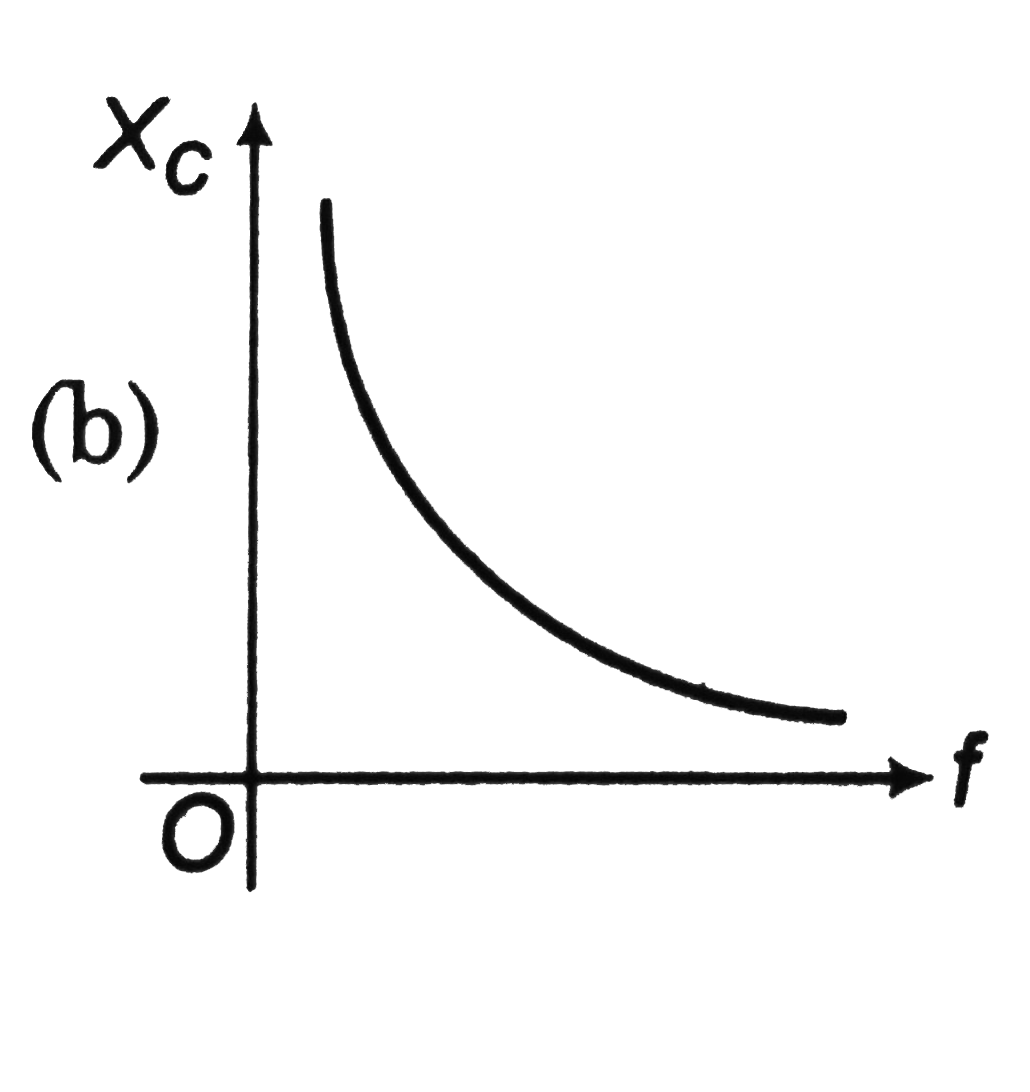 C
C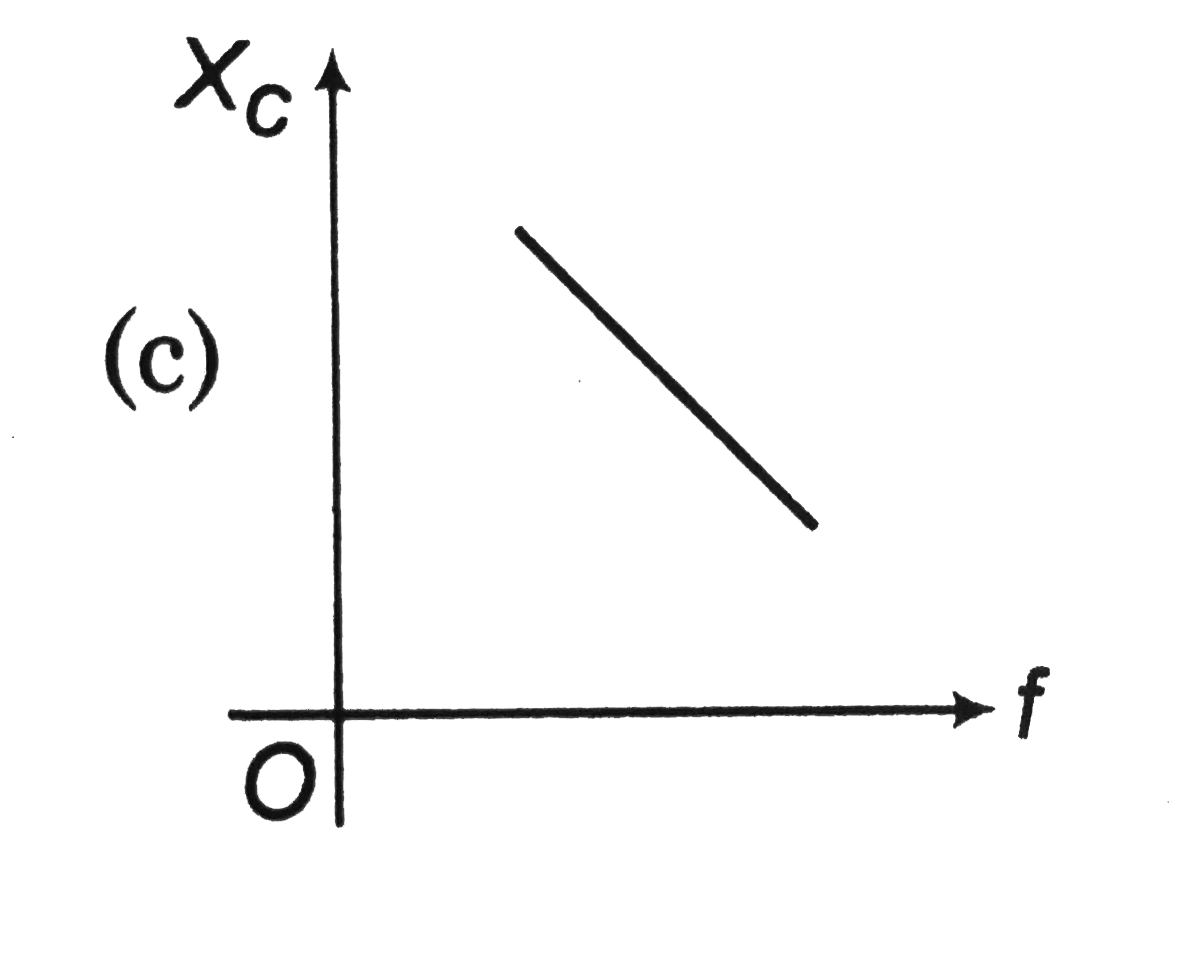 D
D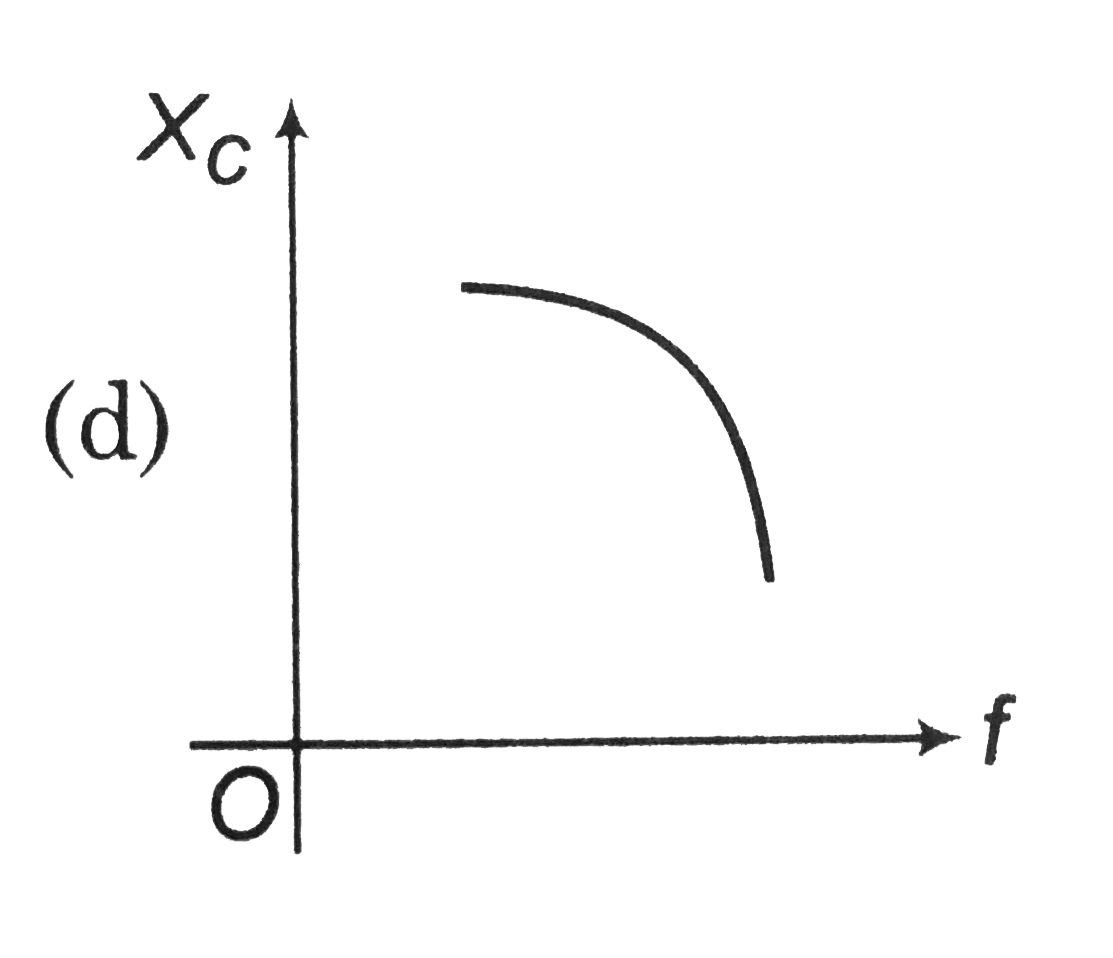
Identify the graph which correctly represent the Moseley's law-
A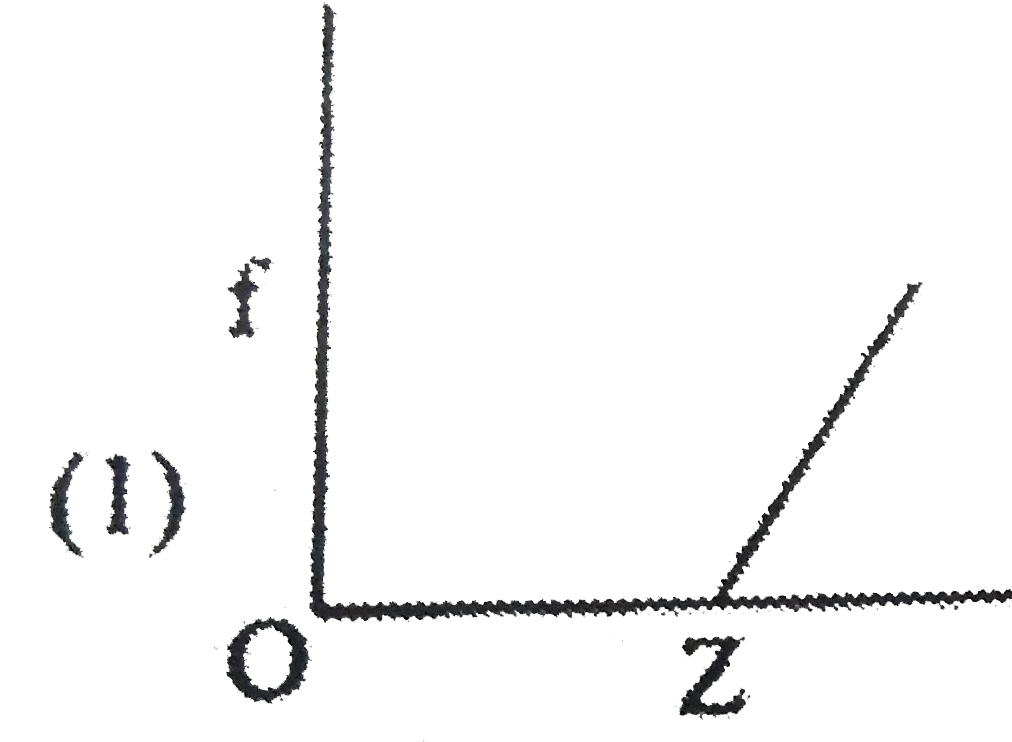 B
B C
C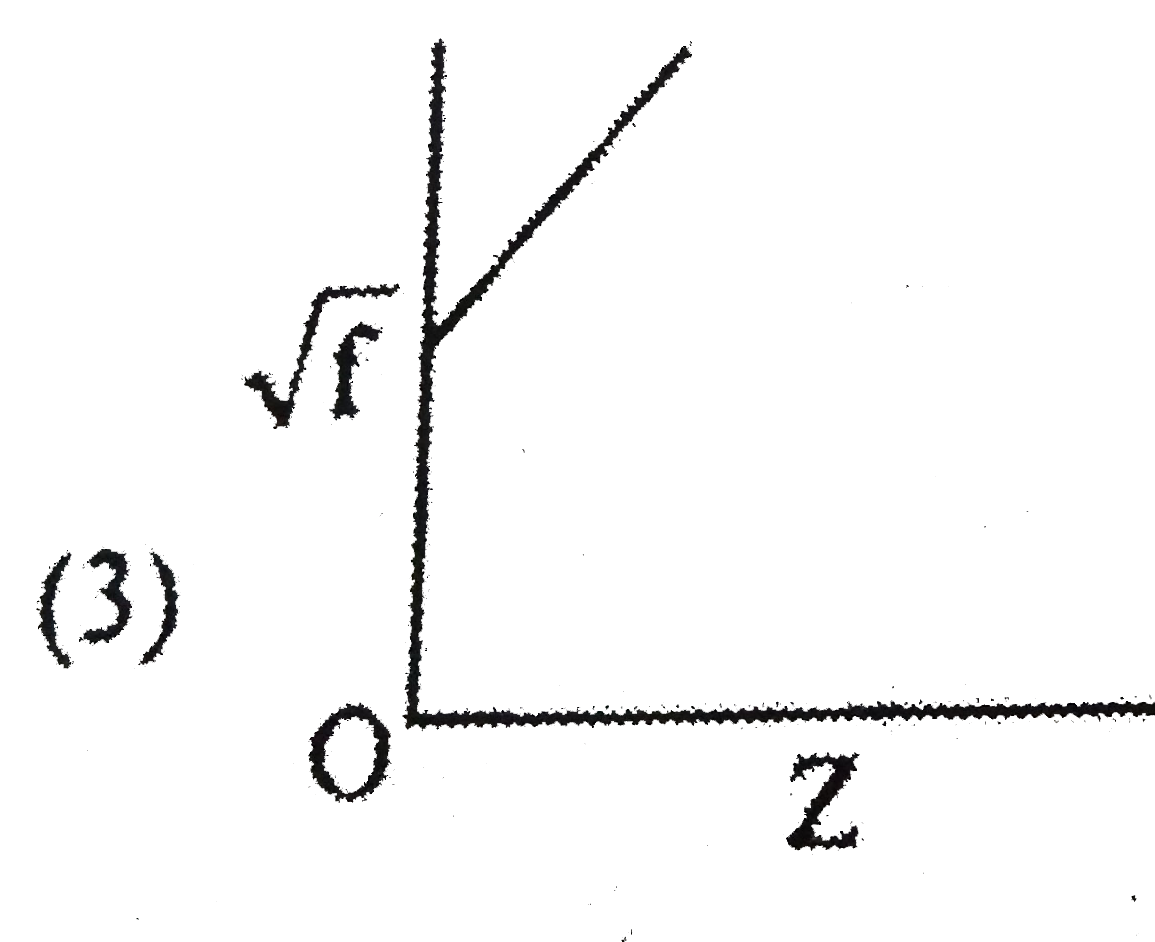 D
D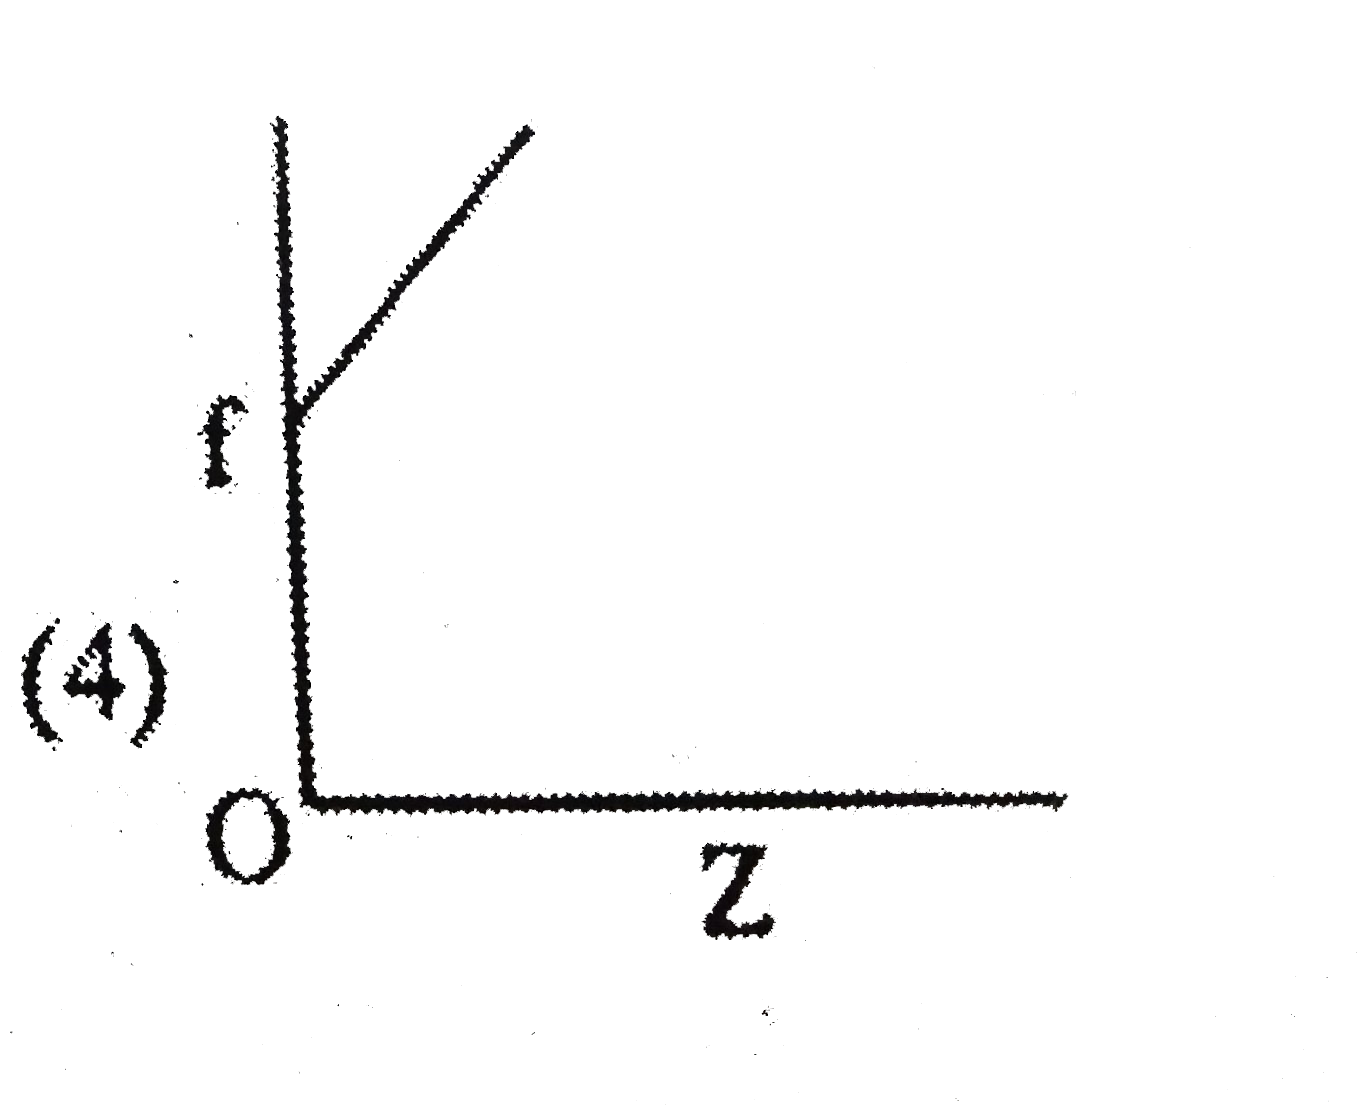
Which one of the follwing represents the variation of capacitive reactance (XC) with the frequency (v) of the voltage source ? .
A B
B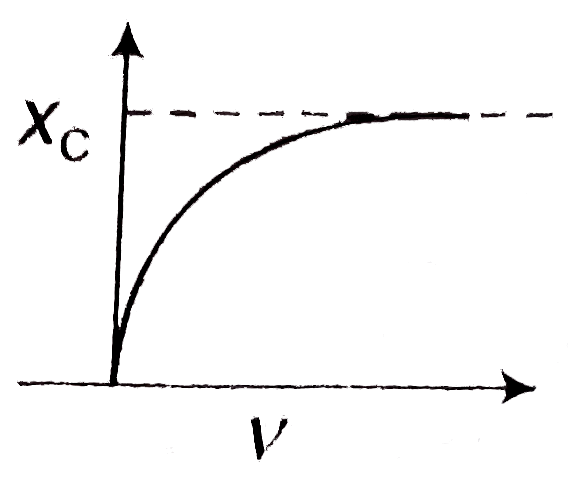 C
C D
D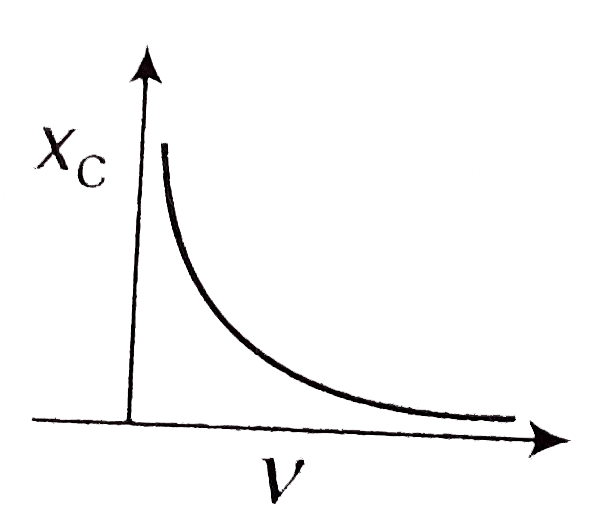
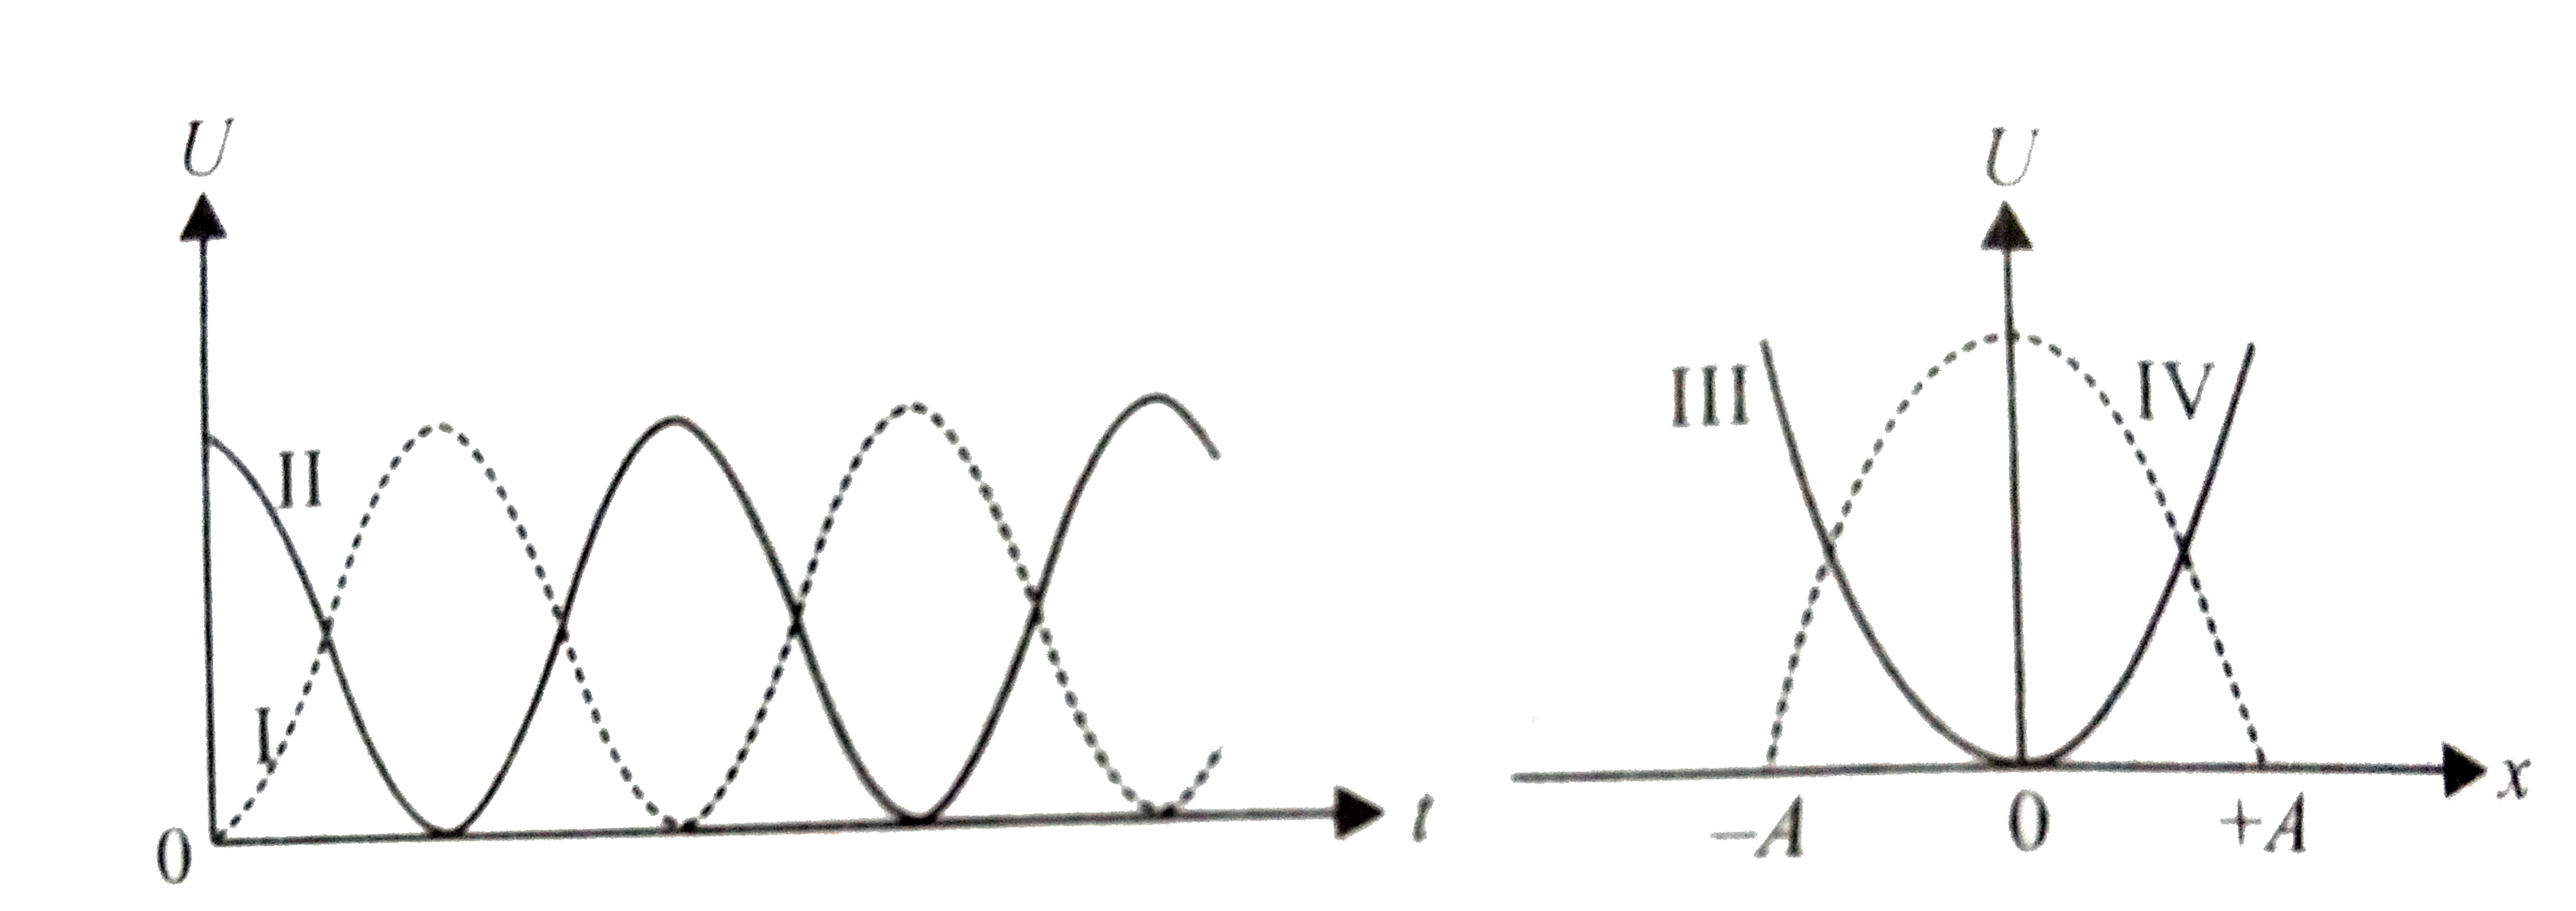
For a particle executing simple harmonic motion, the displacement x is given by x=Acosωt. Identify the graph, which represents the variation of potential energy (U) as a function of time t and displacement x.
View SolutionWhich of the following graphs represent the correct variation of inductive reactance XL with frequency υ?
View SolutionThe given graph shows the variation of velocity with displacement. Which one of the graphs given below correctly represents the variation of acceleration with displacement ?

View SolutionThe velocity -displacement graph of a particle is as shown in the figure. Which of the following graphs correctly represents the variation of acceleration with displacement?

View SolutionWhich of the following graph correctly represents the variation of molar conductance (Δm) with dilution for a strong electrolyte ?
View Solution
