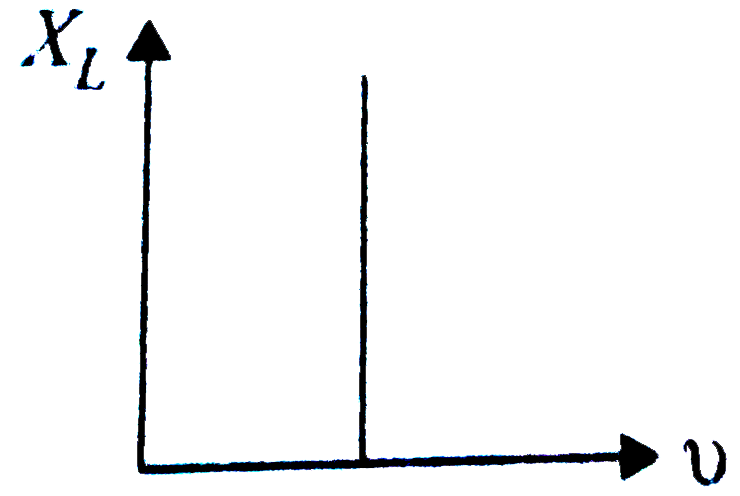
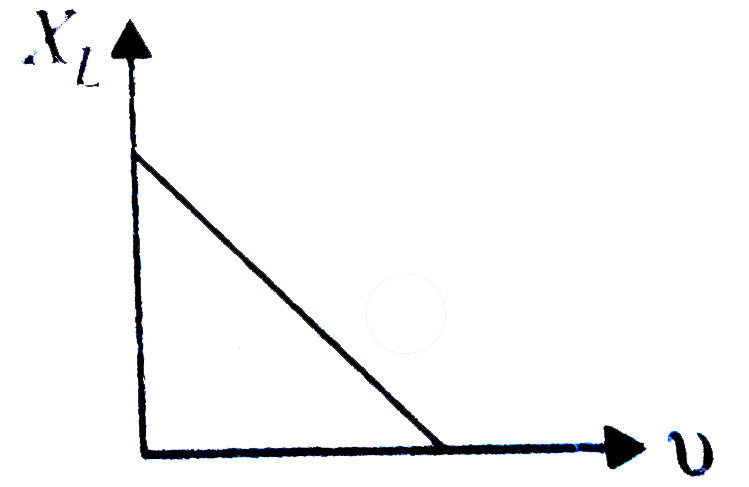
Which of the following graphs represent the correct variation of inductive reactance XL with frequency υ?
A

B

C
D
Video Solution
Text Solution
The correct Answer is:B
Inductive reactance,
XL=ωL=2πυL⇒XL∝υ
Hence, unductive reactance increases linearly with frequency.
|
Updated on:21/07/2023
Topper's Solved these Questions
- BOOK - NCERT FINGERTIPSCHAPTER - ALTERNATING CURRENT EXERCISE - Ac Voltage Applied To A Capacitor12videos
ALTERNATING CURRENT
- BOOK - NCERT FINGERTIPSCHAPTER - ALTERNATING CURRENT EXERCISE - Ac Voltage Applied To A Series Lcr Circuit28videos
ALTERNATING CURRENT
- BOOK - NCERT FINGERTIPSCHAPTER - ALTERNATING CURRENT EXERCISE - Assertion And Reason15videos
ALTERNATING CURRENT
- BOOK - NCERT FINGERTIPSCHAPTER - ATOMS EXERCISE - Assertion And Reason15videos
ATOMS
Similar Questions
Knowledge Check
- Question 1 - Select One
Which of the following represents the correct order of decreasing inductive effect:
A−⊕NH3>−NO2>−BrB−⊕NH3>−Br>−NO2C−Br>−NO2>−⊕NH3D−NO2>−Br>−⊕NH3 - Question 2 - Select One
Graph between velocity and displacement is shown in the following figure:
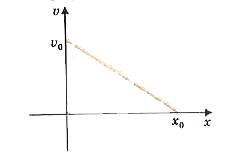
Which of the following graphes represents the correct variation of acceleration with displacementA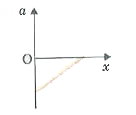 B
B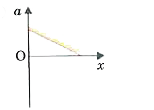 C
C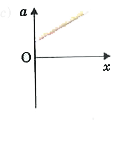 Dnone
Dnone - Question 3 - Select One
Which one of the follwing represents the variation of capacitive reactance (XC) with the frequency (v) of the voltage source ? .
A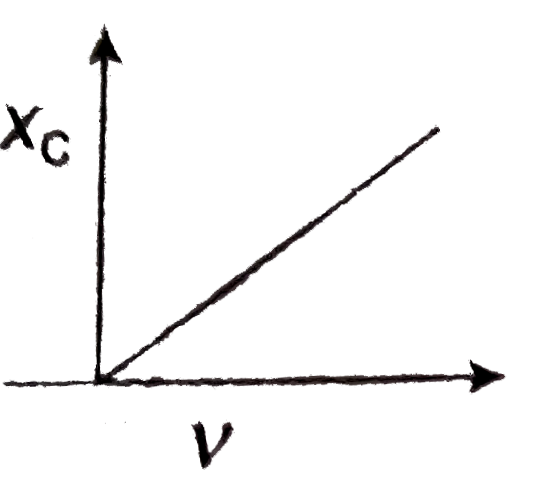 B
B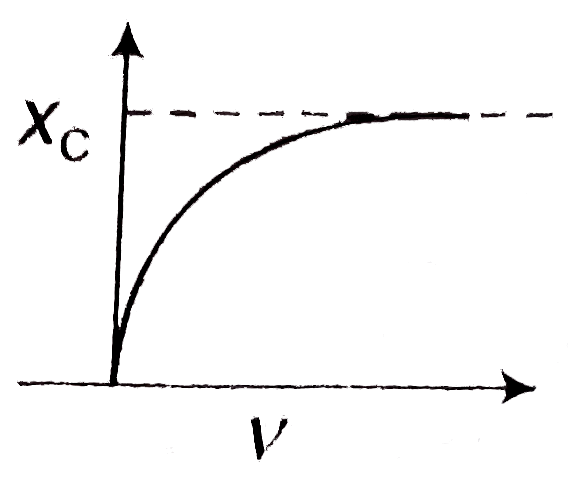 C
C D
D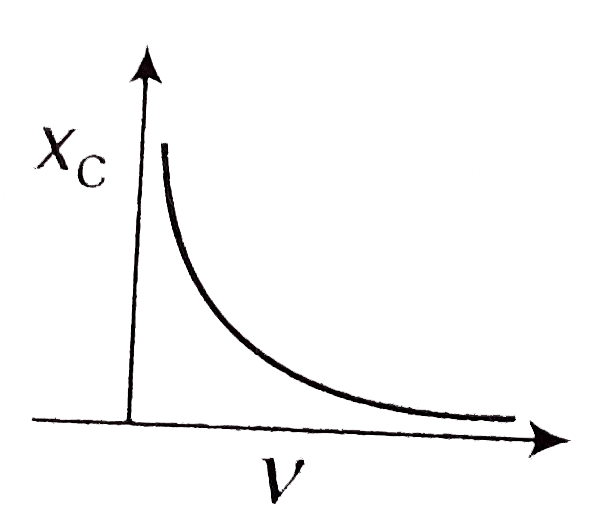
Which of the following graphs represent the variation of current(I) with frequency (f) in an AC circuit containing a pure capacitor?
View SolutionIdentify the graph which correctly reperesents the variation of capacitive reactance XC with frequency
View SolutionWhich of the following graphs best represents the variation of acceleration 'a' with displacement x?
View SolutionWhich of the following graphs represents the variation of activity (A) of a radioactive substance with time (t).
View Solutionwhich of the following graph represents the variation of resistivity (ρ) with temperature (T) for copper?
View Solution


