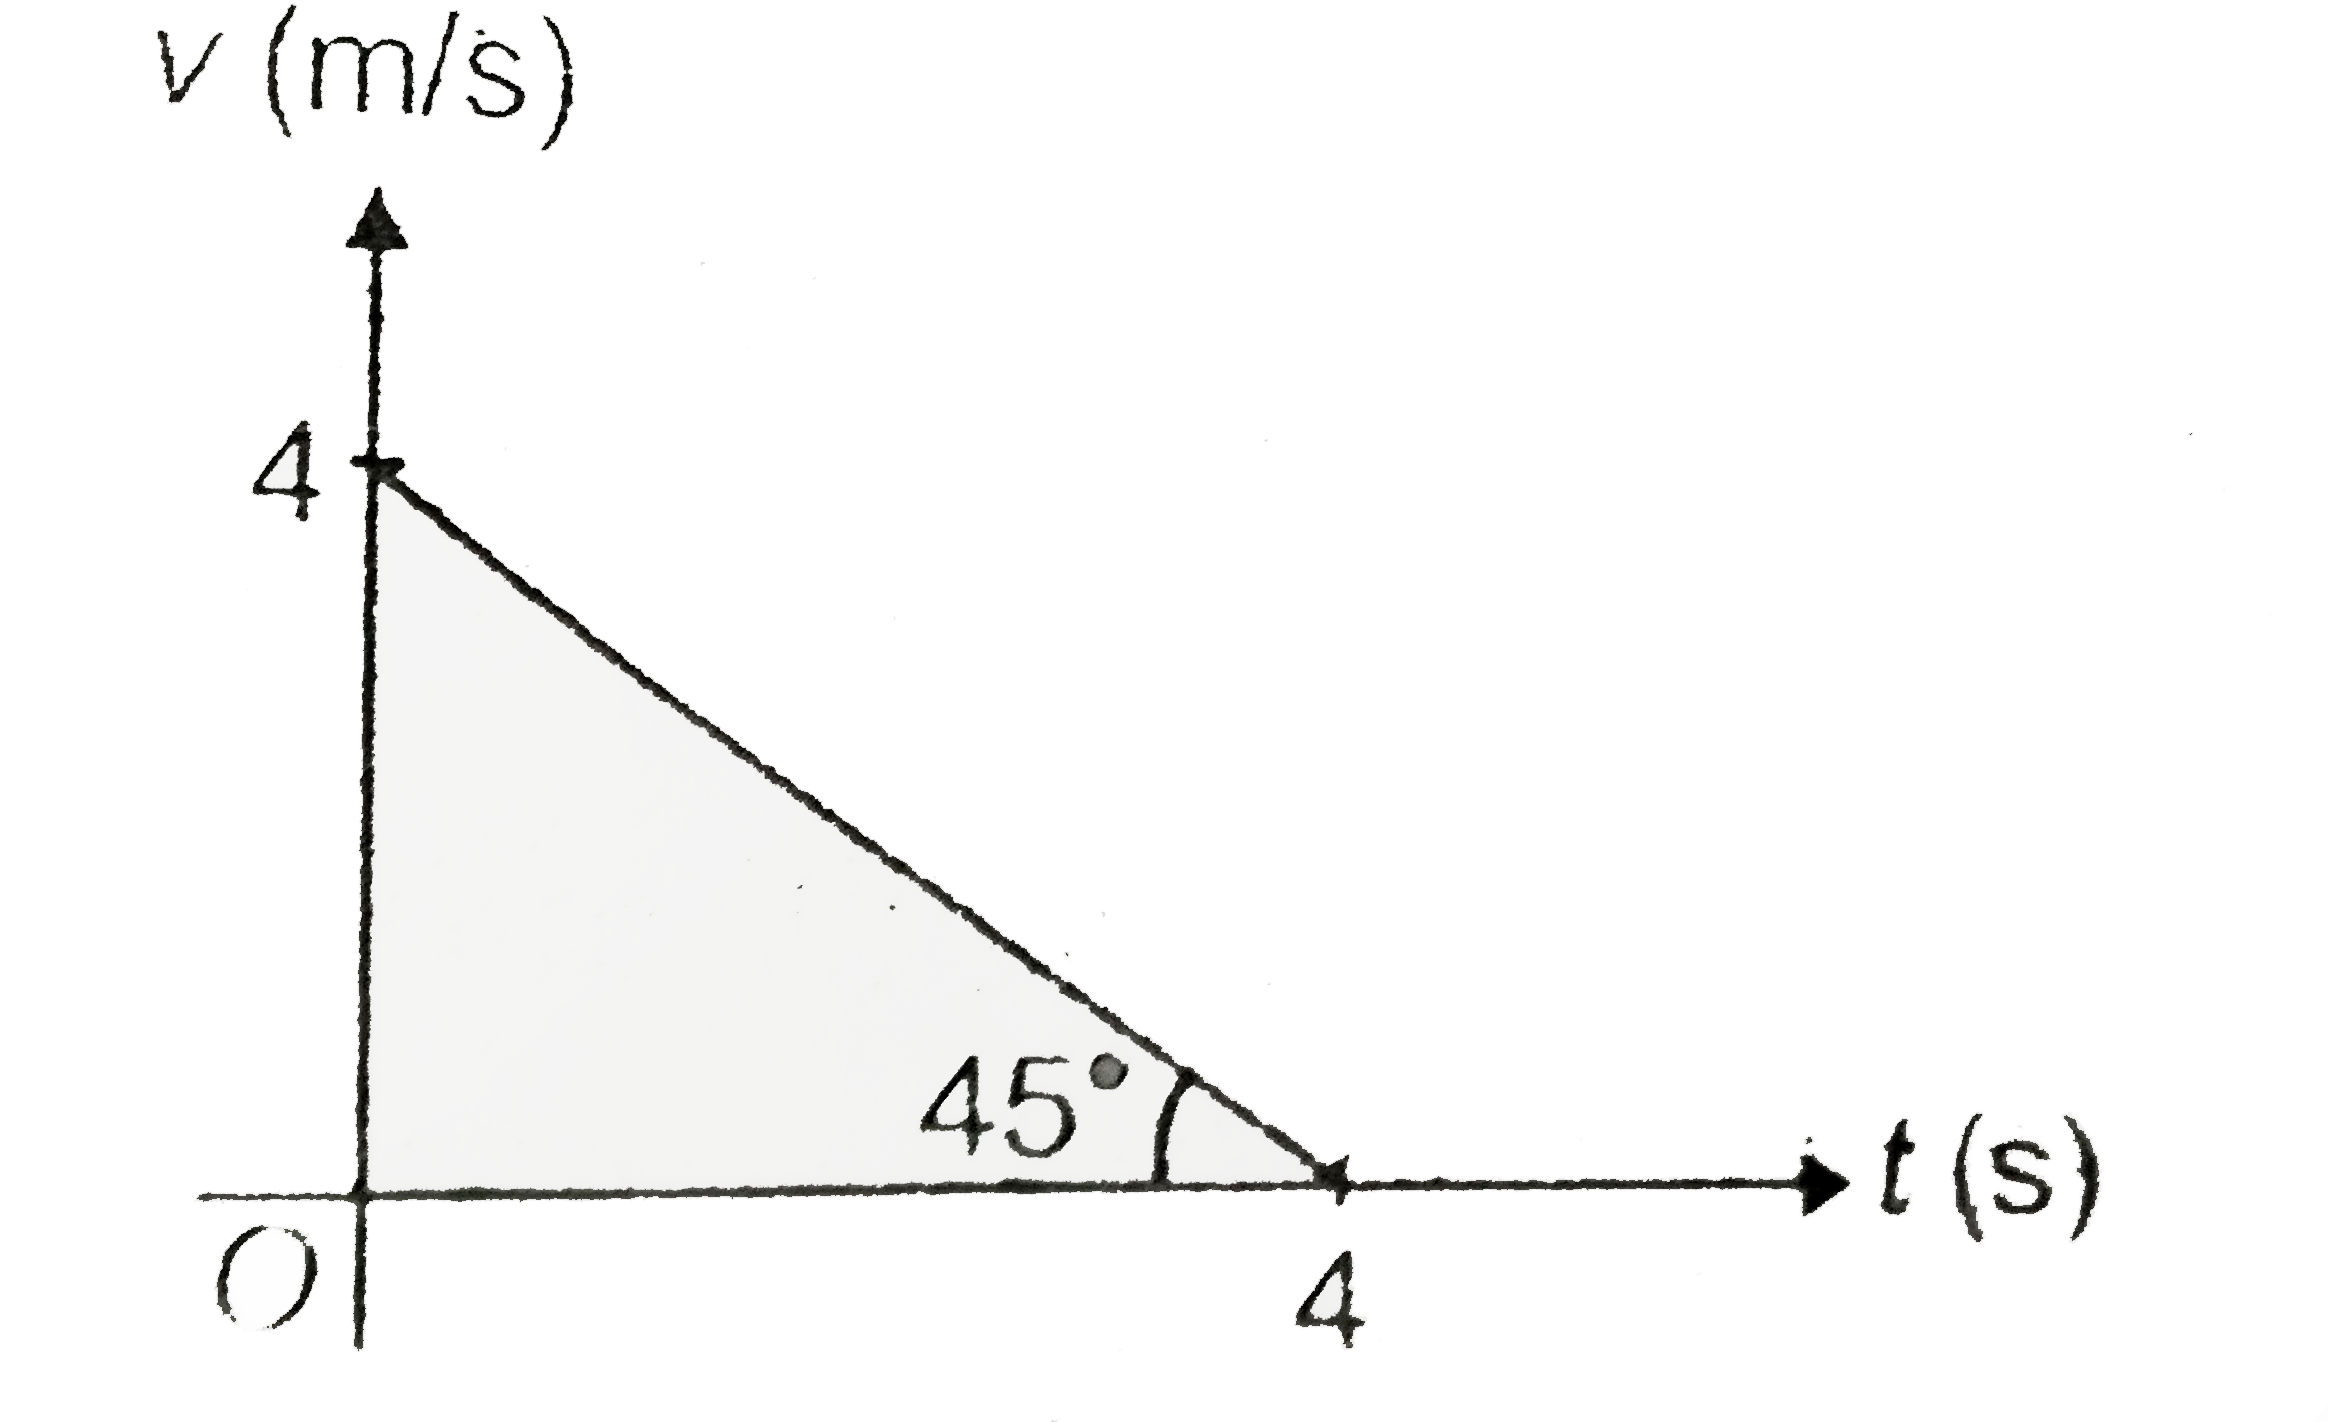
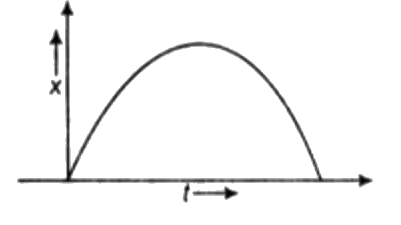
If decrease in velocity is same in equal interval of time, then draw x → t graph.Solution in Gujrati
Step by step video & image solution for If decrease in velocity is same in equal interval of time, then draw x to t graph. by Physics experts to help you in doubts & scoring excellent marks in Class 11 exams.
Topper's Solved these Questions
- BOOK - KUMAR PRAKASHANCHAPTER - MOTION IN A STRAIGHT LINE EXERCISE - SECTION-B58videos
MOTION IN A STRAIGHT LINE
- BOOK - KUMAR PRAKASHANCHAPTER - MOTION IN A STRAIGHT LINE EXERCISE - SECTION-C43videos
MOTION IN A STRAIGHT LINE
- BOOK - KUMAR PRAKASHANCHAPTER - MOTION IN A STRAIGHT LINE EXERCISE - QUESTION PAPER11videos
MOTION IN A STRAIGHT LINE
- BOOK - KUMAR PRAKASHANCHAPTER - MECHANICAL PROPERTIES OF FLUIDS EXERCISE - QUESTION PAPER (SECTION -C)3videos
MECHANICAL PROPERTIES OF FLUIDS
- BOOK - KUMAR PRAKASHANCHAPTER - OBJECTIVE QUESTIONS AS PER NEW PAPER STYLE EXERCISE - CHAPTER - 8 (Match Type questions)5videos
OBJECTIVE QUESTIONS AS PER NEW PAPER STYLE
Similar Questions
A car is moving along a straight line, say OP in It move from O to P in 18 s and returns from P to Q in 6s, where OP=360 m and OQ=240 m. What are the average velocity and average speed of the car in going (a) from O to P ? And (b) from O to P and back to Q ?
04:32View SolutionWhat is acceleration ? What is the direction ? Also gives its unit.
08:20View SolutionDefine frame of reference and give its types.
04:18View SolutionGlycerine flows steadily through a horizontal tube of length 1.5m and radius 1.0 cm . If the amount of glycerine collected per second at one is 4.0×10⁻³kgs−1 , what is the pressure difference between the two ends of the tube ? (Density of glycerine =1.3×10103kgm−3 and viscosity of glycerine =0.83 Pa s). [ you may also like to check if the assumption of laminar flow in the tube is correct]
04:27View SolutionType of satellites are given in Column-I and their uses are given in Column-II. Match them properly :
Column-IColumn-II(1) Polar satellite(a) Tele communication(2) Geo-stationary satellite(b) Investigation(c) For information about atmosphere03:26View SolutionConsiedr the following x-t garaph to be parabolic. Draw the velocity-time graph and acceleration-time graph analyze the motion of the particle regarding its velocity and acceleration. .
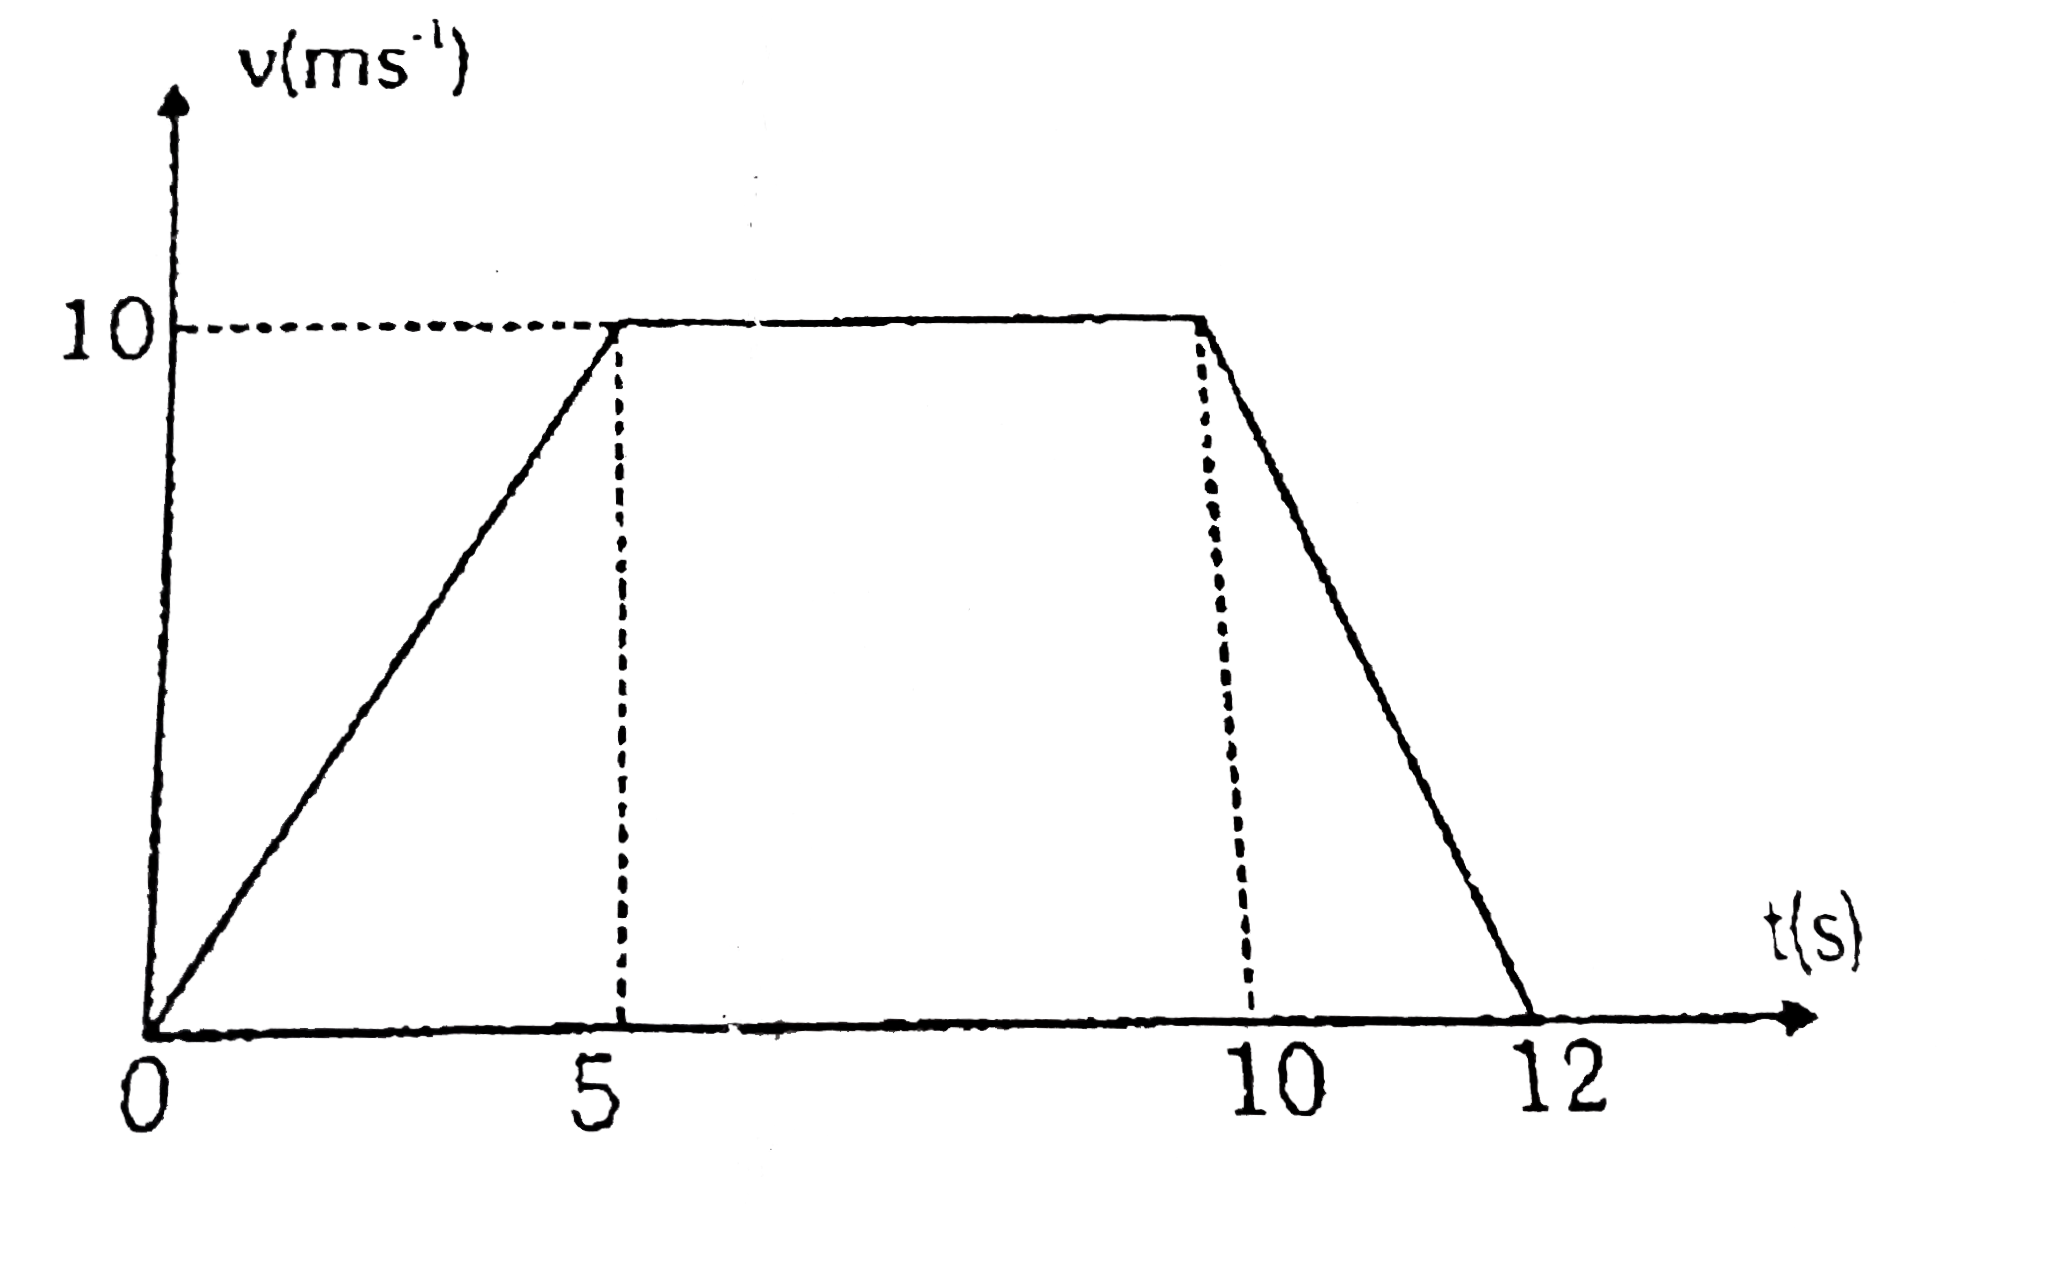
04:58View SolutionStudy the following velocity-time graph. Determine the displacement and distance in the time interval t=0 to t=12 s . Sketch the acceleration-time graph.
03:52View SolutionDraw displacement time and acceleration -time graph for the given velocity-time graph
 01:49View Solution
The velocity-time graph is given below

Draw the acceleration-time graph and position-time graph, given that at t = 0, particle is at origin.01:55View Solutionएकसमान गति का अर्थ समझाइए । इसके लिए वेग - समय ग्राफ खींचिए । बताओ कि इस ग्राफ की सहायता से किसी समय अंतराल में वस्तु का विस्थापन कैसे ज्ञात करते है ?
02:13View Solutionसिद्ध कीजिए कि एकसमान त्वरित गति में वेग - समय ग्राफ तथा समय अक्ष के बीच घिरा क्षेत्रफल उस समय - अंतराल में वस्तु के विस्थापन के बराबर होता है ।
02:35View SolutionThe displacement -time (x– t) graph of a body is given as

The corresponding velocity -time (v – t ) graph will be05:21View SolutionDraw the x→t graphs which represent the positive, negative and zero velocity
 06:54View Solution
Draw v to t graph for constant velocity and explain it.
09:23View SolutionDraw the velocity-time graph for an object in uniform motion. Show that the area under the velocity-time graph gives the displacement of the object in the given time interval.
03:30View Solution

