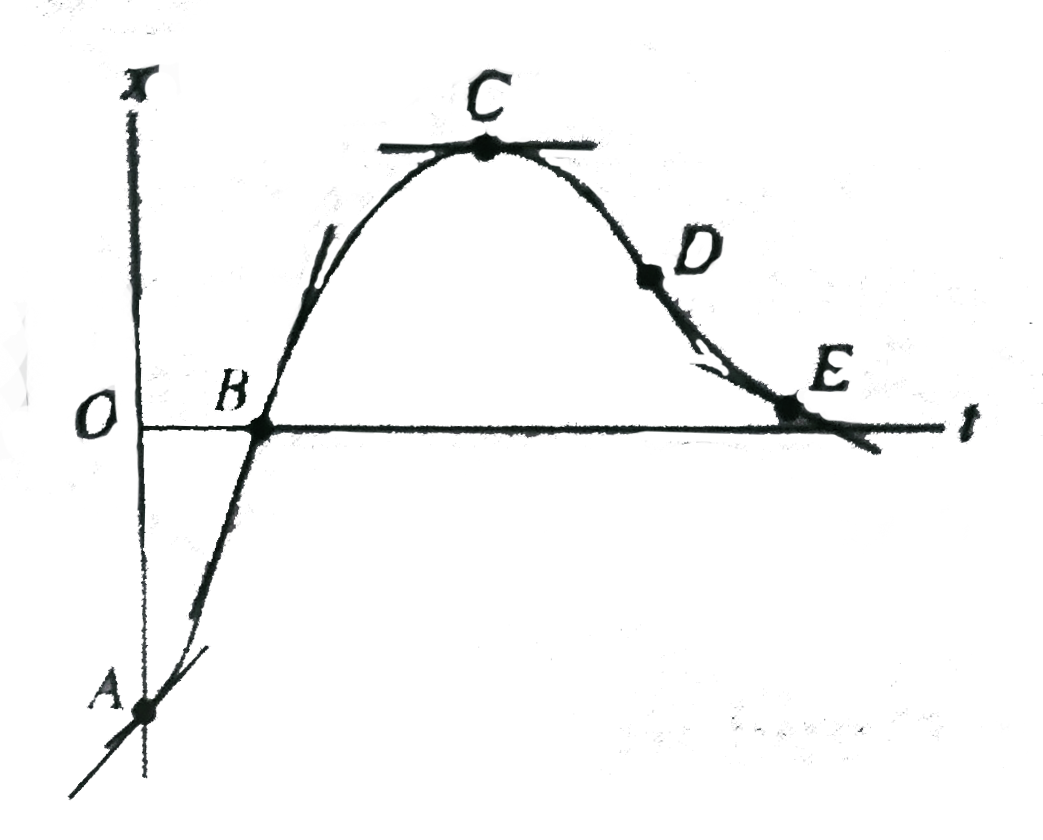
Consiedr the following x−t garaph to be parabolic. Draw the velocity-time graph and acceleration-time graph analyze the motion of the particle regarding its velocity and acceleration.
 .
.
Video Solution
Text Solution
Velocity -time graph and acceleration-time graph are as shon in figs. and .
 .
.
 .
.
Analysis of motion
a. Between points A and B: Between these points, x has negative value, it means the particle is to the left of the origin. But the value of x is decteasing , so the particle is moving towards the origin. It means the velocty of particle is positives.
 .
.
Between these points, the slope of the x−t graph is increasing, it means the magnitude of velocity is increasing. It means the velocity and acceleration both are in the same dirction. So acceleration is positiove. Note that acceleration is constant between A and B.
b. At out B: Porticle is at origin at this point. At this point, the slope of the x−t fraph is maximum so velocity is maximum at this point. Before point B, acceleration is positive, but aftre point B acceleration eill be negative as the slope of the x−t graph eill stat decrereasing after this,
 .
.
We cannot define acceleration at point B.
c. Between points B and C: Between these points, x has positive value, it means the particle is to the right of the origin . But the value of x is increasing, so the particle is moveing away from the origin. It means the velocity of the paarticle is positive.
 .
.
Between these points, the slope of the x−t fraph is decreasing, is means the magnitude of velocity is dectrasing. It means the velocity and acceleration are in opposite directions. So the between B and C.
Also the fraph is concave down, so acceleration is negative.
d. At point C: Particle is maximum away the origin at this point. At this point, the slope of the x−t graph zero, so velocity is zero. But acceleration is negative as the graph is concave down. at this point, the particle will change its direction of motion.
 .
.
So after this, the particle will start moving towards the origin.
e. Between poinsts C and D : Between these points x has positive value, it means the particle is to the to right of the origin. But the value of x is decreasing so the particle is moving towards the origin. It means the velocity of the particle is negative.
 .
.
Between these points, the magnitude of slope of the x−t graph is increasing, it means the magniude of velocity is increasing, but in the negative direction. so acceleration is negative. Note that acceleration is constant between c and D,
Alos the graph is concave down, so acceleration is negative.
f. At point D: Particle is to the right of the origin of the origin at this point. At this point, the slope of the x−t graph is negative maximum, so veloity is maximum at this point in the neative direction. Before point D, acceleration is negative, but after point D, acceleration will be positive (as the graph is concave up after D. We cannot define acceleration at point D.
f. Between points D and E: Between these point, x has positive value, it means the particle is to the right of the origin. But the value of x is decreasung, so the particle is moving towards the origin. It means the velocity of the particle is negative.
Between these points, the magnitude of the slope of the x−t gragh is decteasing, it means the magnitude of velocity is decreasing, but in the negative direction. So acceleration is positive. Note graph is concave up, so acceleration is positive.
|
Updated on:21/07/2023
Topper's Solved these Questions
- BOOK - CENGAGE PHYSICSCHAPTER - KINEMATICS-1EXERCISE - Solved Examples9videos
KINEMATICS-1
- BOOK - CENGAGE PHYSICSCHAPTER - KINEMATICS-1EXERCISE - Exercise 4.117videos
KINEMATICS-1
- BOOK - CENGAGE PHYSICSCHAPTER - GRAVITATIONEXERCISE - INTEGER_TYPE1videos
GRAVITATION
- BOOK - CENGAGE PHYSICSCHAPTER - KINEMATICS-2EXERCISE - Exercise Integer9videos
KINEMATICS-2
Similar Questions
Knowledge Check
- Question 1 - Select One
Assertion : For a particle, acceleration-time graph gives the velocity.
Reason : Rate of change of velocity is acceleration.AIf both assertion and reason are trure and reason is the correct explanation of assertion.BIf both assertion and reason are true but reason is not the correct explanations of assertion.CIf assertion is true but reason is false.DIf both assertion and reason is false - Question 2 - Select One
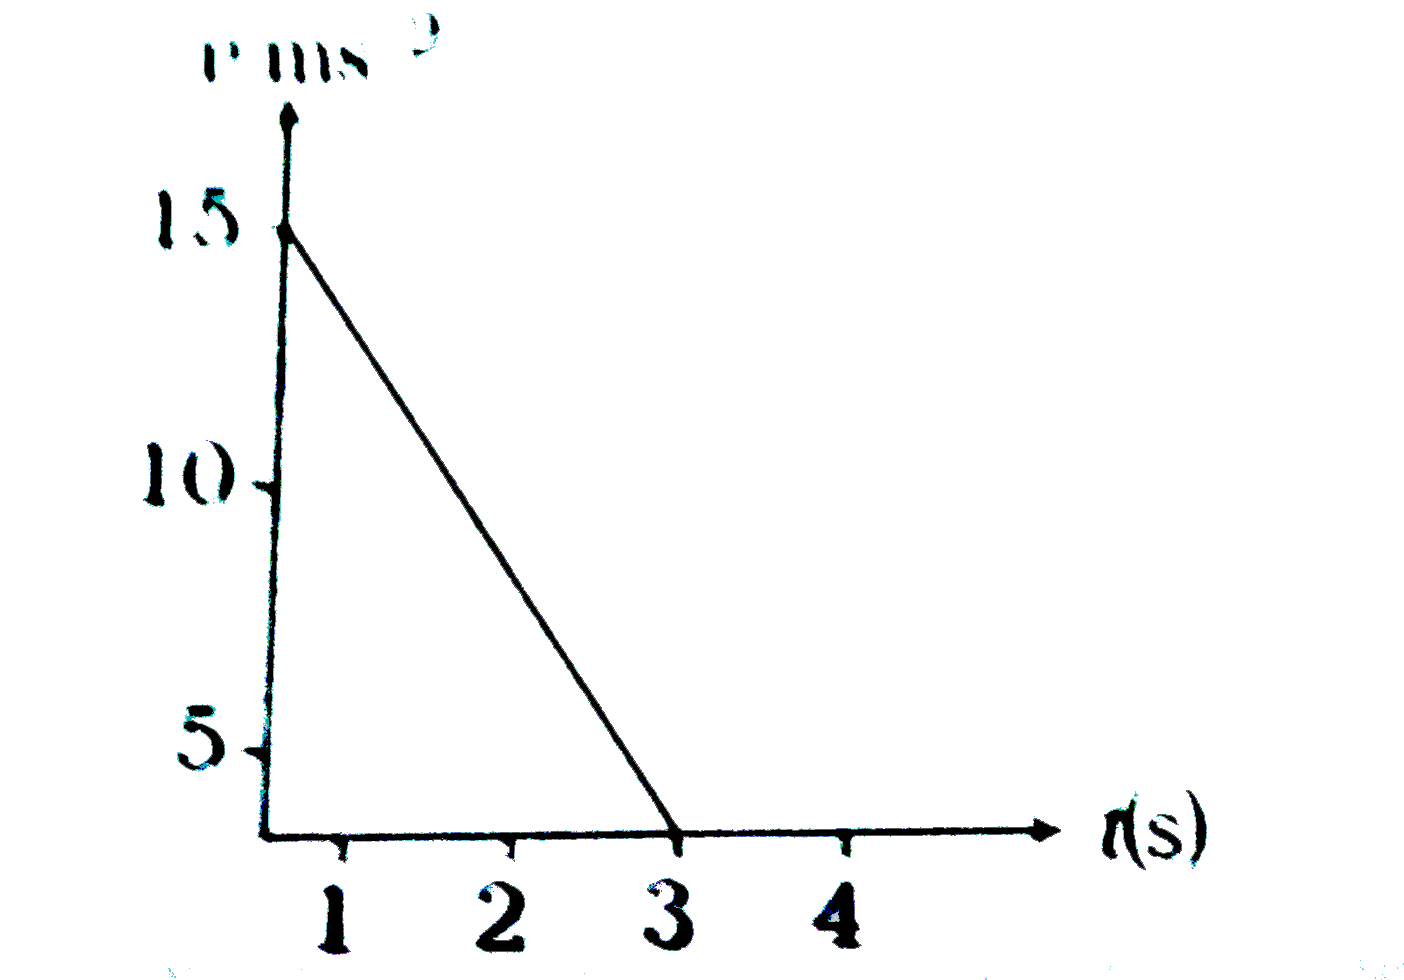
The velocity - time graph is shown in the figure, for a particle. The acceleration of particle is
 A22.5ms−2B5ms−2C−5ms−2D−3ms−2
 - Question 3 - Select One
The velocity - time graph of a body is given in figure below .
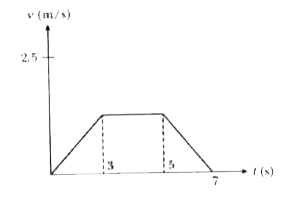
The acceleration-time graph of the motion of the body isA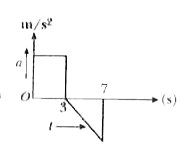 B
B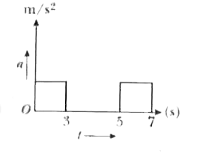 C
C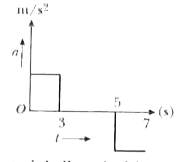 D
D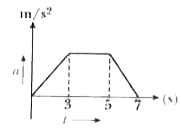
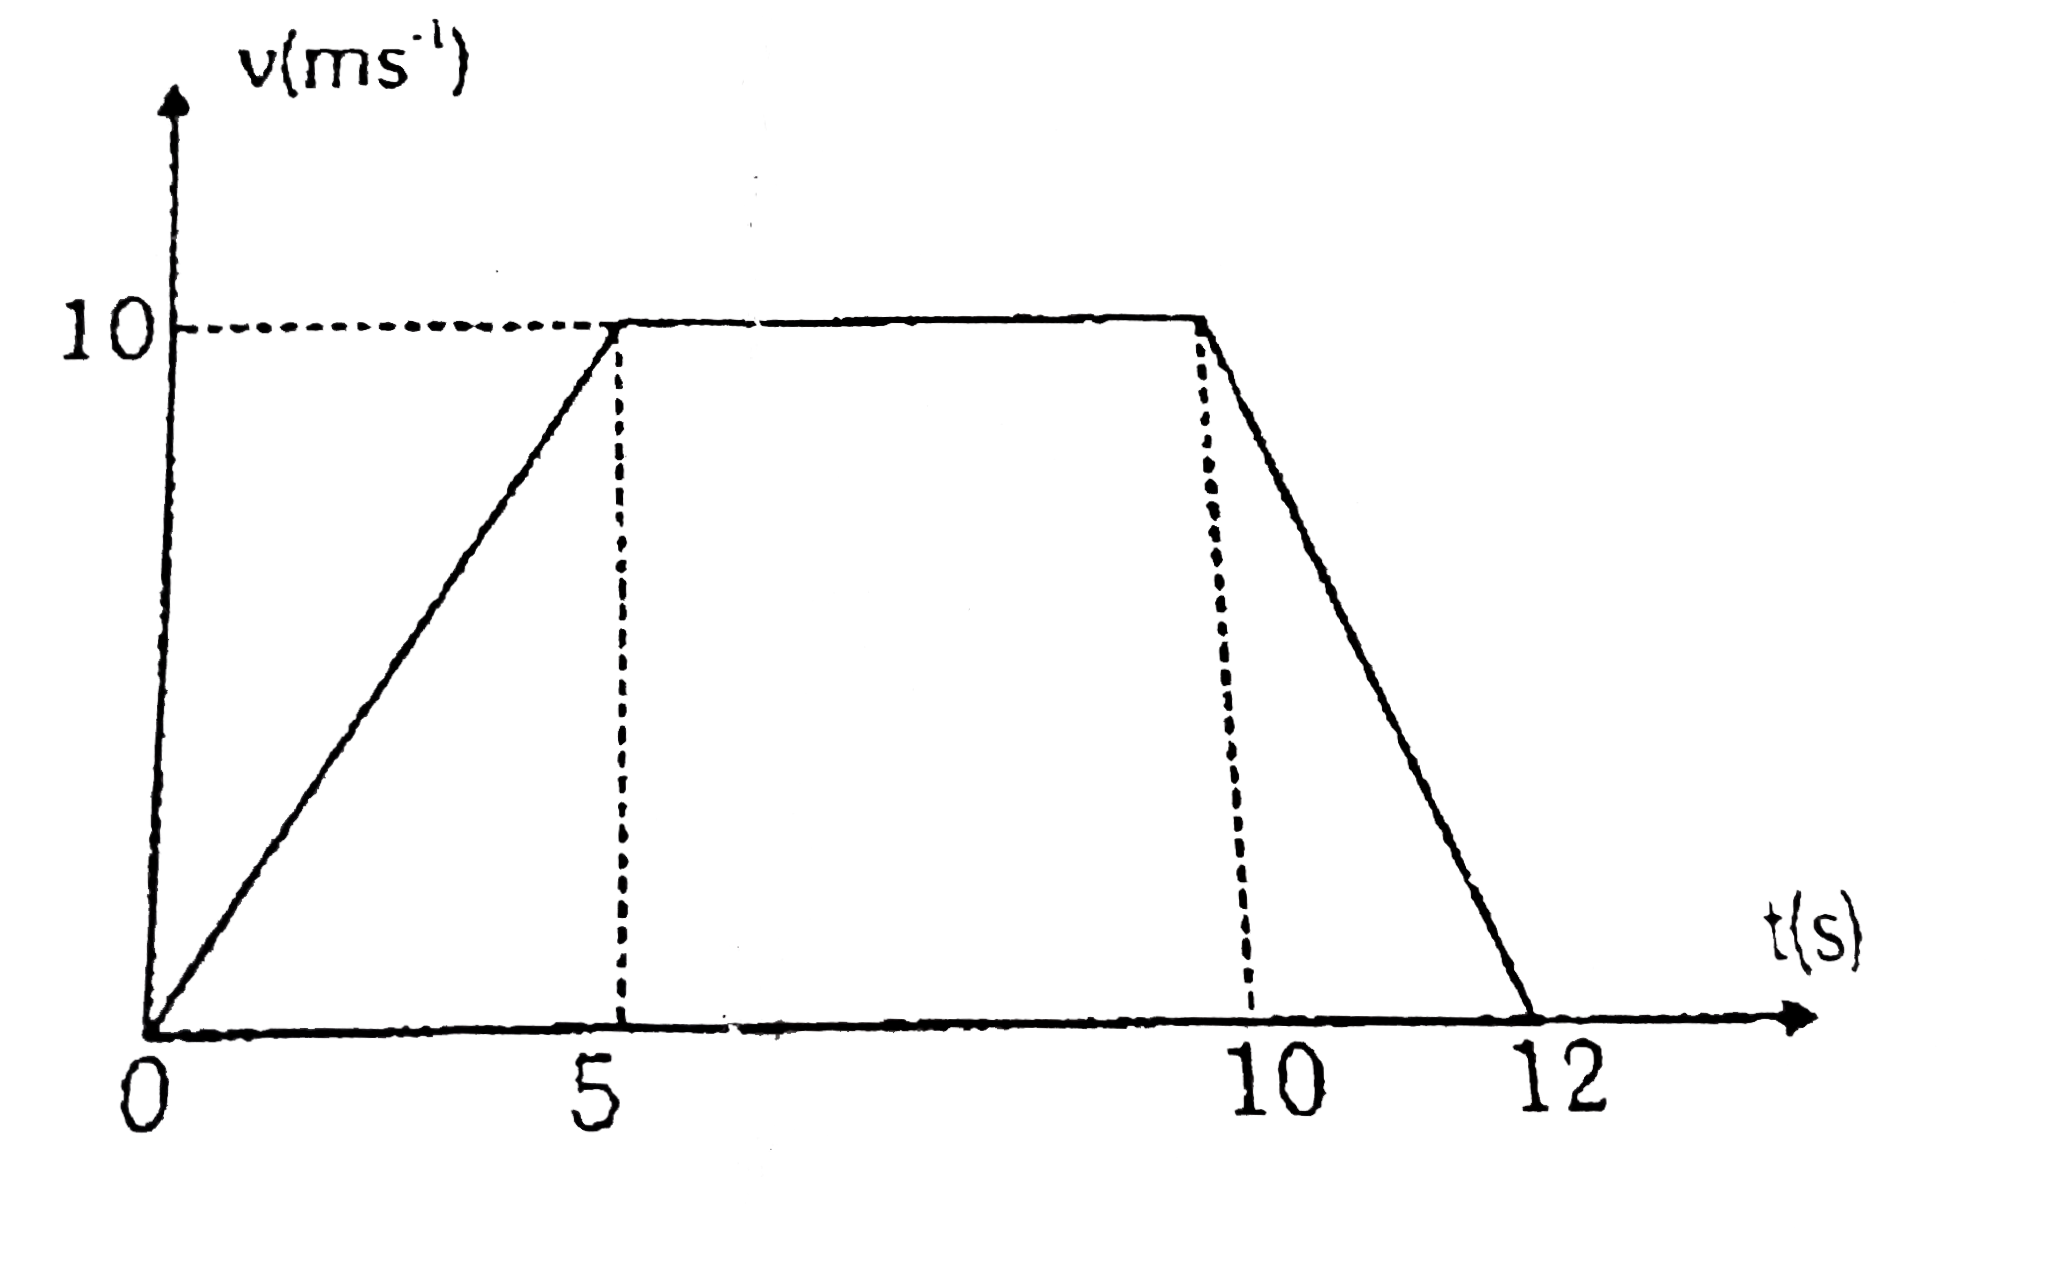
The velocity-time graph is given below
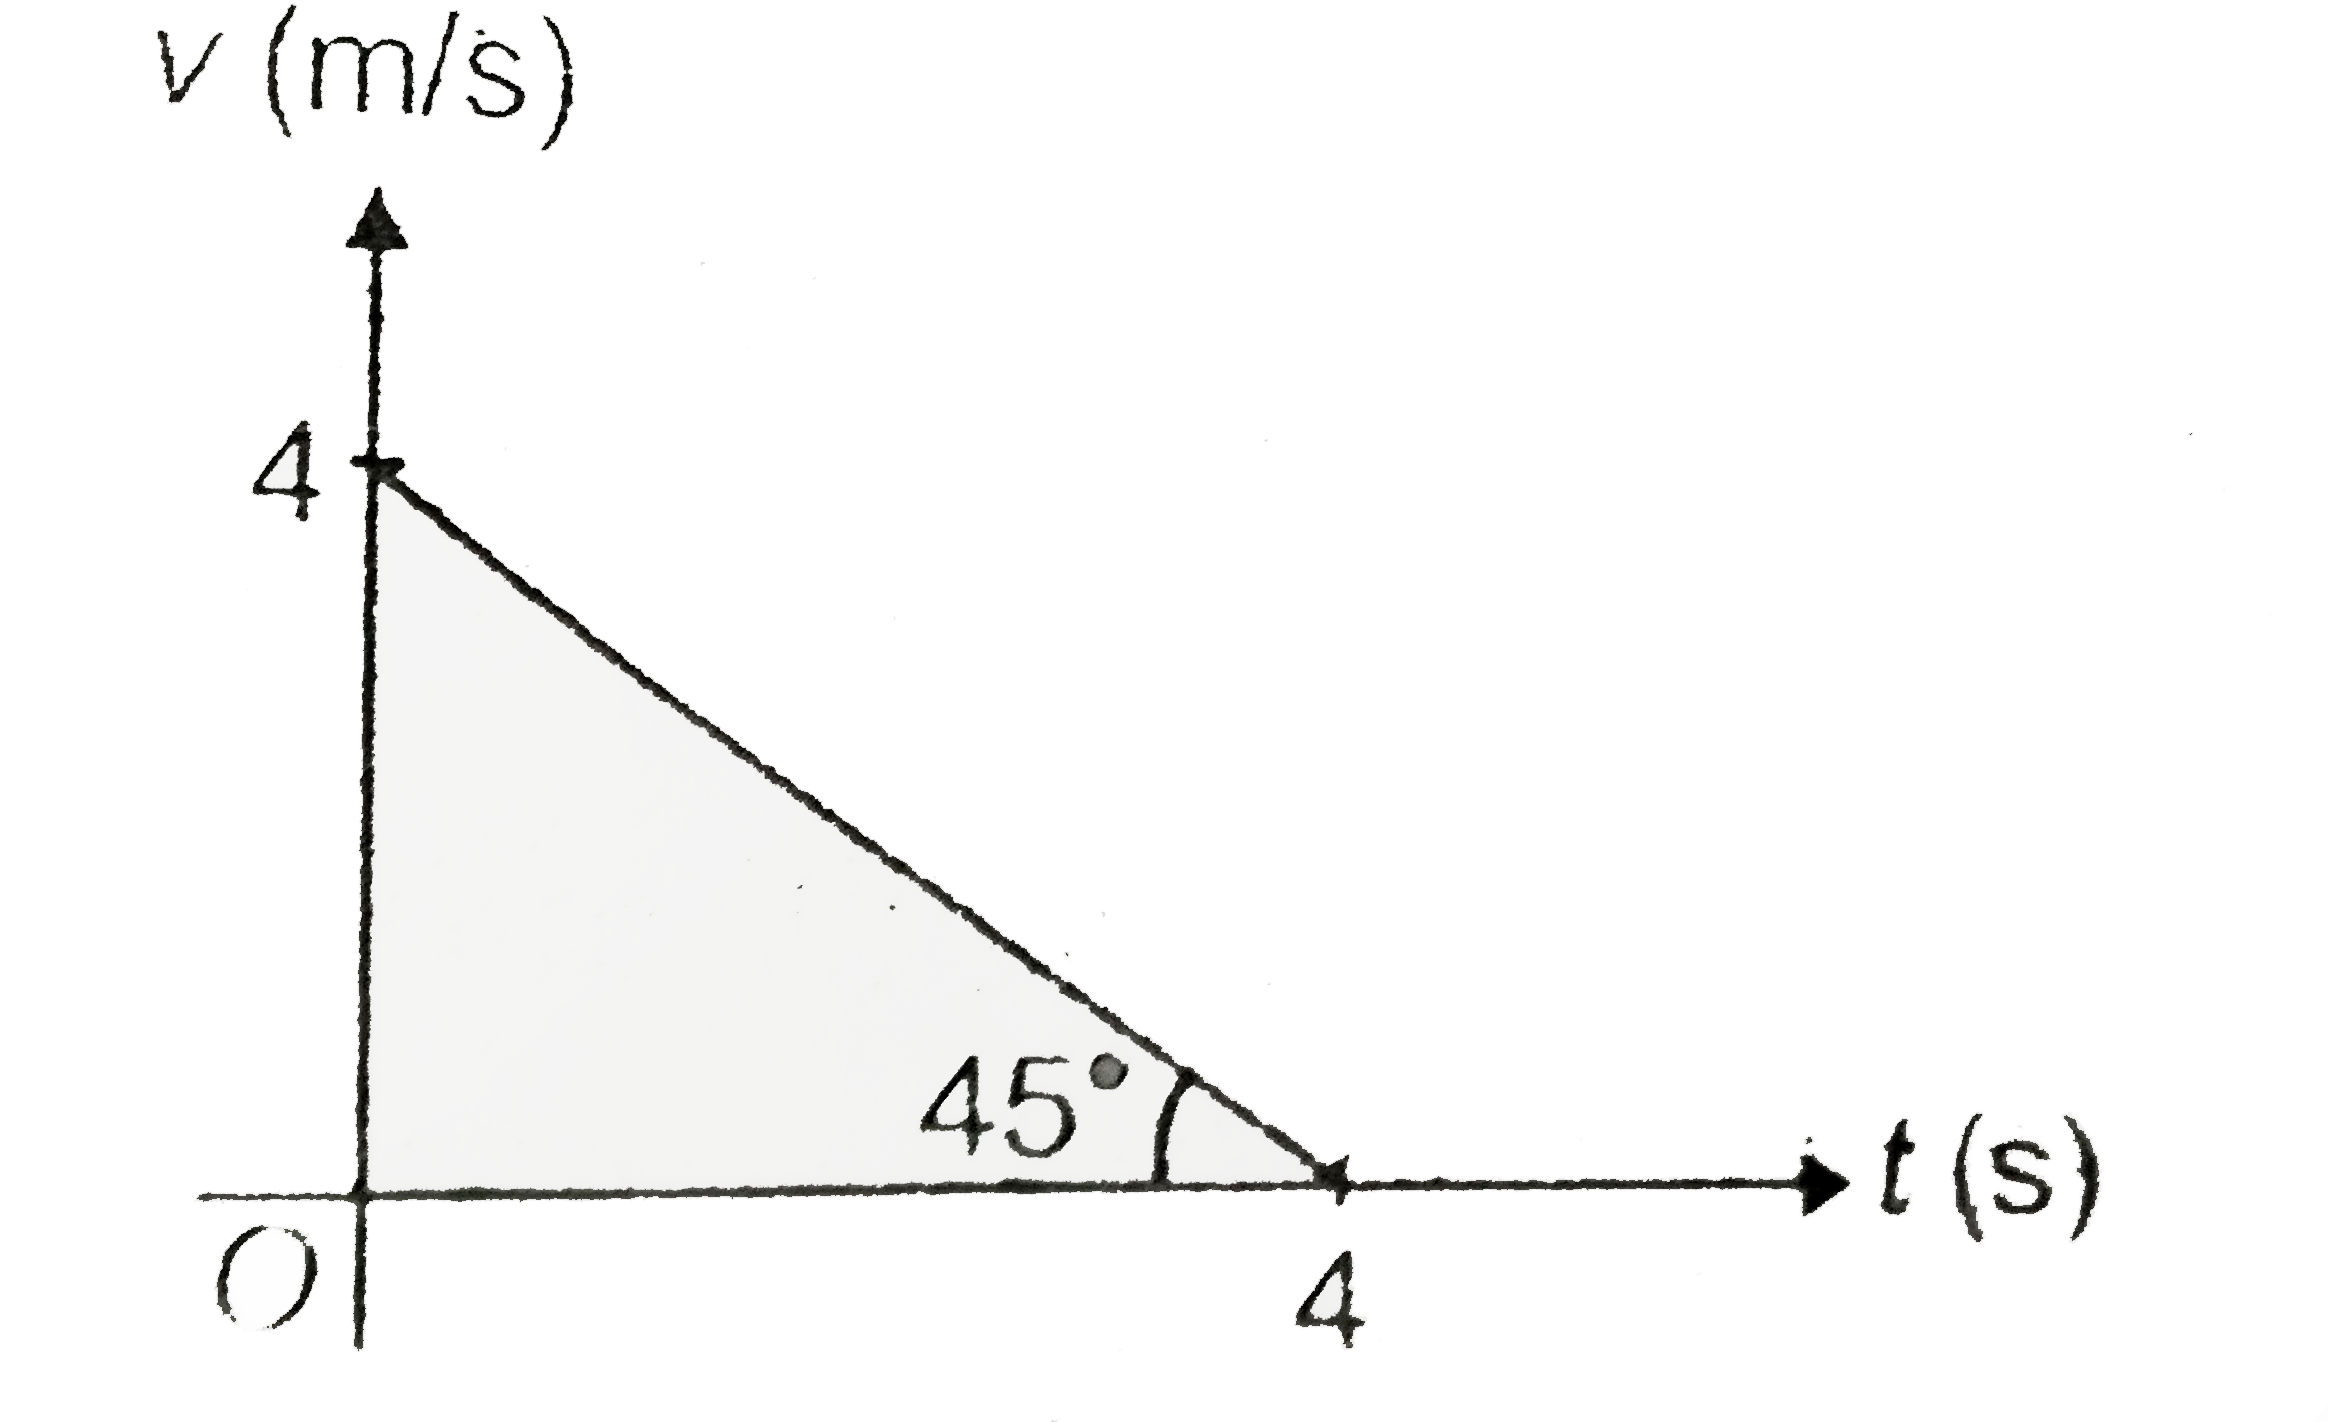
Draw the acceleration-time graph and position-time graph, given that at t = 0, particle is at origin.View SolutionRepresent the velocity-time graph for a uniformly accelerated motion when acceleration is positive.
View SolutionDraw the velocity-time graph of an object moving with uniform negative acceleration.
View SolutionDraw displacement-time, velocity-time and acceleration-time graphs for a particle executing simple harmonic motion. Discuss their phase relationship.
View SolutionThe velocity-time graph of a moving particle is given below. The acceleration of the particle at t = 5 s will be
View Solution


