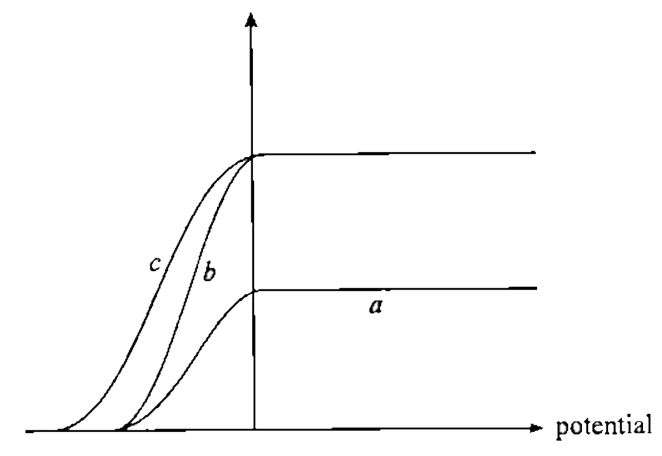
In a photoelectric effect, the anode potential is plotted against the plate current  Solution in Marathi
A and B will have different intensities while B and C will have different frequencies.
B and C will have different intensities while A and C will have different frequencies.
A and B will have different intensities while A and C will have equal frequencies.
A and B will have equal intensities while B and C will have different frequencies.
The correct Answer is:A
Step by step video & image solution for In a photoelectric effect, the anode potential is plotted against the plate current by Physics experts to help you in doubts & scoring excellent marks in Class 11 exams.
Updated on:21/07/2023Topper's Solved these Questions
- ELECTRONS AND PHOTONSBOOK - TARGET PUBLICATIONCHAPTER - ELECTRONS AND PHOTONSEXERCISE - Competitive Thinking
80 Videos
- COMMUNICATION SYSTEMSBOOK - TARGET PUBLICATIONCHAPTER - COMMUNICATION SYSTEMSEXERCISE - Evaluation Test
15 Videos
- ELECTROSTATICSBOOK - TARGET PUBLICATIONCHAPTER - ELECTROSTATICSEXERCISE - EXCERCISE
156 Videos
Similar Questions
The electrons are emitted in the photoelectricm effect from a metal surface
View SolutionThe critcal frequency for sky wave propagation if maximum number density of electrons in ionosphere is 1010m−3 is
View SolutionElectrostatic means study of
View SolutionIn a photoelectric experiment anode potential is ploted againest plate currect.
View SolutionPlot a graph showing the variation of photoelectric current with anode potential for two light beam of same wavelength but different intensity.
View SolutionExplain why the saturation current in photoelectric effect experiment with a light of one frequency and intensity is independent of the anode potential.
View SolutionIn photoelectric experiment the plot between anode potential and photoelectric current is shown in figure 2.3.1. Which of the following is correct:

View SolutionIn a photoelectric experiment anode potential is plotted against plate current.Then

View SolutionIn photoelectric effect , the curve between photoelectric current and anode potential V (for different frequencies ) is shown in figure , then
View SolutionWhy wave theory of light could not explain the photoelectric effect ? State two reasons. Draw graph between anode potential vs photoelectric current .
View SolutionExplain effect of potential on photoelectric current.
View SolutionAnode potential is plotted relative to the plate current in a photostat.
View SolutionExplain effect of potential on photoelectric current in experiment of photoelectric effect.
View SolutionThe graph shows photoelectric current with anode potential. The potential at .O. is called

View SolutionIn a photoelectric experiment anode potential is ploted against plate current.

View Solution
