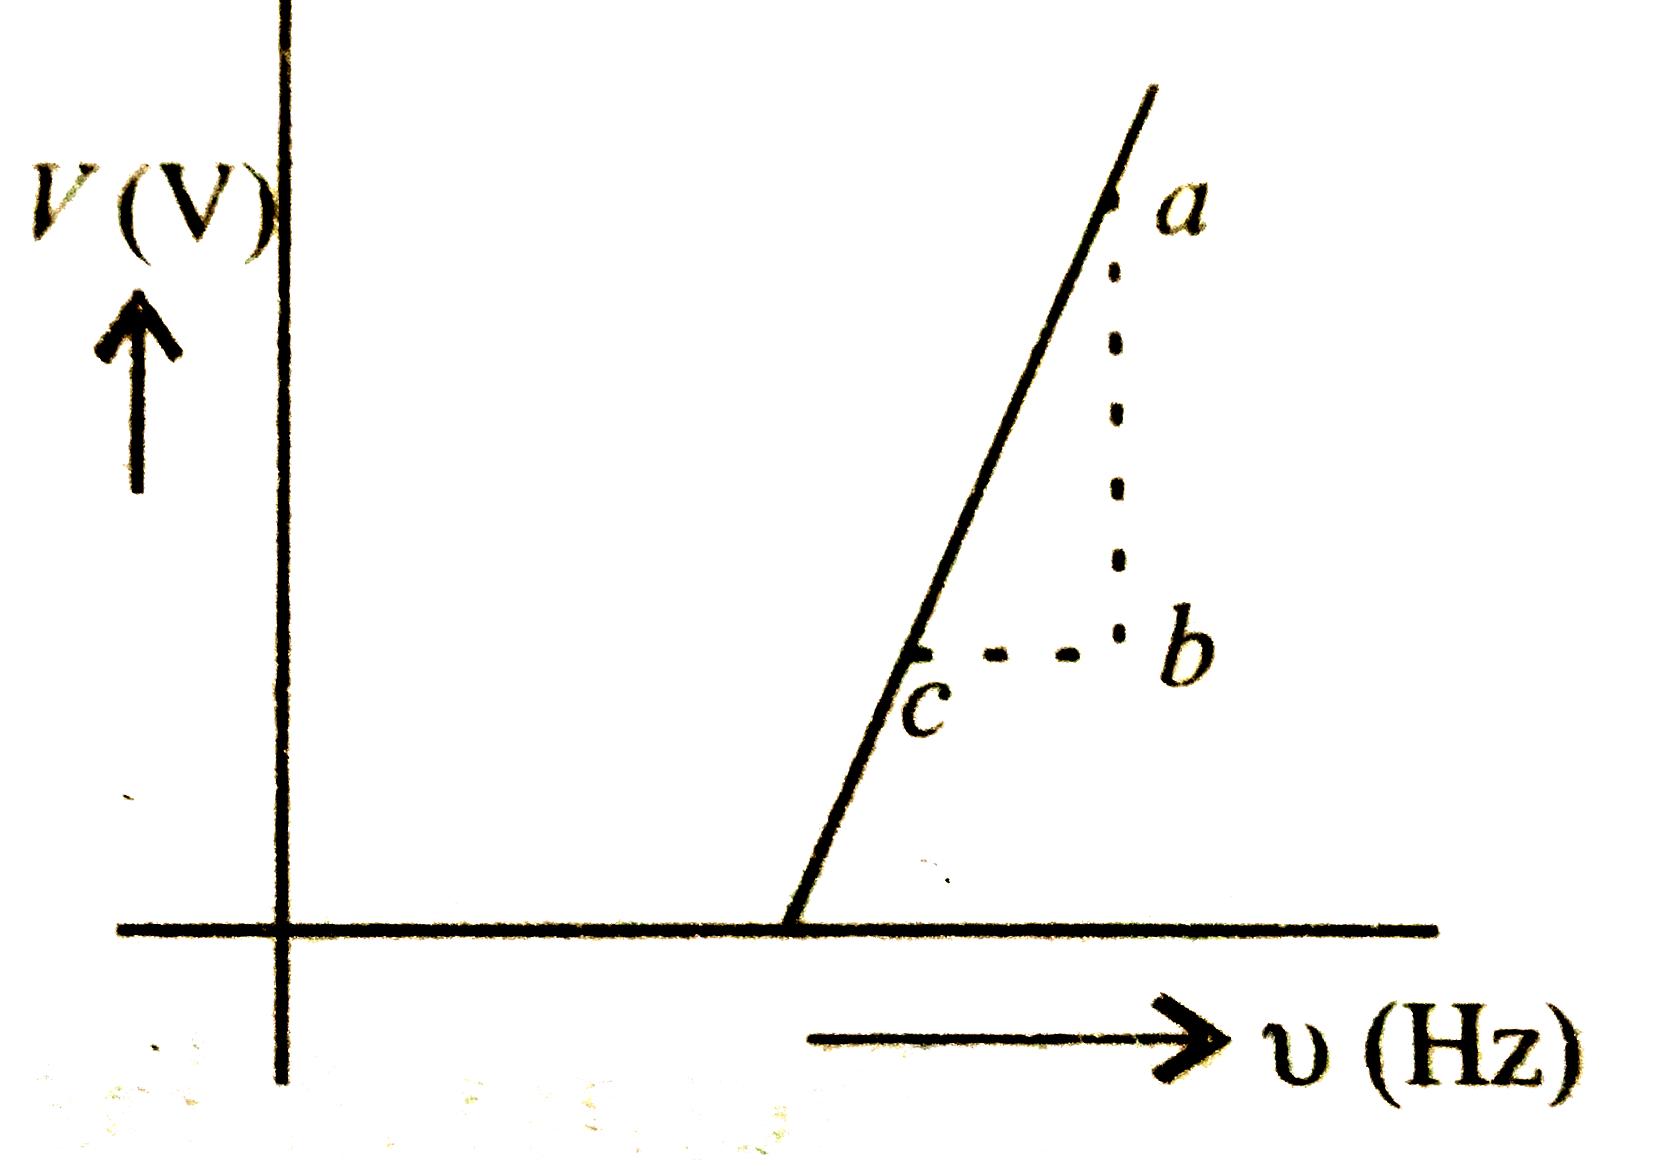
In a photoelectric experiment, the graph of frequency v of incident light (in Hz) and stopping potential V (in V) is as shown in the figure. Planck's constant is (e is the elementary charge)
eabbc
ecbac
eacbc
eacab
The correct Answer is:A
(a) : According to Einstein's photoelectric equation
hu=(K.E)max+ϕ0
where ϕ0 is the Planck's constant
Also, (K.E.)max=eV
where e is the elementary charge, V is the stopping potential
eV=hu−ϕ0⇒V=hev−ϕ0e
Hence, the graph between V and v is a straight line and slope of this graph is given by
Slope =he . . . (i)
From the graph in the question Slope =abbc . . . (ii)
From (i) and (ii), we get, h=eabbc
Topper's Solved these Questions
- BOOK - NCERT FINGERTIPSCHAPTER - DUAL NATURE OF RADIATION AND MATTER EXERCISE - Particle Nature Of Light : The Photon19videos
DUAL NATURE OF RADIATION AND MATTER
- BOOK - NCERT FINGERTIPSCHAPTER - DUAL NATURE OF RADIATION AND MATTER EXERCISE - Wave Nature Of Matter37videos
DUAL NATURE OF RADIATION AND MATTER
- BOOK - NCERT FINGERTIPSCHAPTER - DUAL NATURE OF RADIATION AND MATTER EXERCISE - Experimental Study Of Photoelectric Effect11videos
DUAL NATURE OF RADIATION AND MATTER
- BOOK - NCERT FINGERTIPSCHAPTER - CURRENT ELECTRICITYEXERCISE - Assertion And Reason15videos
CURRENT ELECTRICITY
- BOOK - NCERT FINGERTIPSCHAPTER - ELECTRIC CHARGES AND FIELDSEXERCISE - Assertion And Reason15videos
ELECTRIC CHARGES AND FIELDS
Similar Questions
Knowledge Check
- Question 1 - Select One
In an experiment on photoelectric effect the frequency f of the incident light is plotted against the stopping potential V0. The work function of the metal is given by ( e is the electronic charge)
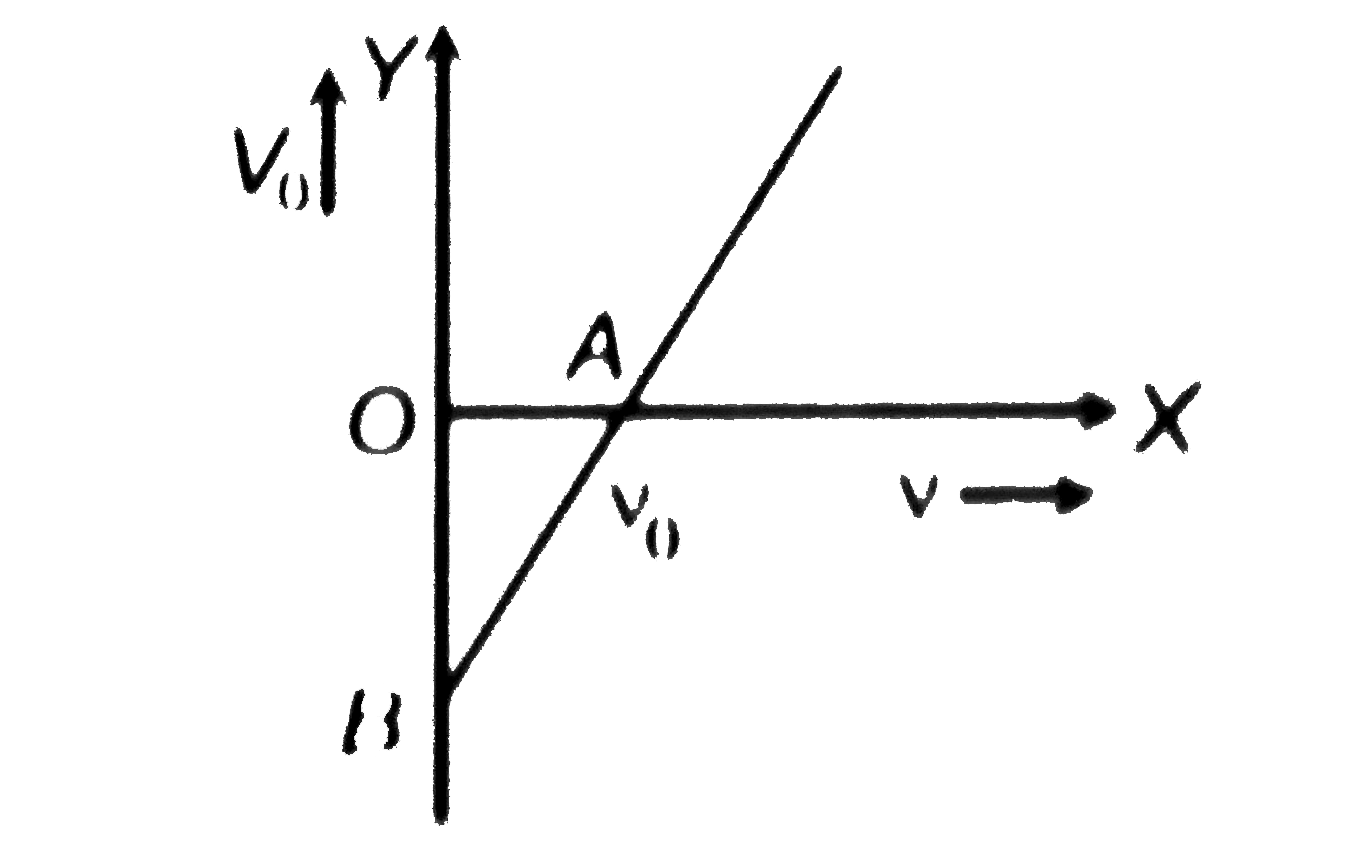 AOB×e in eVBOB in VoltCOA in VoltDThe slope of the line AB
 - Question 2 - Select One
Which of the following is the graph between the frequency (v) of the incident radiations and the stopping potential ?
A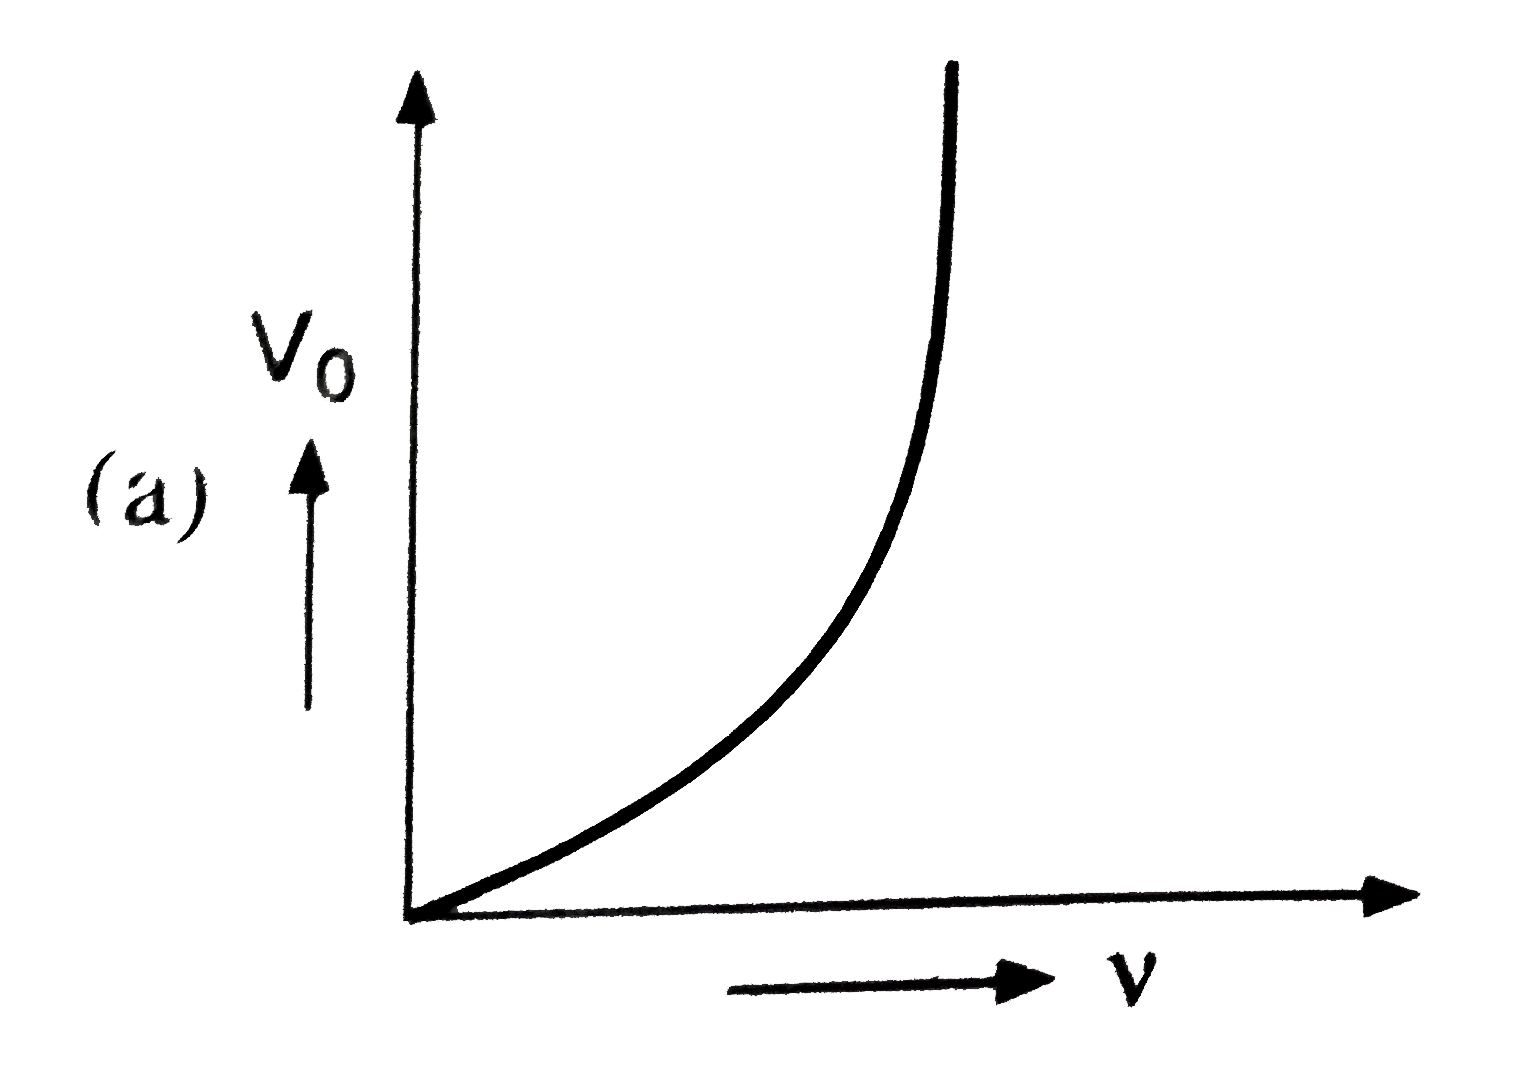 B
B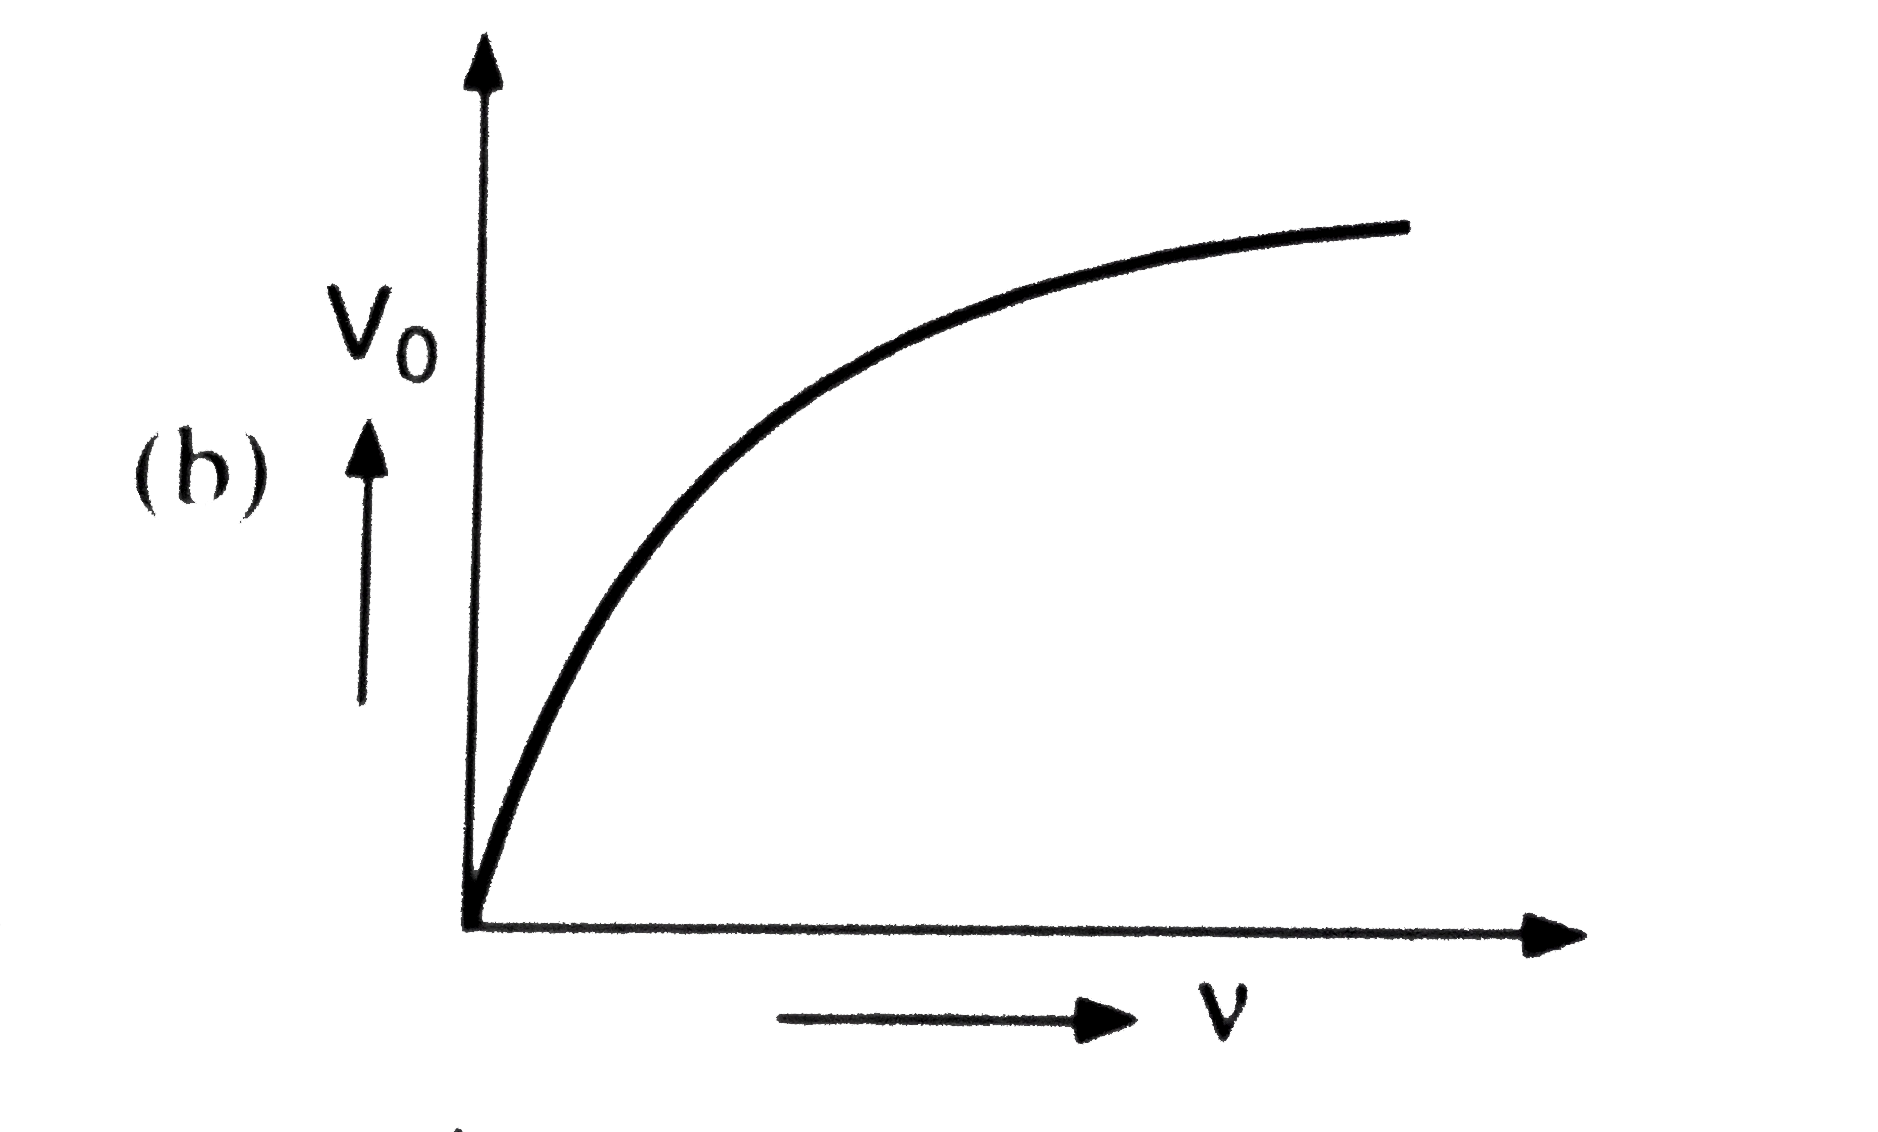 C
C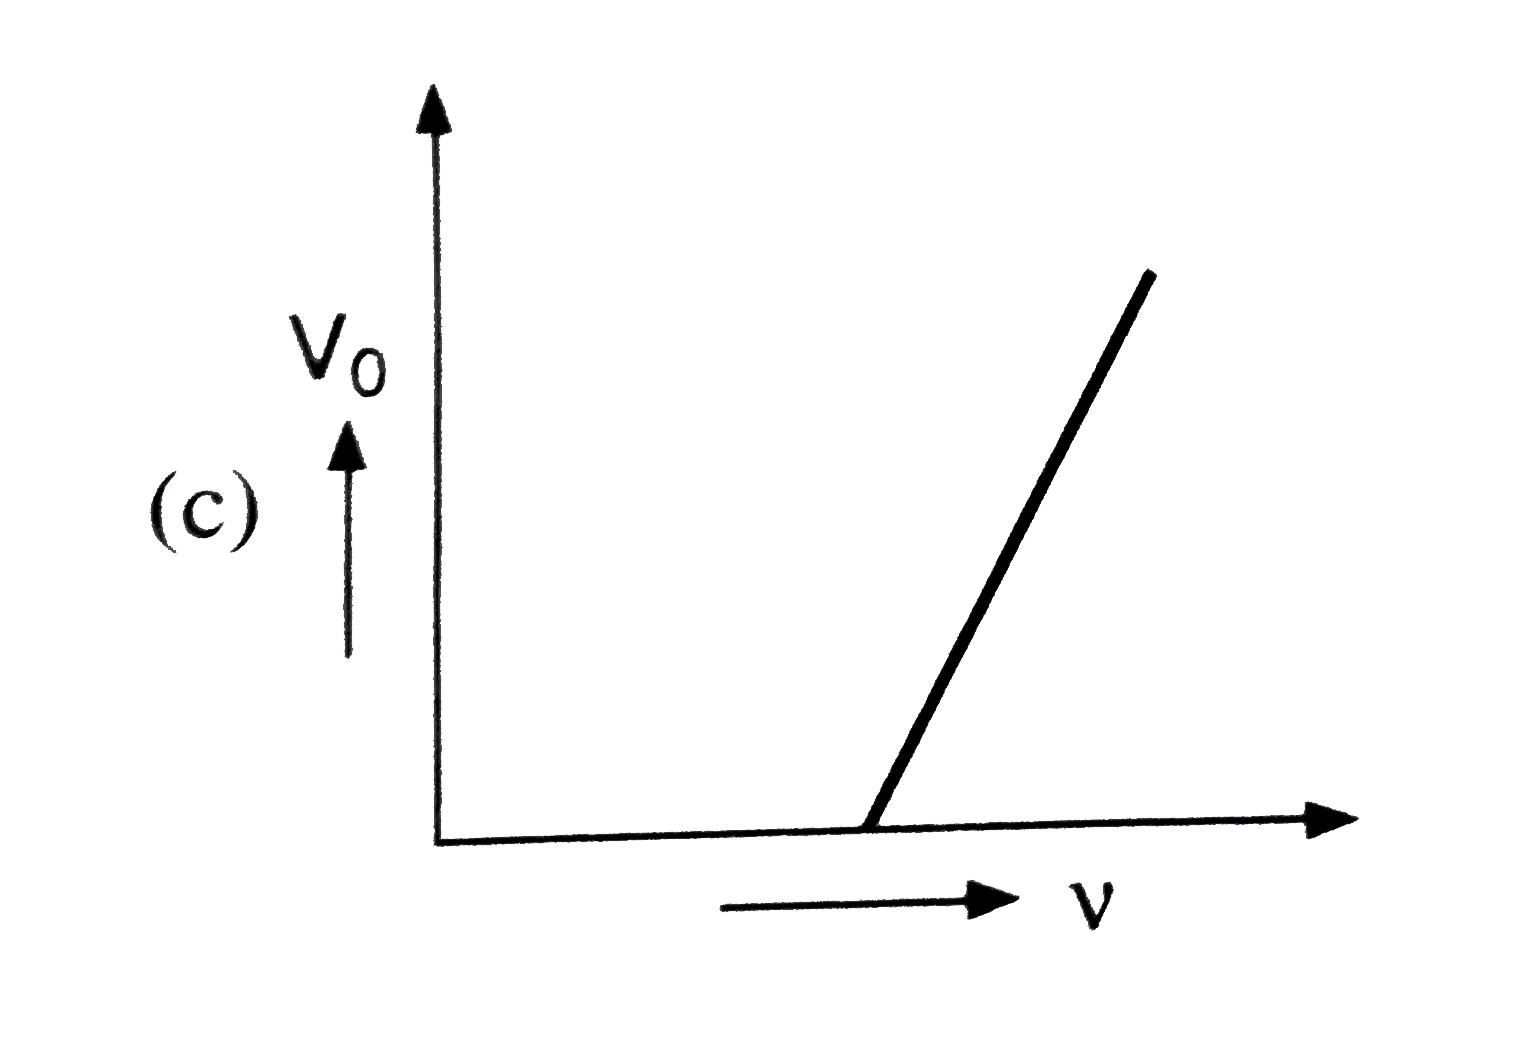 D
D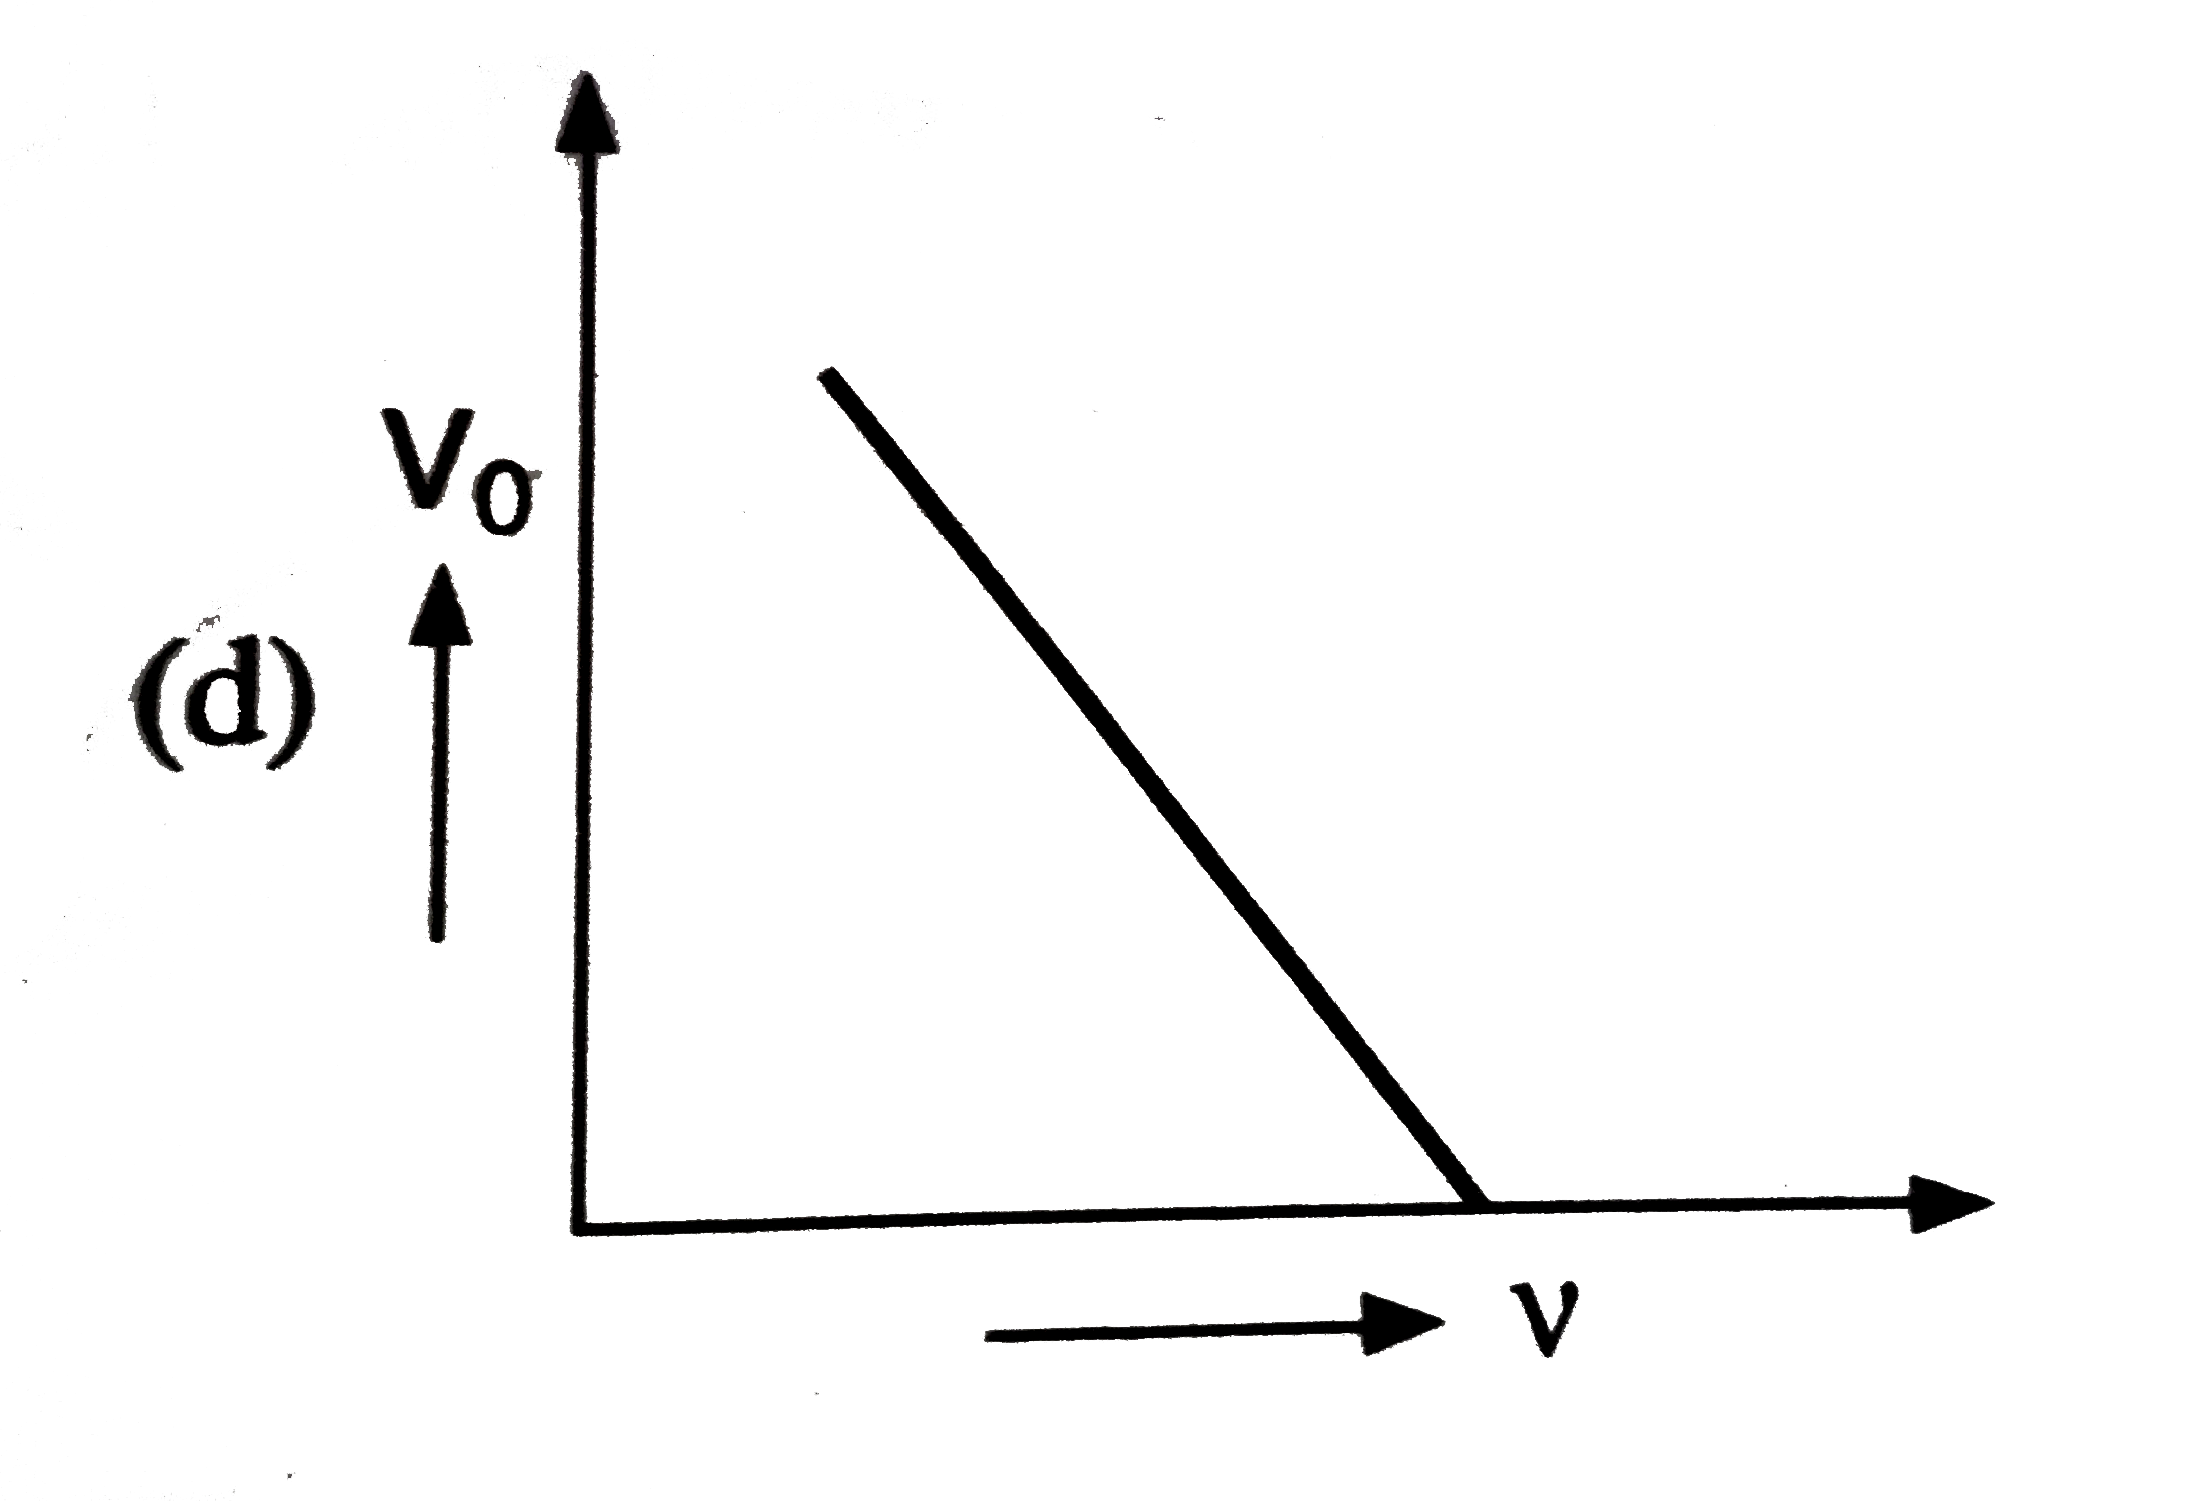
- Question 3 - Select One
In an experiment on photoelectric effect the frequency f of the incident light is plotted against the stopping potential V0. The work function of the photoelectric surface si given by ( e is the electronic charge)
 AOB×e in eVBOB in voltCQA in eVDThe slope of the line AB
In a photoelectric effect experiment, the slope of the graph between the stopping potential and the incident frequency will be :
View SolutionIn photoelectric effect the slope of stop of stopping potential versus frequency of incident light for a given surface will be
View SolutionIn photoelectric effect the slope of straight line graph between stopping potential (Vs) and frequency of incident light (v) gives
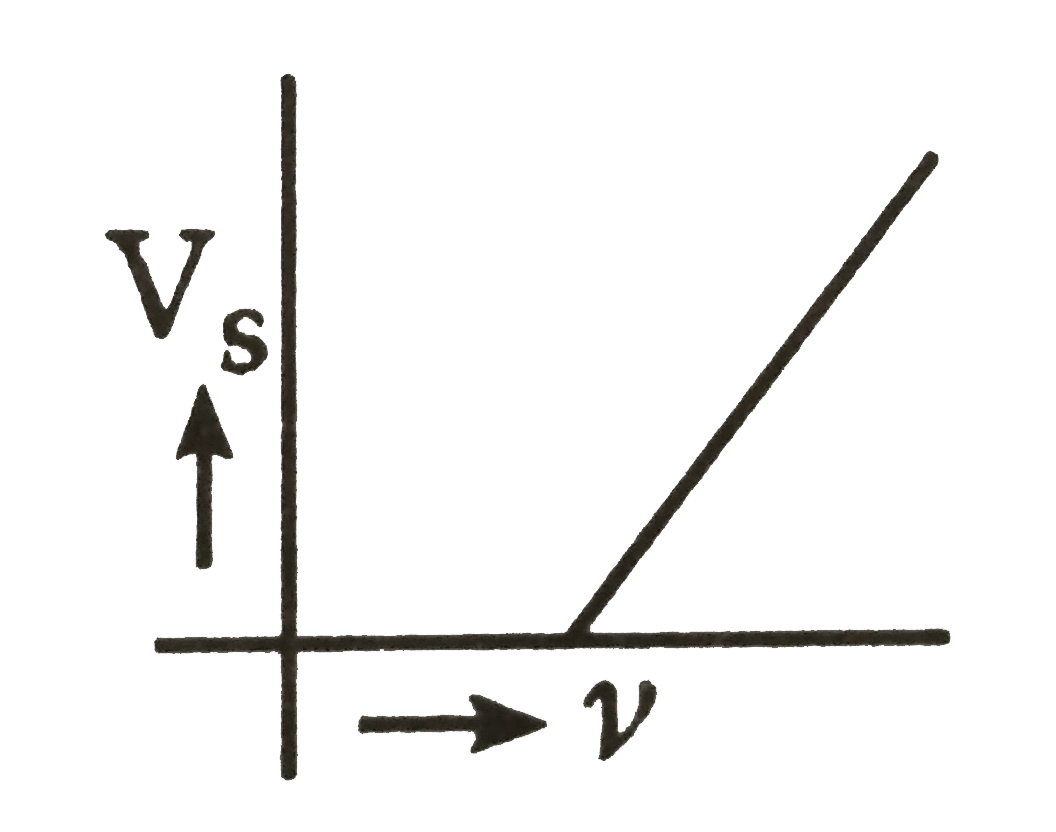 View Solution
In photo electric effect, the slope of the straight line graph between stopping potential and frequency of the incident light gives the ratio of Planck's constant to
View SolutionThe stopping potential V for photoelectric emission from a metal surface is plotted along Y - axis and frequency v of incident light along X - axis . A straight line is obtained as shown . Planck's constant is given by
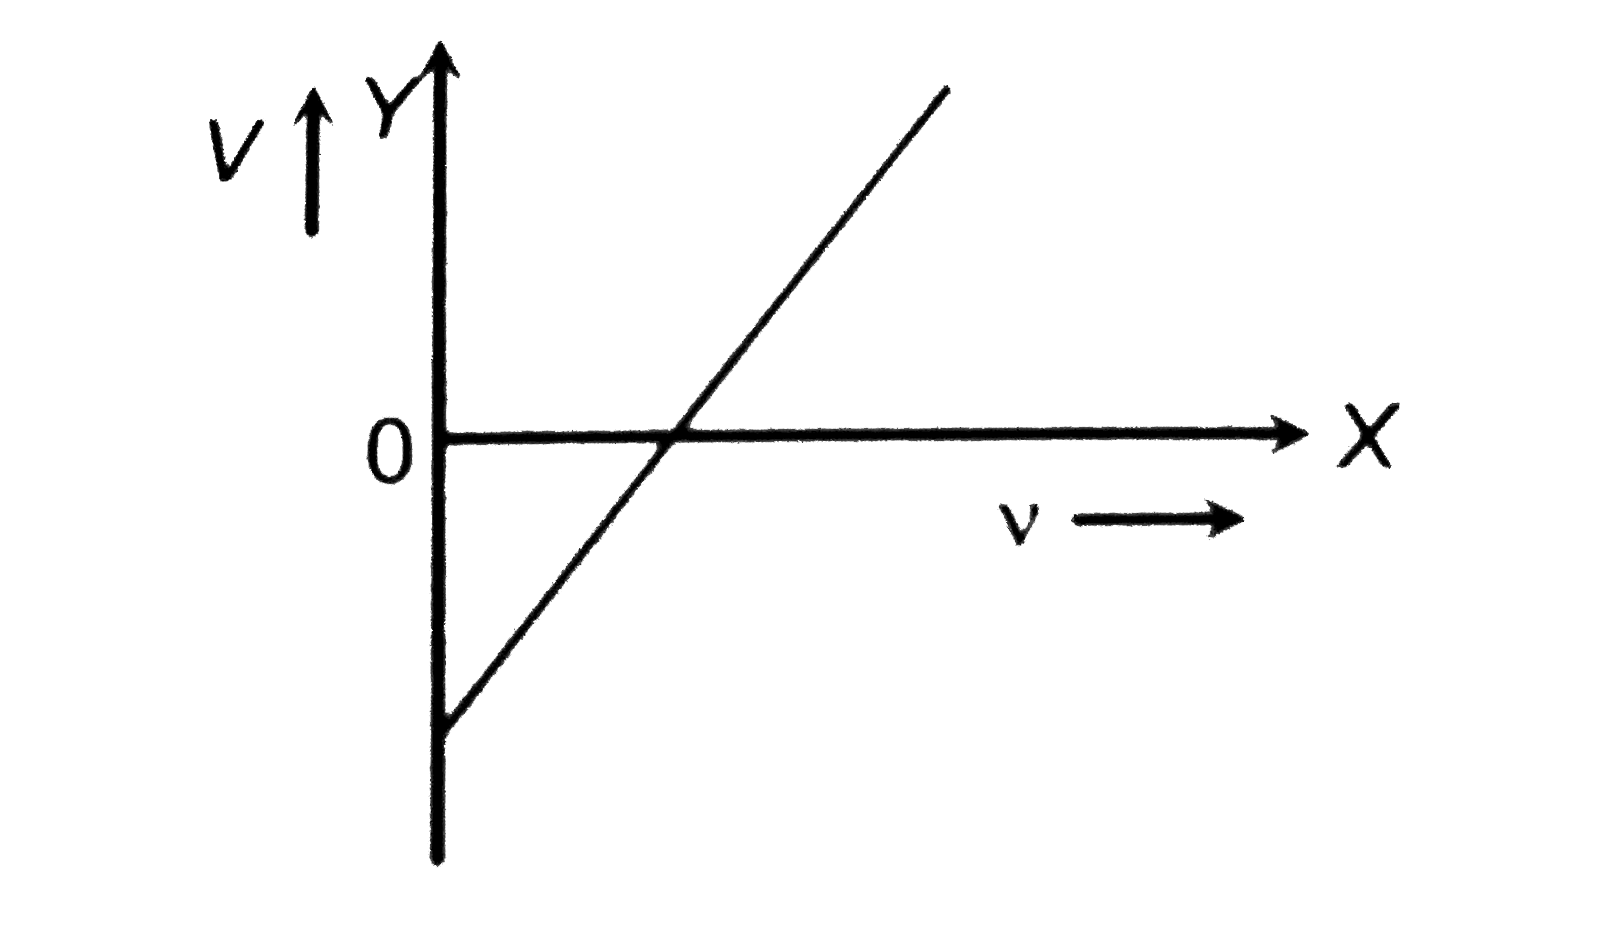 View Solution

