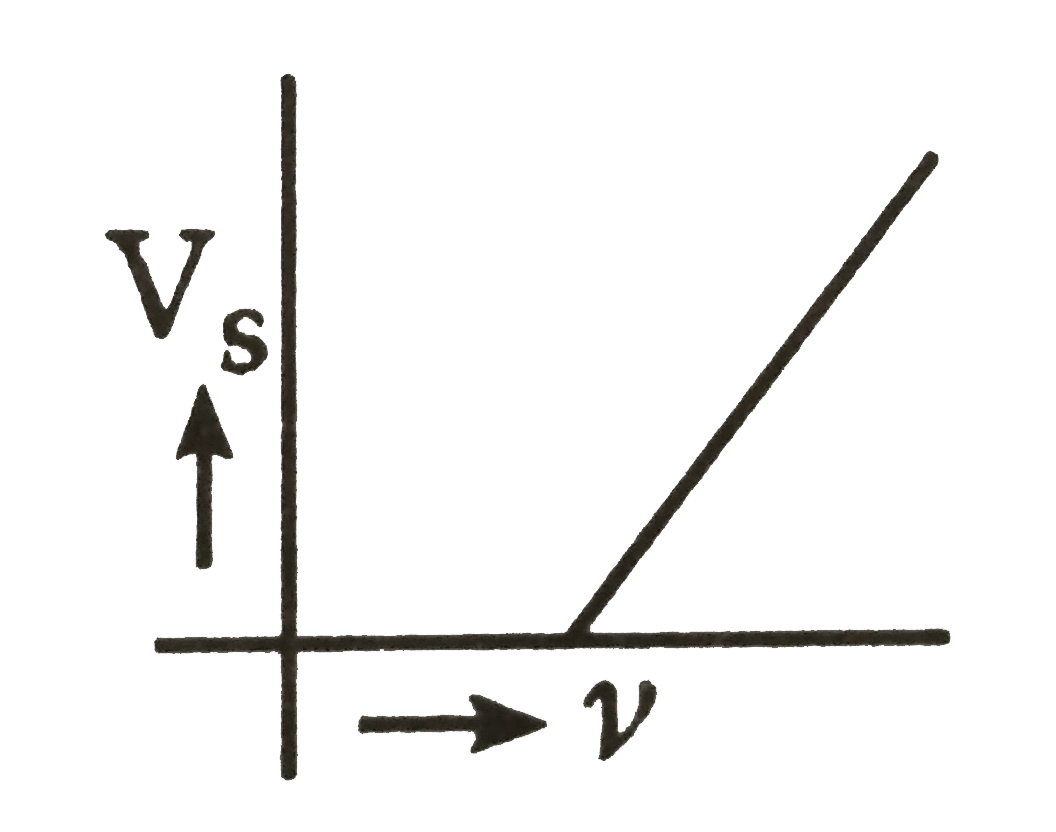
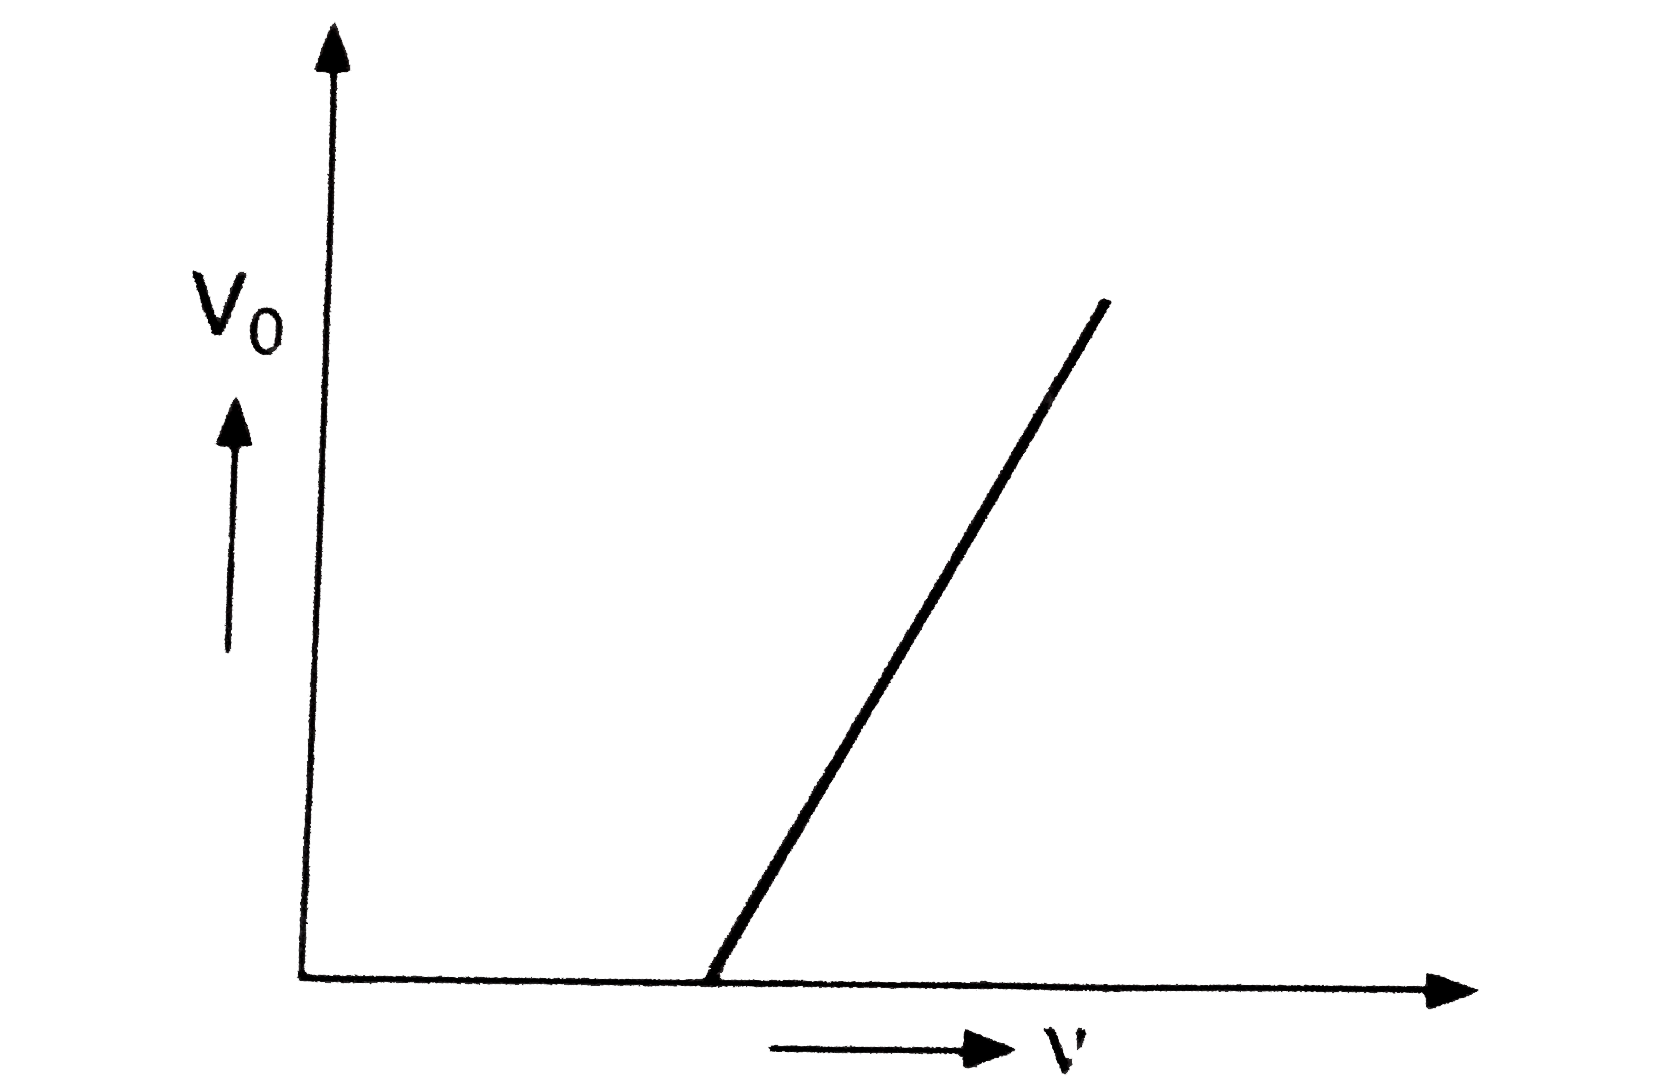
In photo electric effect, the slope of the straight line graph between stopping potential and frequency of the incident light gives the ratio of Planck's constant to
charge of electron
work function
photo electric current
K.E. of electron
The correct Answer is:A
To solve the question regarding the photoelectric effect, we will derive the relationship between the stopping potential (V₀) and the frequency (ν) of the incident light, and determine what the slope of the graph represents.
1. Understanding the Photoelectric Effect:
The photoelectric effect describes the phenomenon where electrons are emitted from a material (usually a metal) when it is exposed to light of sufficient frequency. The energy of the incident photons must be greater than the work function (φ) of the material for electrons to be emitted.
2. Energy of Incident Photons:
The energy (E) of a photon is given by the equation:
E=hν
where h is Planck's constant and ν is the frequency of the incident light.
3. Work Function:
The work function (φ) is the minimum energy required to remove an electron from the surface of the material.
4. Kinetic Energy of Emitted Electrons:
When a photon hits the material, the energy is used to overcome the work function and the remaining energy is converted into kinetic energy (K.E) of the emitted electron:
K.E=hν−ϕ
5. Relation to Stopping Potential:
The stopping potential (V₀) is the potential needed to stop the emitted electrons. The kinetic energy of the electrons can also be expressed in terms of stopping potential:
K.E=eV₀
where e is the charge of the electron.
6. Setting the Equations Equal:
By equating the two expressions for kinetic energy, we have:
eV₀=hν−ϕ
7. Rearranging the Equation:
Rearranging gives:
eV₀=hν−ϕ⟹eV₀=hν−ϕ
eV₀=hν−ϕ⟹V₀=heν−ϕe
8. Identifying the Slope:
This equation is in the form of y=mx+c where:
- y=V₀
- x=ν
- m=he (the slope)
- c=−ϕe (the y-intercept)
9. Conclusion:
The slope of the graph of stopping potential (V₀) versus frequency (ν) is given by:
slope=he
Therefore, the slope gives the ratio of Planck's constant (h) to the charge of the electron (e).
Final Answer:
The slope of the straight line graph between stopping potential and frequency of the incident light gives the ratio of Planck's constant (h) to the charge of the electron (e).
The photoelectric effect describes the phenomenon where electrons are emitted from a material (usually a metal) when it is exposed to light of sufficient frequency. The energy of the incident photons must be greater than the work function (φ) of the material for electrons to be emitted.
The energy (E) of a photon is given by the equation:
E=hν
where h is Planck's constant and ν is the frequency of the incident light.
The work function (φ) is the minimum energy required to remove an electron from the surface of the material.
When a photon hits the material, the energy is used to overcome the work function and the remaining energy is converted into kinetic energy (K.E) of the emitted electron:
K.E=hν−ϕ
The stopping potential (V₀) is the potential needed to stop the emitted electrons. The kinetic energy of the electrons can also be expressed in terms of stopping potential:
K.E=eV₀
where e is the charge of the electron.
By equating the two expressions for kinetic energy, we have:
eV₀=hν−ϕ
Rearranging gives:
eV₀=hν−ϕ⟹eV₀=hν−ϕ
eV₀=hν−ϕ⟹V₀=heν−ϕe
This equation is in the form of y=mx+c where:
- y=V₀
- x=ν
- m=he (the slope)
- c=−ϕe (the y-intercept)
The slope of the graph of stopping potential (V₀) versus frequency (ν) is given by:
slope=he
Therefore, the slope gives the ratio of Planck's constant (h) to the charge of the electron (e).
The slope of the straight line graph between stopping potential and frequency of the incident light gives the ratio of Planck's constant (h) to the charge of the electron (e).
Topper's Solved these Questions
- BOOK - NARAYNACHAPTER - DUAL NATUREEXERCISE - LEVEL-I (C.W)16videos
DUAL NATURE
- BOOK - NARAYNACHAPTER - DUAL NATUREEXERCISE - LEVEL-II (C.W)20videos
DUAL NATURE
- BOOK - NARAYNACHAPTER - DUAL NATUREEXERCISE - LEVEL-II (H.W)17videos
DUAL NATURE
- BOOK - NARAYNACHAPTER - DUAL NATURE OF RADIATION AND MATTEREXERCISE - ASSERTION AND REASON15videos
DUAL NATURE OF RADIATION AND MATTER
- BOOK - NARAYNACHAPTER - ELECTRIC CHARGES AND FIELDSEXERCISE - EXERCISE -443videos
ELECTRIC CHARGES AND FIELDS
Similar Questions
In photoelectric effect the slope of straight line graph between stopping potential (Vs) and frequency of incident light (v) gives
 View Solution
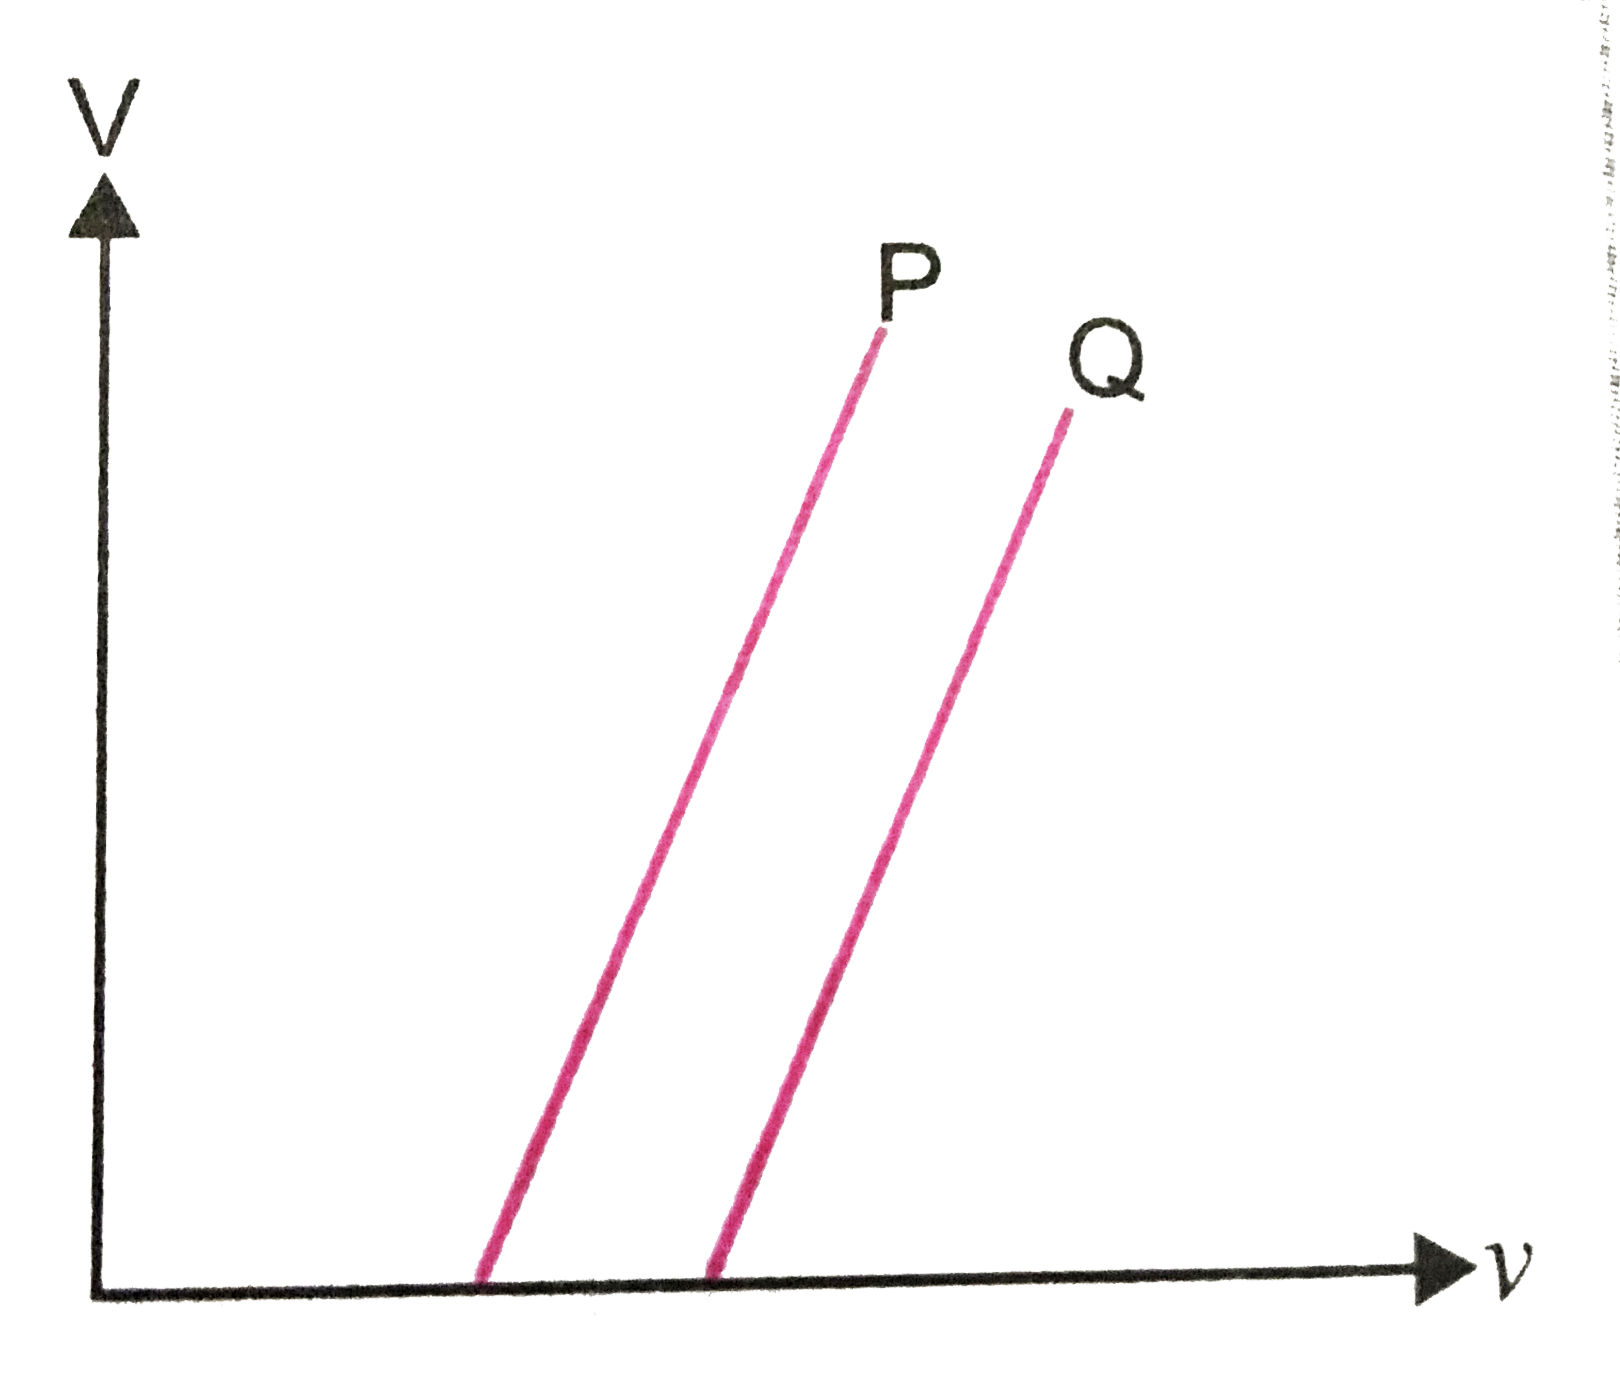
In a photoelectric effect experiment, the graph between the stopping potential (V) and frequency (v) of the incident radiations on two different metal plates P and Q are shown in plates, P and Q has greater value of work function ? (ii) What does the slope of the lines depict?
 View Solution
Knowledge Check
- Question 1 - Select One
In photoelectric effect the slope of straight line graph between stopping potential (V0) and freqency of incident light (v) gives:
 Acharge on electronBwork function of emitterCPlanck's constantDratio of Planck's constant to charge on electron
 - Question 2 - Select One
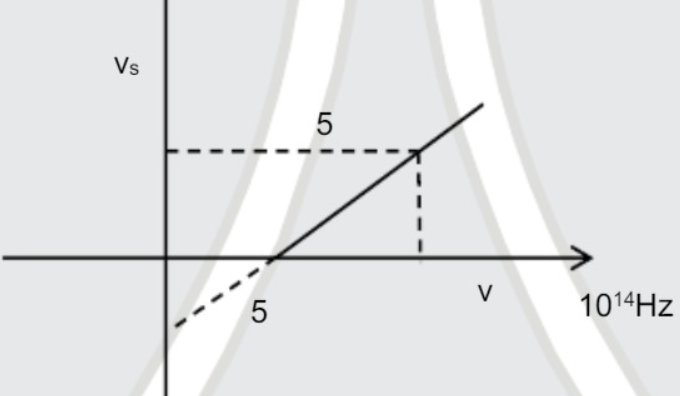
Graph between stopping potential and frequency of light as shown find the work function
 A4.01 evB2.07 evC5.01 evD2.09 ev
 - Question 3 - Select One
In a photoelectric effect experiment, the slope of the graph between the stopping potential and the incident frequency will be :
A1B0.5C10−15D10−34
Find a relation between cut-off potential, frequency of the incident light and threshold frequency.
View SolutionIn a photoelectric effect experiment, the slope of the graph between the stopping potential and the incident frequency will be :
View SolutionIn photoelectric effect the slope of stop of stopping potential versus frequency of incident light for a given surface will be
View SolutionIn photoelectric effect the slope of stop of stopping potential versus frequency of incident light for a given surface will be
View SolutionIn a photoelectric experiment, the reciprocal of the slope of the straight line graph giving the relation between the stopping potential and the frequency of incident radiation gives
View Solution

