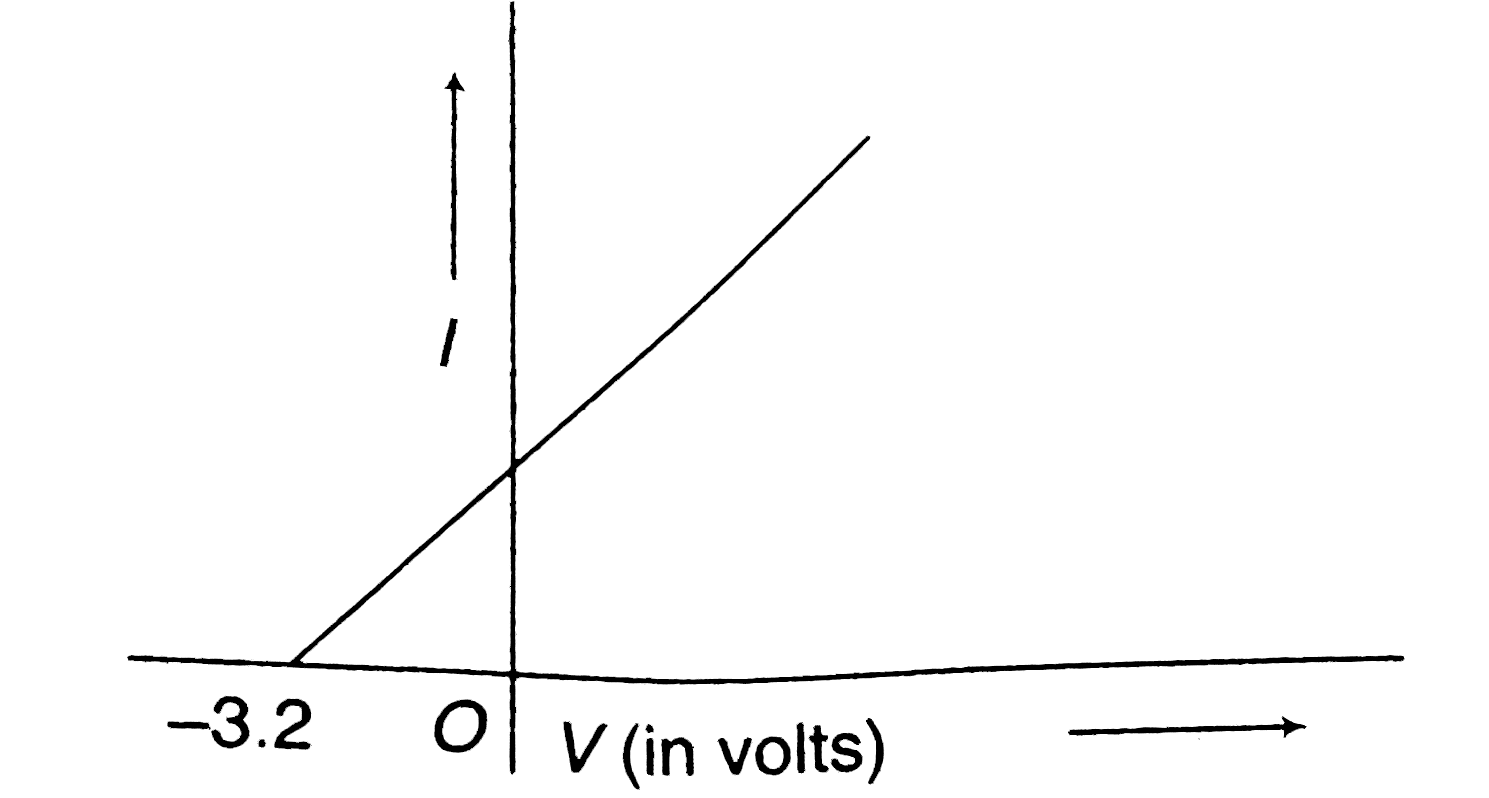
In a photoelectric experiment the relation between applied potential difference between cathode and anode V and the photoelectric current cathode and anode V and the photoelectric current l and was found to be shown in graph below. If planck's constant h=6.6×10⁻³⁴Js, the frequency of incident radiation would e nearly (in s−1)
0.436×10¹⁸
0.436×10¹⁷
0.775×10¹⁵
0.775×10¹⁶
The correct Answer is:C
From the graph, stopping potential, V0=−3.2V
for photoelectric effect,
eV0hv⇒v=eV0h
v=1.6×10−19×3.26.6×10−34
=0.775×10¹⁵Hz
Topper's Solved these Questions
- ELECTRONS AND PROTONSBOOK - MHTCET PREVIOUS YEAR PAPERS AND PRACTICE PAPERSCHAPTER - ELECTRONS AND PROTONSEXERCISE - MHT CET CORNER
19 Videos
- ELECTRONS AND PROTONSBOOK - MHTCET PREVIOUS YEAR PAPERS AND PRACTICE PAPERSCHAPTER - ELECTRONS AND PROTONSEXERCISE - Exercise 1
50 Videos
- ELECTROMAGNETIC INDUCTIONBOOK - MHTCET PREVIOUS YEAR PAPERS AND PRACTICE PAPERSCHAPTER - ELECTROMAGNETIC INDUCTIONEXERCISE - MHT CET CONER
34 Videos
- ELECTROSTATICSBOOK - MHTCET PREVIOUS YEAR PAPERS AND PRACTICE PAPERSCHAPTER - ELECTROSTATICSEXERCISE - MHT CET Corner
29 Videos
Similar Questions
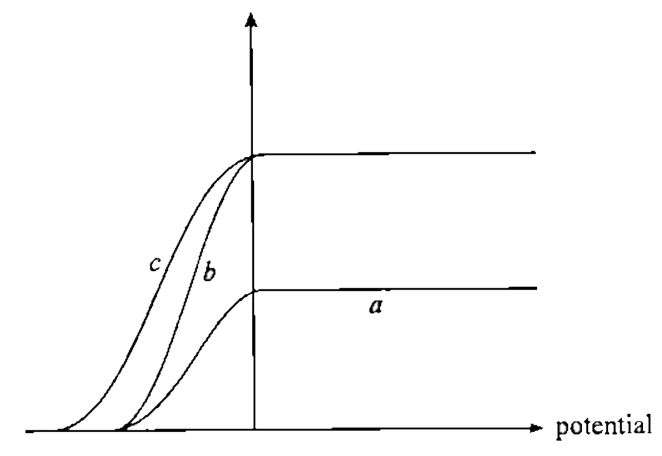
In photoelectric experiment the plot between anode potential and photoelectric current is shown in figure 2.3.1. Which of the following is correct:
View SolutionIn photoelectric effect experiment potential difference between plates increases keeping incident light on cathode plate remains unchanged which of the following is correct about saturation current :
View Solution
Knowledge Check
In photoelectric effect , the curve between photoelectric current and anode potential V (for different frequencies ) is shown in figure , then
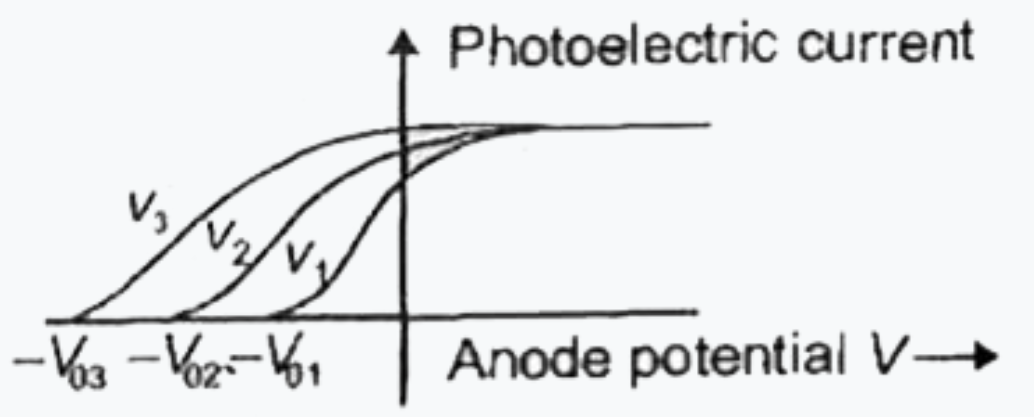 Av1>v2>v3Bv1<v2<v3Cv1=v2=v3Dv1>v2<v3
In a photoelectric experiment, the reciprocal of the slope of the straight line graph giving the relation between the stopping potential and the frequency of incident radiation gives
AhBeCheDeh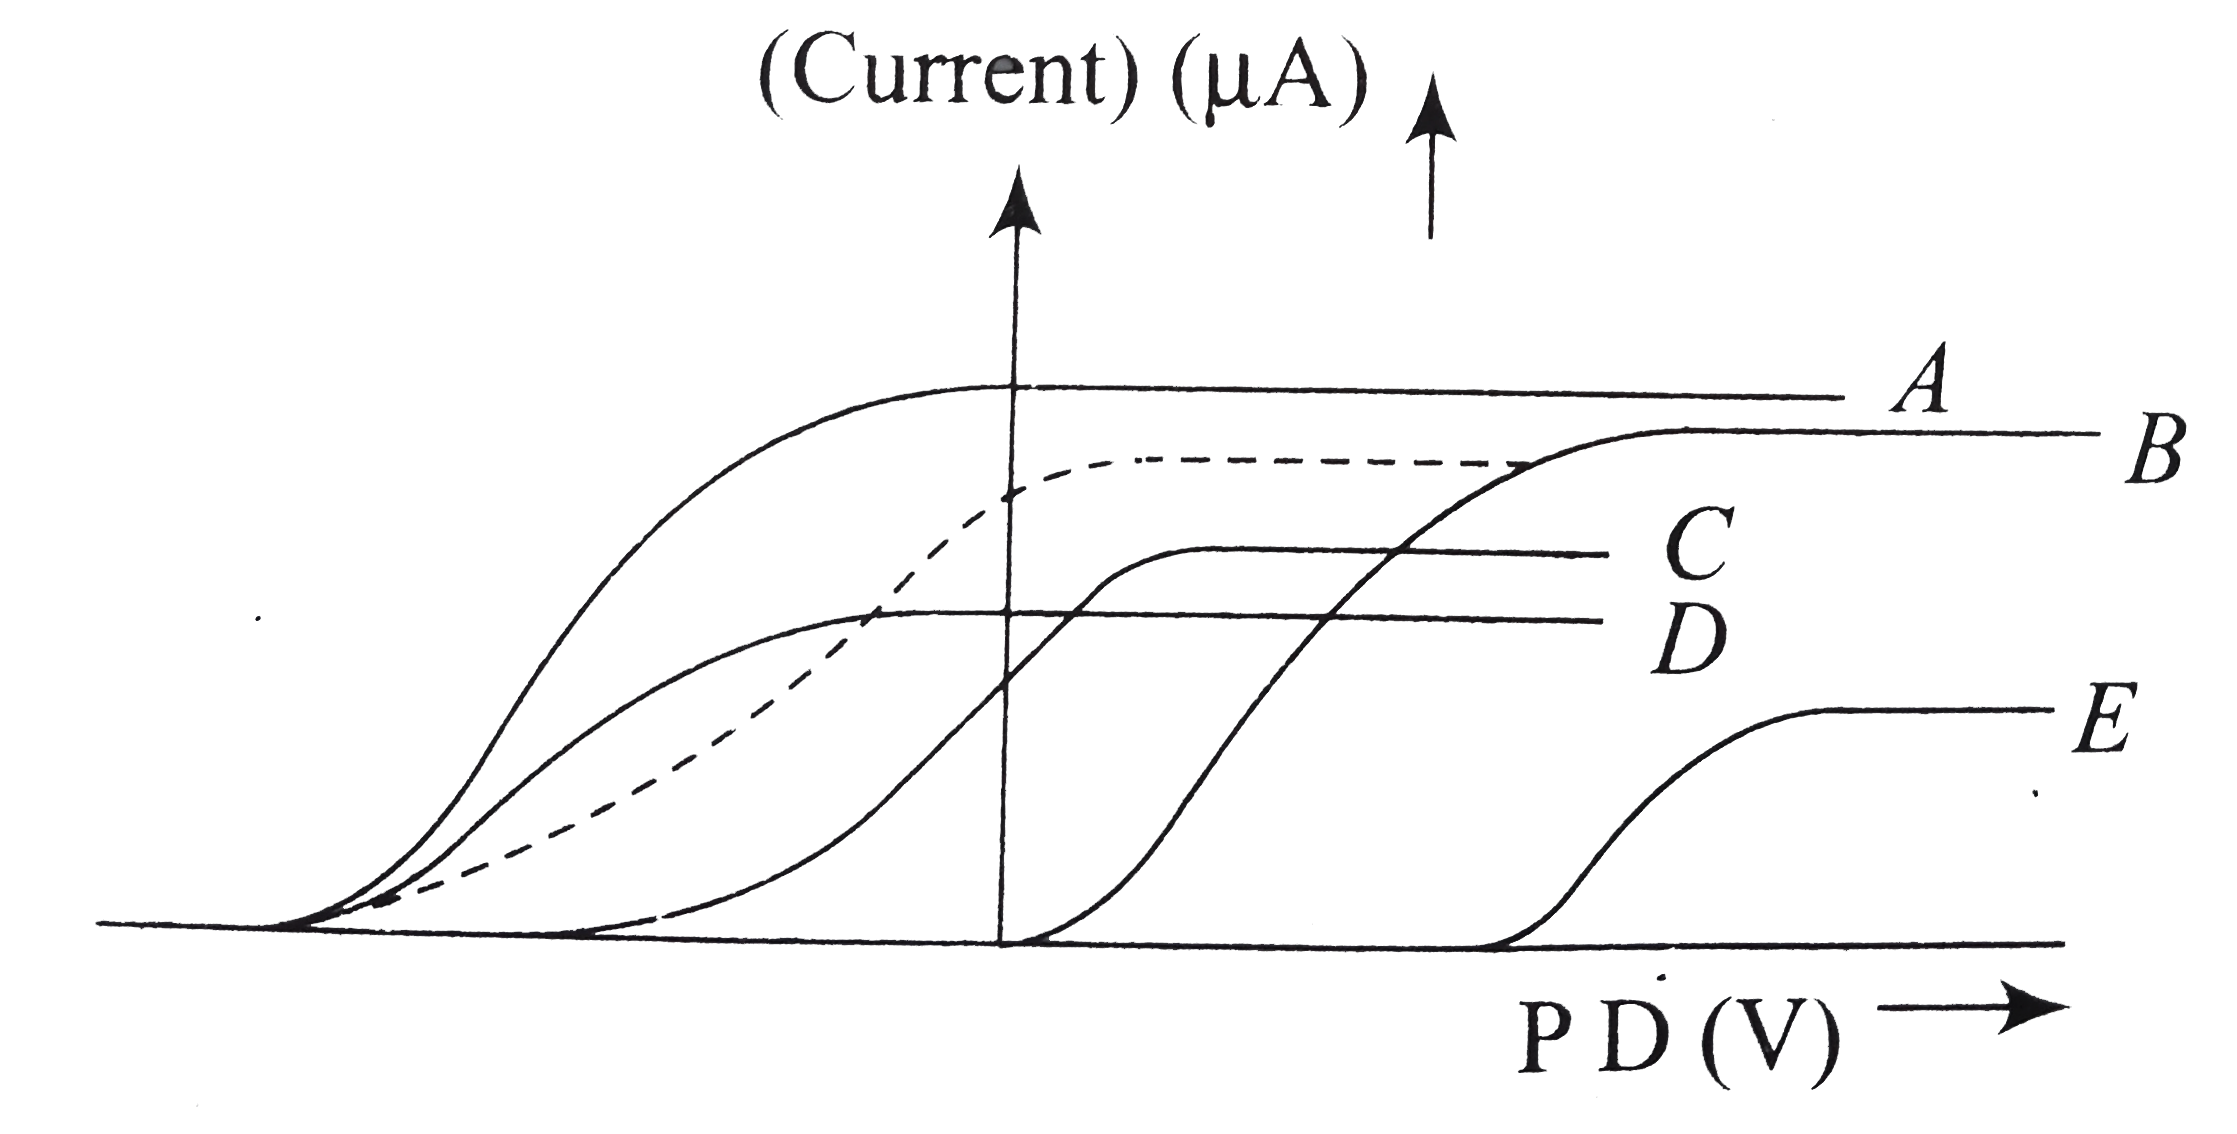
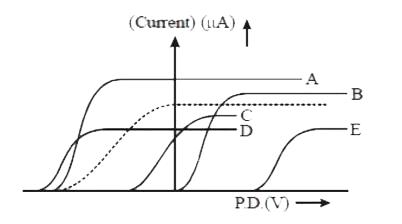
A photoelectric cell is connected to a source of variable potential difference, connected across it and the photoelectric current resulting (μA) is plotted against the applied potential difference (V). The graph in the broken line represents one for a given frequency and intensity of the incident radiation . If the frequency is increased and the intensity is reduced, which of the following graphs of unbroken line represents the new situation?AABBCCDD
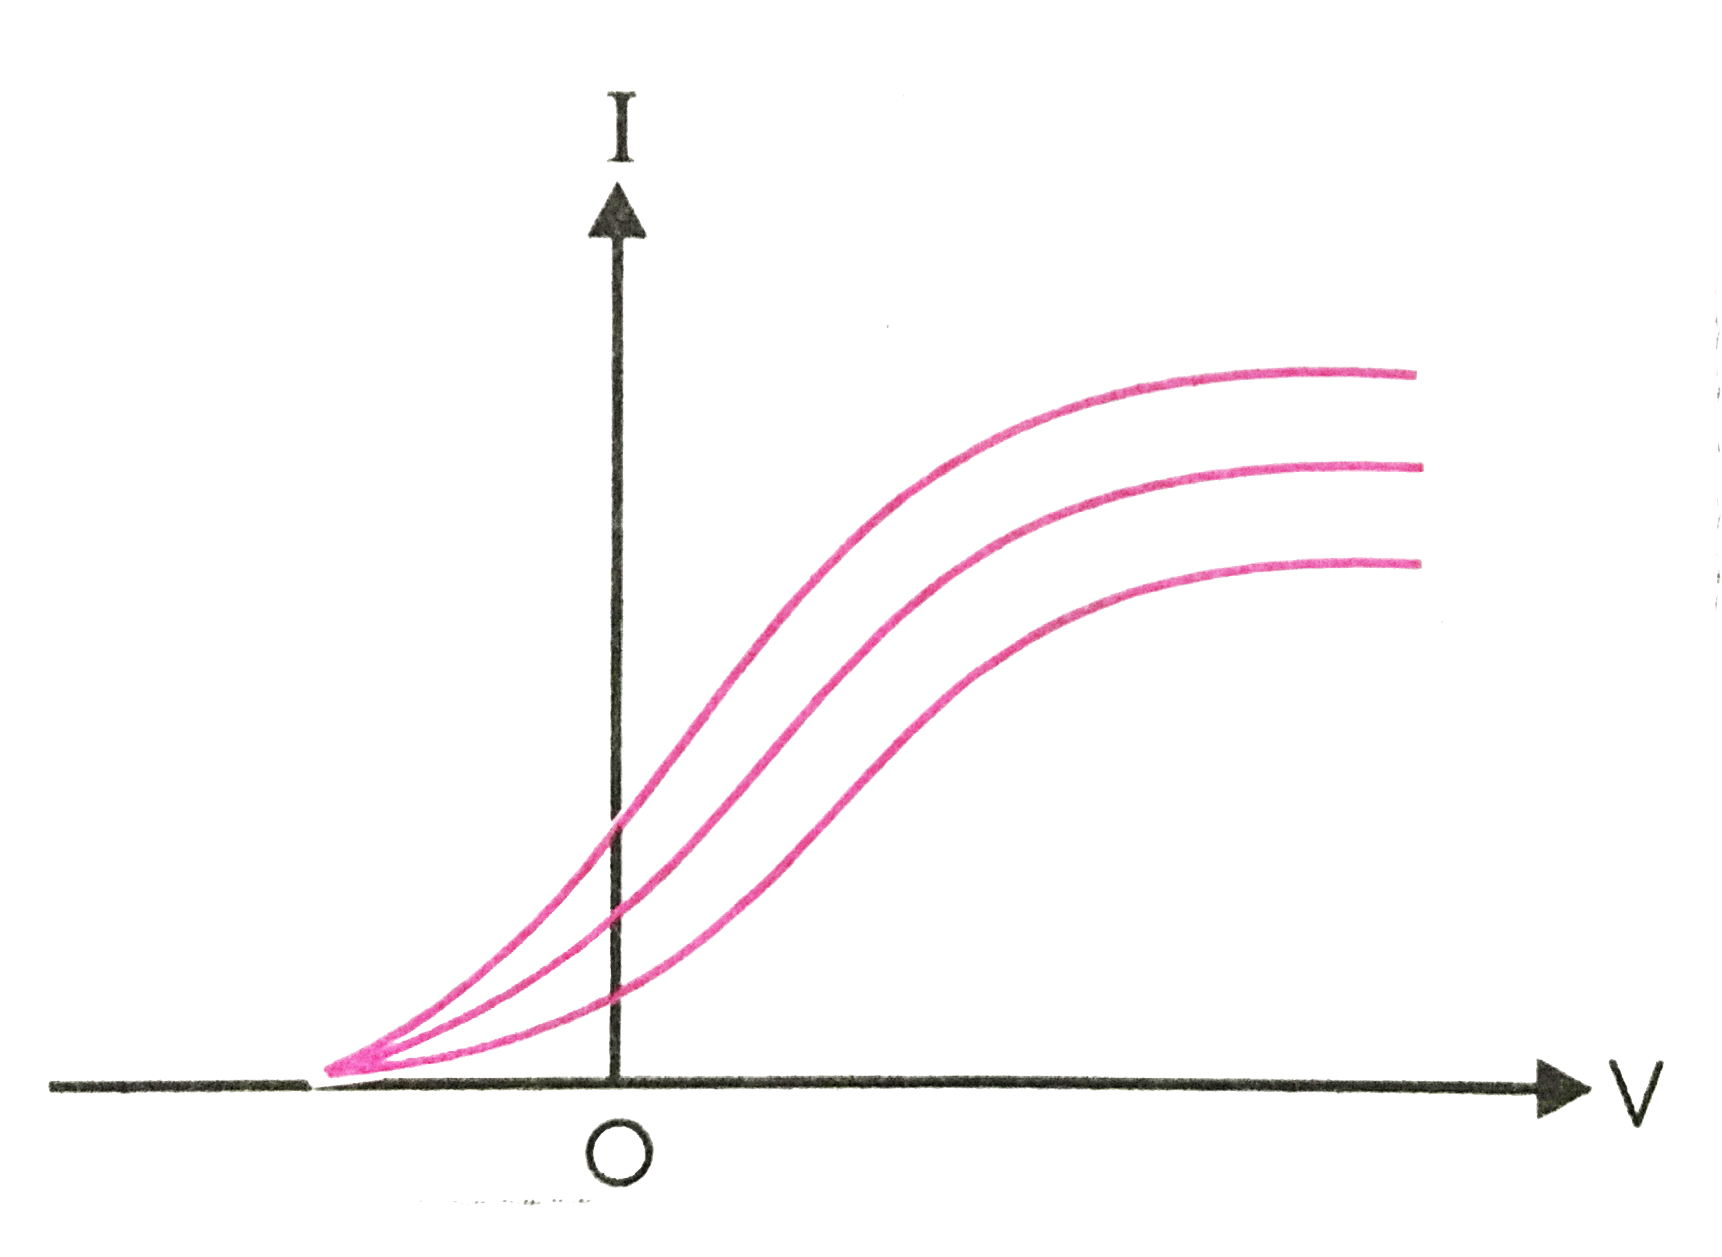
In an experiment on photoelectic effect, the graph as shown in fig. were obtained between the photoelectric current (I) and the anode potential (V). Name the characterstic of the incident radiation that was kept constant in this experiment.
View SolutionA photoelectric cell is connected to a source of variable potential difference, connected across it and the photoelectric current resulting (μA) is plotted against the applied potential difference (V). The graph in the broken line represents one for a given frequency and intensity of the incident radiation. If the frequency is increased and the intensity is reduced. Which of the following graphs of unbroken line represents the new situation?
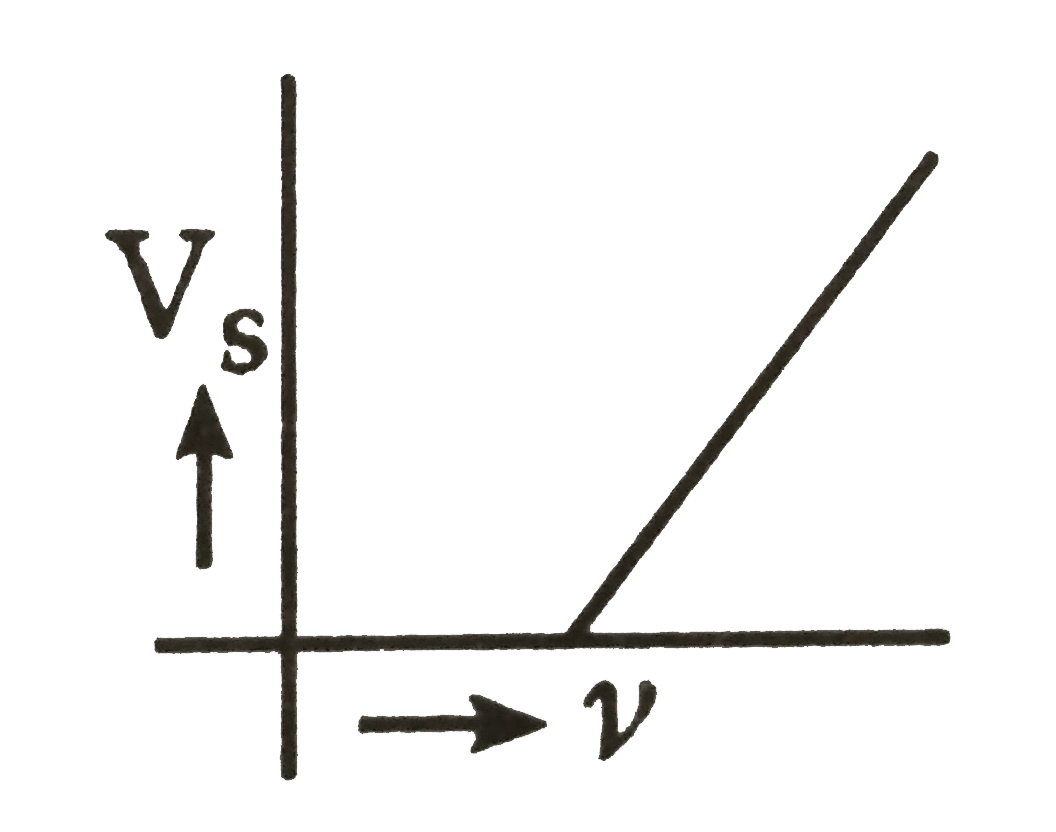
View SolutionIn photoelectric effect the slope of straight line graph between stopping potential (Vs) and frequency of incident light (v) gives
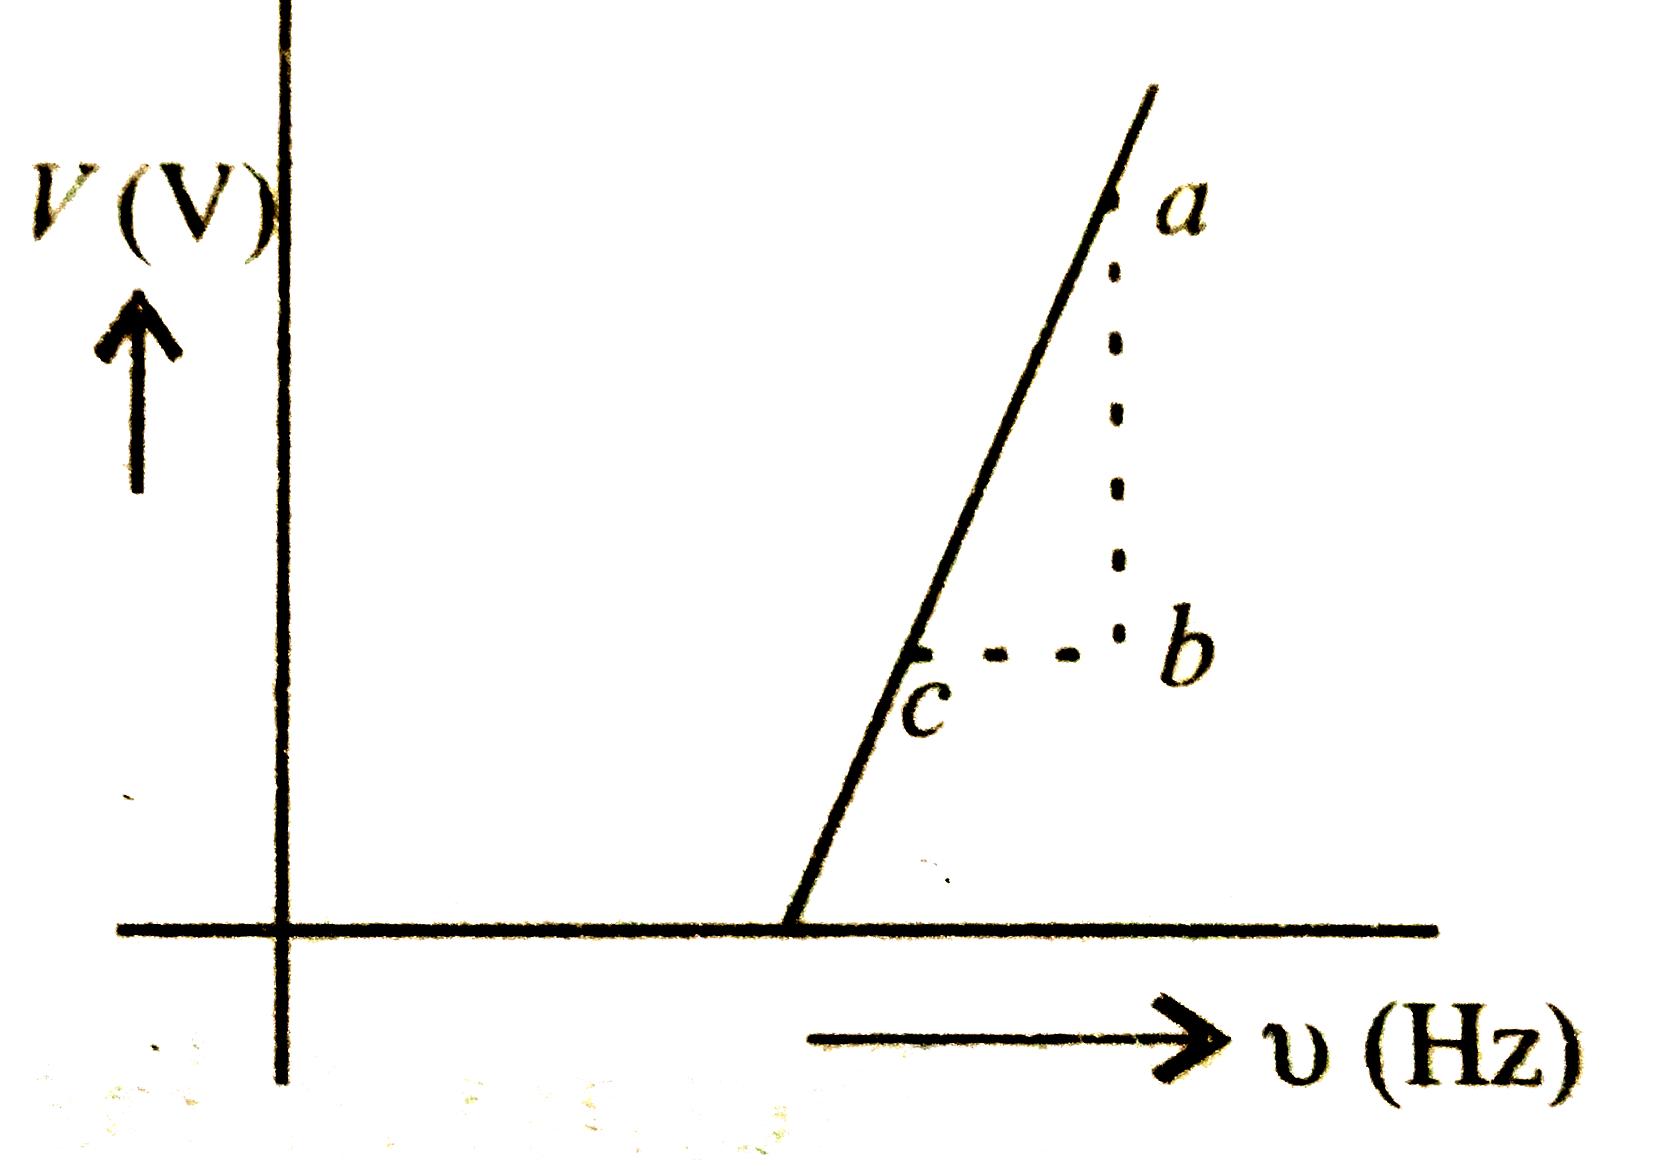
View SolutionIn a photoelectric experiment, the graph of frequency v of incident light (in Hz) and stopping potential V (in V) is as shown in the figure. Planck's constant is (e is the elementary charge)
View SolutionIn an experiment on the photoelectric effect , the slope of the cut - off voltage versus frequency of incident light is found to be 4.12×10⁻¹⁵V s . The value of Planck's constant is
View Solution
