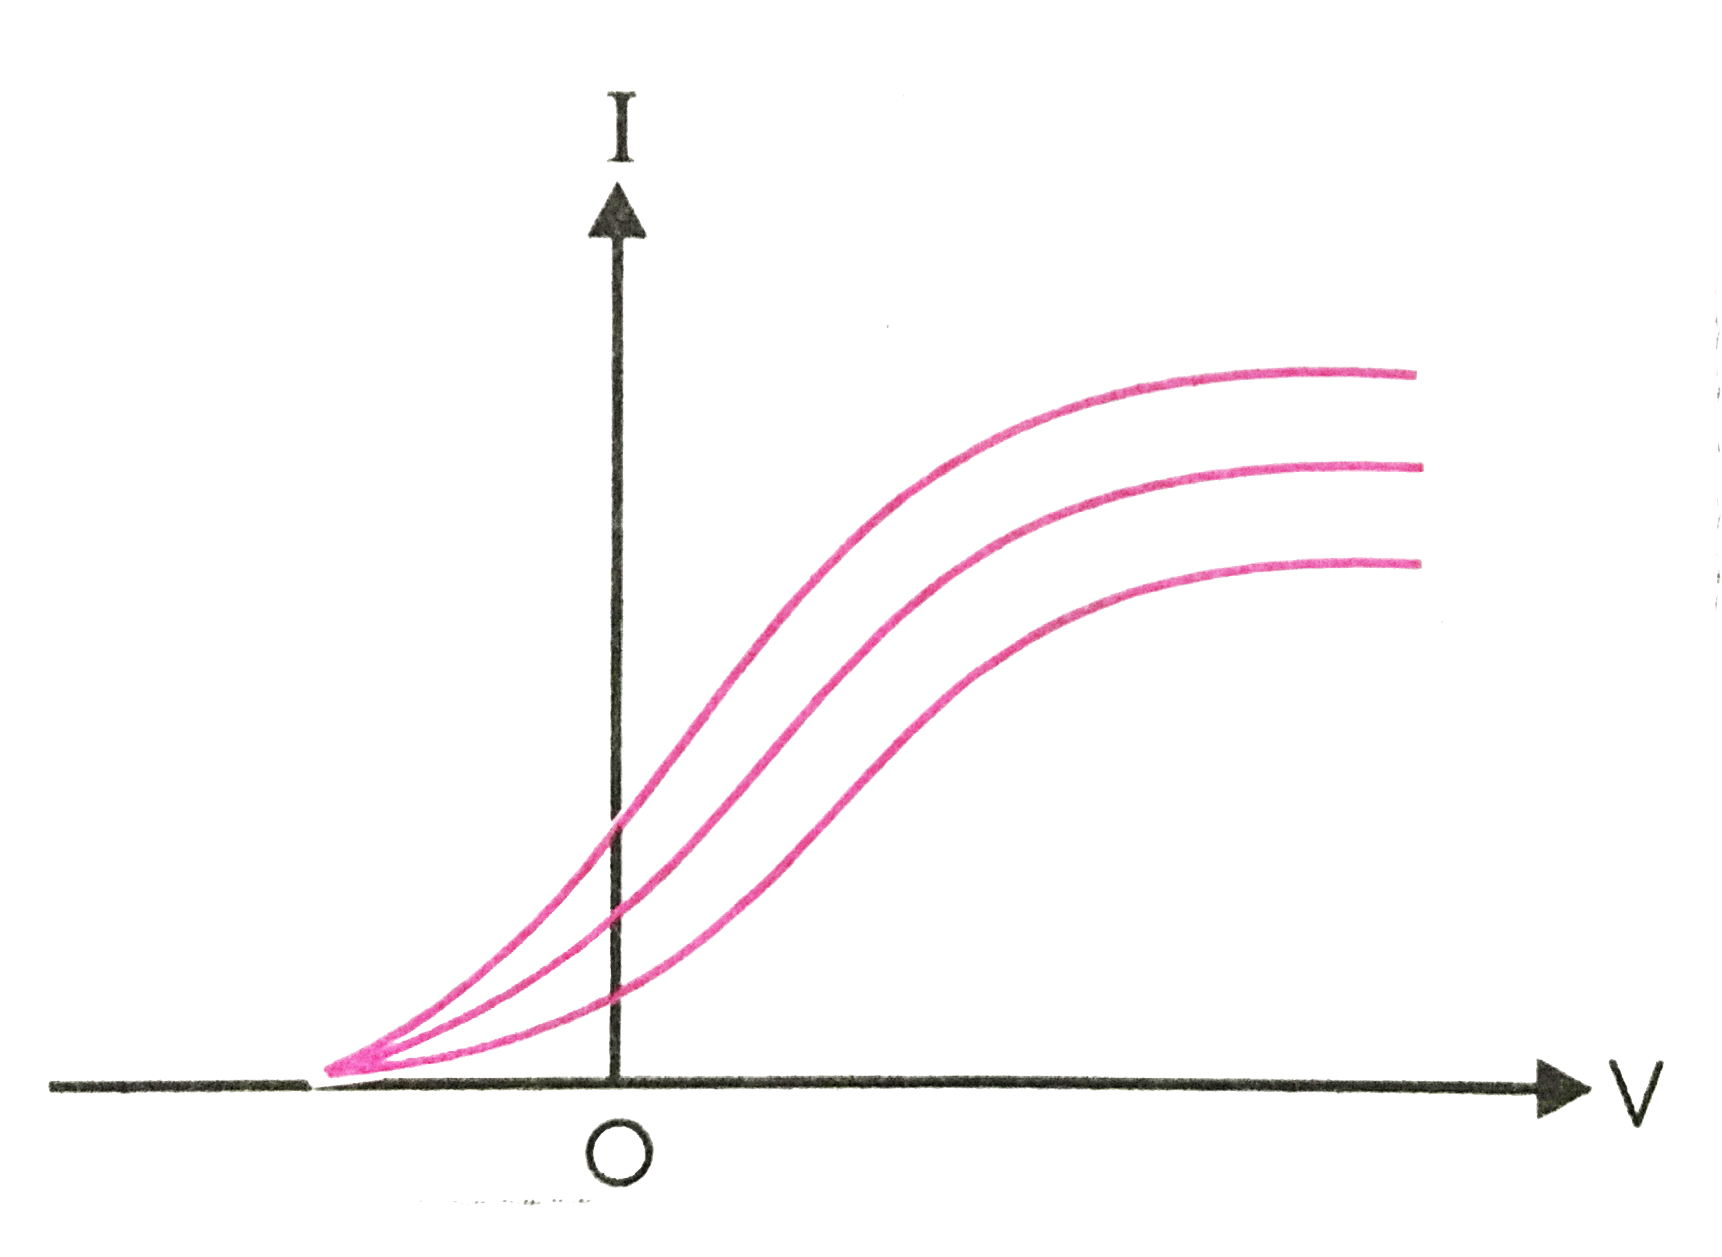
In an experiment on photoelectic effect, the graph as shown in fig. were obtained between the photoelectric current (I) and the anode potential (V). Name the characterstic of the incident radiation that was kept constant in this experiment.

As the value of stopping potential is same for all the curves, so the frequency of incident radiations is kept constant but their intensity is different.
Topper's Solved these Questions
- DUAL NATURE OF RADIATION AND MATTERBOOK - PRADEEPCHAPTER - DUAL NATURE OF RADIATION AND MATTEREXERCISE - NCERT Exerciese question
1 Videos
- DUAL NATURE OF RADIATION AND MATTERBOOK - PRADEEPCHAPTER - DUAL NATURE OF RADIATION AND MATTEREXERCISE - Short answer
1 Videos
- CURRENT ELECTRICITYBOOK - PRADEEPCHAPTER - CURRENT ELECTRICITYEXERCISE - Problems for Practice (B)
2 Videos
- ELECTROMAGNETIC INDUCTION & ALTERNATING CURRENTBOOK - PRADEEPCHAPTER - ELECTROMAGNETIC INDUCTION & ALTERNATING CURRENTEXERCISE - Multiple Choice Questions
1 Videos
Similar Questions
Knowledge Check
Explain photoelectric effect Explain the effect of increase of intensity of incident radiations on photoelectrons emitted by a photo-tube.
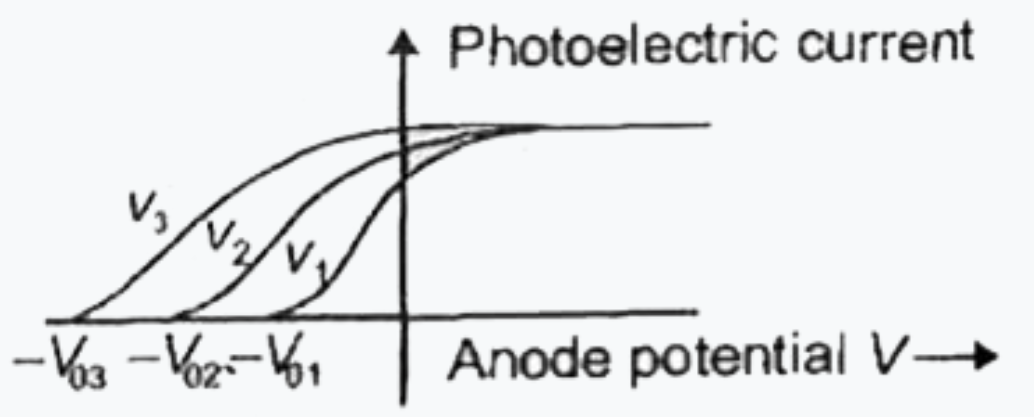
AincreasesBdecreasesCremains constantDfirst decrease and then increase constantIn photoelectric effect , the curve between photoelectric current and anode potential V (for different frequencies ) is shown in figure , then
 Av1>v2>v3Bv1<v2<v3Cv1=v2=v3Dv1>v2<v3
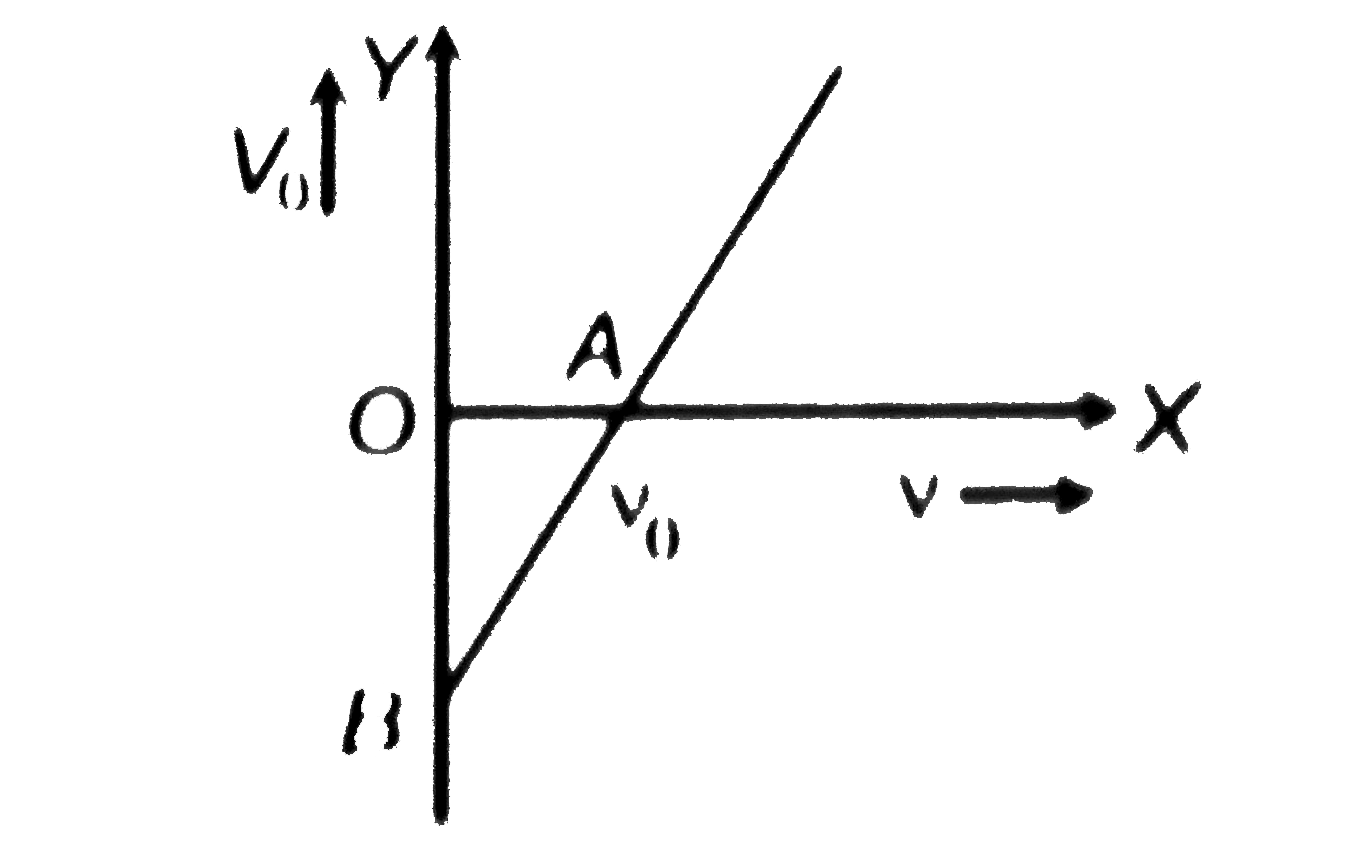
In a photoelectric experiment, the reciprocal of the slope of the straight line graph giving the relation between the stopping potential and the frequency of incident radiation gives
AhBeCheDeh
In an experiment on photoelectric effect the frequency f of the incident light is plotted against the stopping potential V0. The work function of the metal is given by ( e is the electronic charge)

View SolutionIn a photoelectric effect experiment, the slope of the graph between the stopping potential and the incident frequency will be :
View SolutionIn a photoelectric effect experiment, the slope of the graph between the stopping potential and the incident frequency will be :
View SolutionIn photoelectric effect the slope of stop of stopping potential versus frequency of incident light for a given surface will be
View SolutionWhich one of the following graphs in figure shows the variation of photoelectric current (I) with voltage (V) between the electrodes in a photoelectric cell?
View Solution


