In a series of photoelectric emission experiments on a certain metal surface, possible relationships between the following quantities were investigated: threshold frequency f0, frequency of incident light f, light intensity P, photocurrent I, maximum kinetic energy of photoelectrons Tmax. Two of these quantities, when plotted as a graph of y against x, give a straight line through the origin. Which of the following correctly identifies x and y with the photoelectric quantities ?
x I y f0
x f y f0
x P y I
x P y Tmax
The correct Answer is:C
To solve the problem, we need to identify which two quantities among the given options give a straight line through the origin when plotted against each other. The quantities we are considering are:
1. Threshold frequency f0
2. Frequency of incident light f
3. Light intensity P
4. Photocurrent I
5. Maximum kinetic energy of photoelectrons Tmax
Step 1: Understand the relationship between the quantities.
- The photoelectric effect is described by Einstein's photoelectric equation:
Tmax=hf−ϕ
where h is Planck's constant and ϕ is the work function of the metal. This equation shows that Tmax is linearly related to the frequency f but does not pass through the origin because when f=f0 (the threshold frequency), Tmax=0.
Step 2: Analyze the relationship between intensity and photocurrent.
- The intensity P of light is proportional to the number of photons striking the metal surface per unit time. The photocurrent I is directly proportional to the number of photoelectrons emitted, which in turn is proportional to the number of incident photons (assuming each photon can release one electron).
- Therefore, we have the relationship:
I∝P
This means that if the intensity P is zero, the photocurrent I will also be zero, indicating that this relationship passes through the origin.
Step 3: Determine the correct quantities for the graph.
- Since we have established that I is directly proportional to P and passes through the origin, we can conclude that:
- Let x=P (light intensity)
- Let y=I (photocurrent)
Conclusion:
The correct identification of x and y is:
- x=P
- y=I
This means that when we plot photocurrent I against light intensity P, we get a straight line through the origin.
2. Frequency of incident light f
3. Light intensity P
4. Photocurrent I
5. Maximum kinetic energy of photoelectrons Tmax
- The photoelectric effect is described by Einstein's photoelectric equation:
Tmax=hf−ϕ
where h is Planck's constant and ϕ is the work function of the metal. This equation shows that Tmax is linearly related to the frequency f but does not pass through the origin because when f=f0 (the threshold frequency), Tmax=0.
- The intensity P of light is proportional to the number of photons striking the metal surface per unit time. The photocurrent I is directly proportional to the number of photoelectrons emitted, which in turn is proportional to the number of incident photons (assuming each photon can release one electron).
- Therefore, we have the relationship:
I∝P
This means that if the intensity P is zero, the photocurrent I will also be zero, indicating that this relationship passes through the origin.
- Since we have established that I is directly proportional to P and passes through the origin, we can conclude that:
- Let x=P (light intensity)
- Let y=I (photocurrent)
The correct identification of x and y is:
- x=P
- y=I
Topper's Solved these Questions
- PHOTOELECTRIC EFFECTBOOK - CENGAGE PHYSICS ENGLISHCHAPTER - PHOTOELECTRIC EFFECTEXERCISE - Multiple Correct
10 Videos
- PHOTOELECTRIC EFFECTBOOK - CENGAGE PHYSICS ENGLISHCHAPTER - PHOTOELECTRIC EFFECTEXERCISE - Linked Comprehension
44 Videos
- PHOTOELECTRIC EFFECTBOOK - CENGAGE PHYSICS ENGLISHCHAPTER - PHOTOELECTRIC EFFECTEXERCISE - Subjective
16 Videos
- NUCLEAR PHYSICSBOOK - CENGAGE PHYSICS ENGLISHCHAPTER - NUCLEAR PHYSICSEXERCISE - ddp.5.5
14 Videos
- RAY OPTICSBOOK - CENGAGE PHYSICS ENGLISHCHAPTER - RAY OPTICSEXERCISE - DPP 1.6
12 Videos
Similar Questions
If the frequency of light in a photoelectric experiment is double then maximum kinetic energy of photoelectron
View SolutionThe photoelectric threshold frequency of a metal is v. When light of frequency 4v is incident on the metal . The maximum kinetic energy of the emitted photoelectrons is
View Solution
Knowledge Check
Assertion : The stopping potential depends on the frequency of incident light.
Reason : The stopping potential is related to maximum kinetic energy by eV0=Kmax.AIf both assertion and reason are true and reason is the correct explanation of assertion.BIf both assertion and reason are true but reason is not the correct explanation of assertion.CIf assertion is true but reason is false.DIf both assertion and reason are false.According to Einstein's photoelectric equation, the plot of the maximum kinetic energy of the emitted photoelectrons from a metal versus frequency of the incident radiation gives a straight line whose slope
Adepends on the intensity of incident radiation.Bdepends on the nature of the metal and also on the intensity of incident radiation.Cis same for all metals and independent of the intensity of the incident radiation.Ddepends on the nature of the metal.The photoeletric threshold 4v is incident on the metal is v. When light of freqency 4v is incident on the metal, the maximum kinetic energy of the emitted photoelectron is
A4hvB3hvC5hvD5hv2
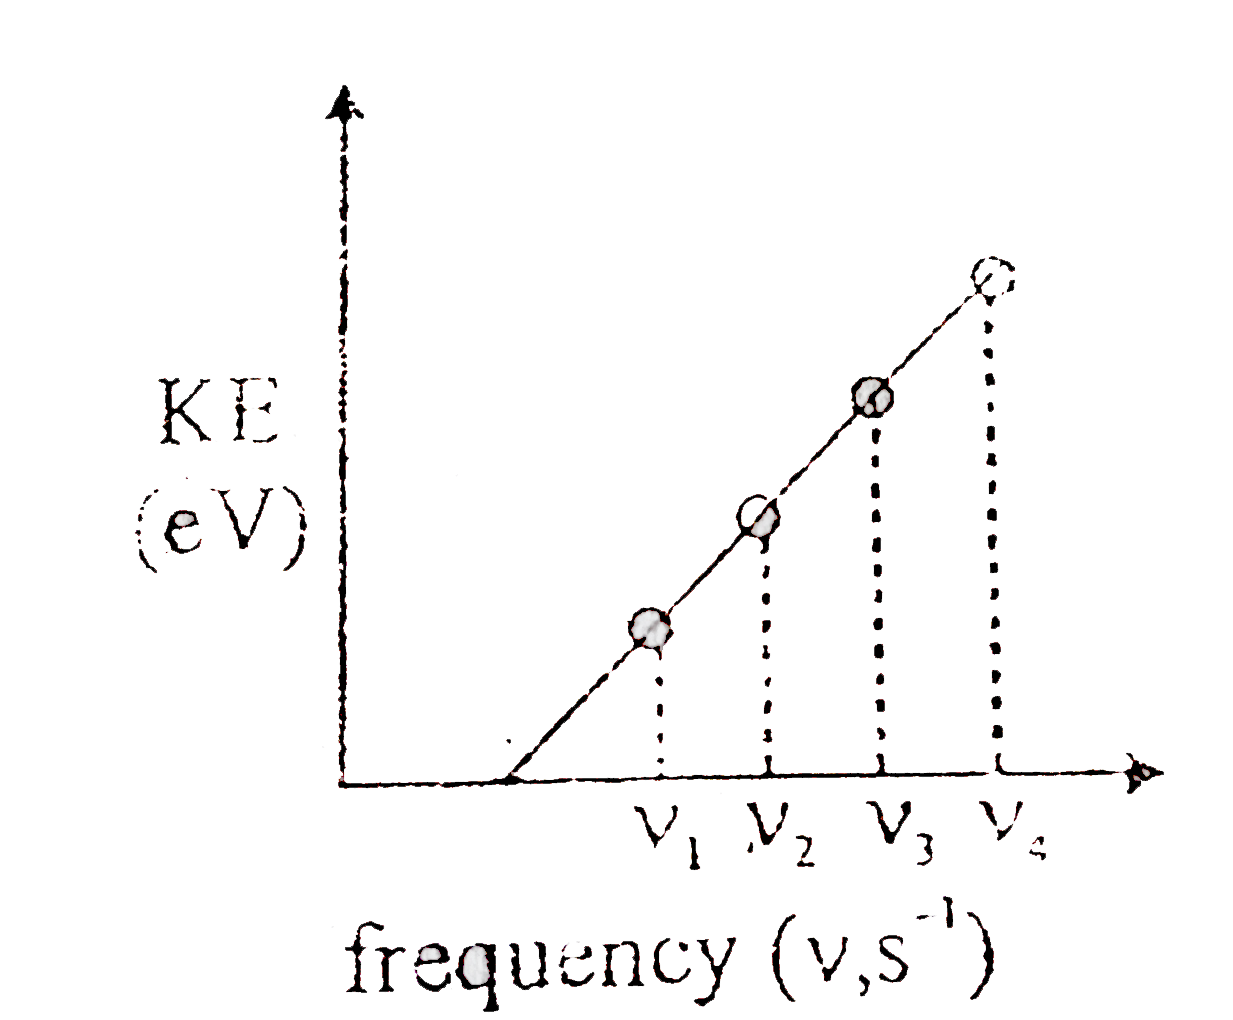
In a photoelectric experiment, kinetic energy of photoelectrons was plotted against the frequency of incident radition (v), as show in figure. Which of the following statements is correct ?

View SolutionAssertion: Stopping potential depends upon the frequency of incident light but is independent of the intensity of the light.
Reason :The maximum kinetic energy of the photoclectrons is proportional to stopping potential
View Solution
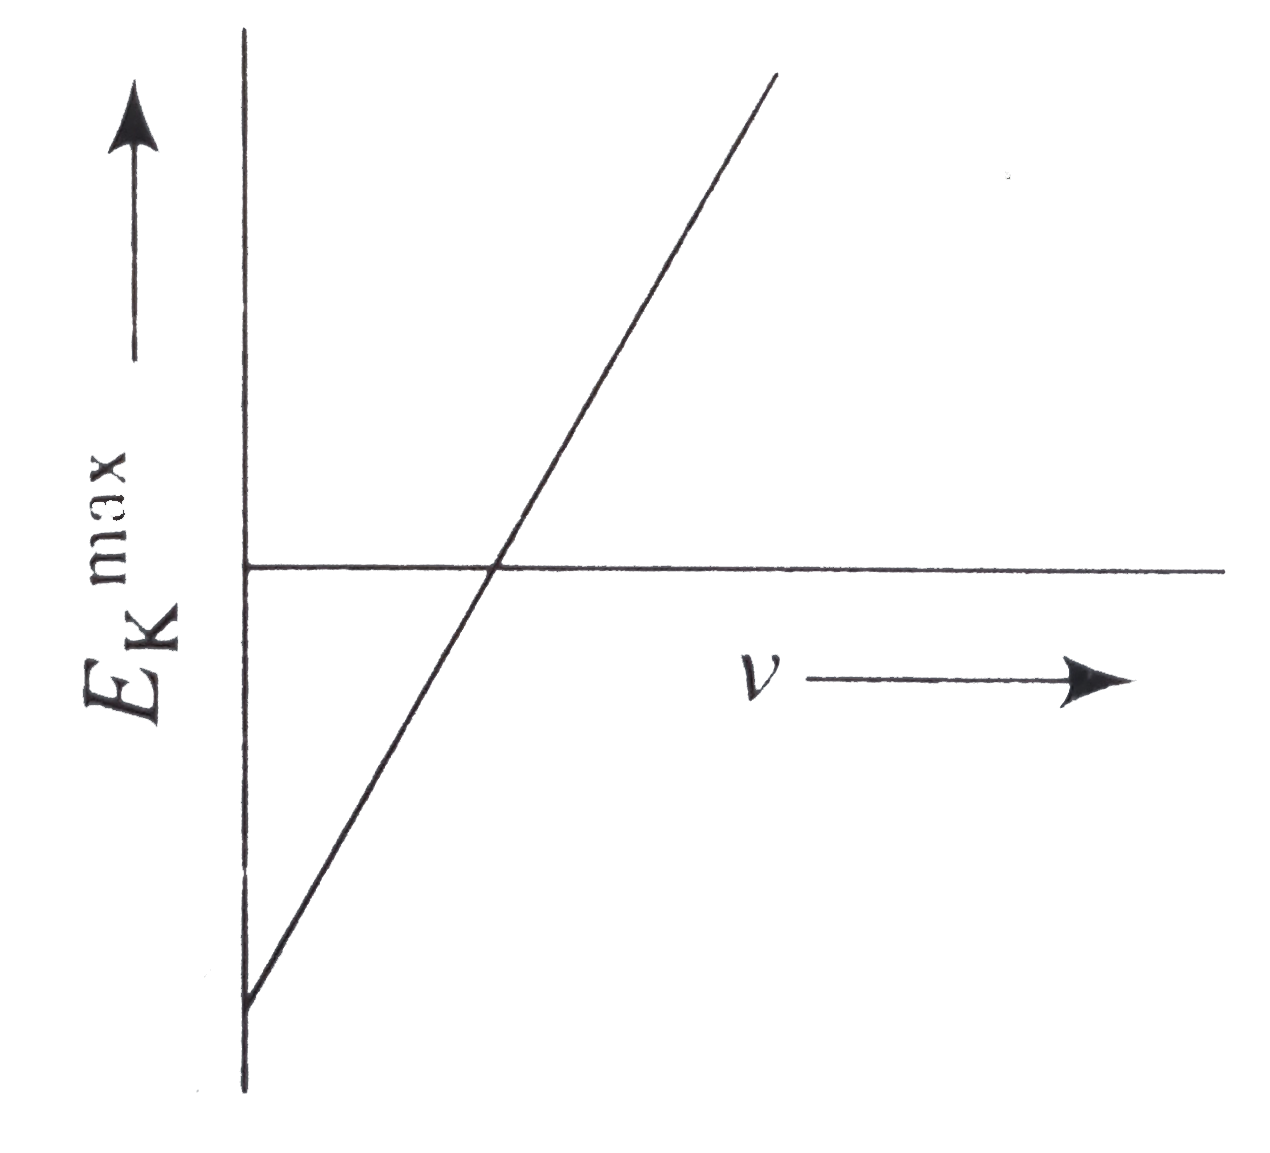
The maximum kinetic energy of the emitted photoelectrons against frequency υ of incident radiation is plotted as shown in Fig. This graph help us in determining the following physical quantities
View SolutionIf the work function of a metal is 'ϕ' and the frequency of the incident light is 'v', there is no emission of photoelectron if
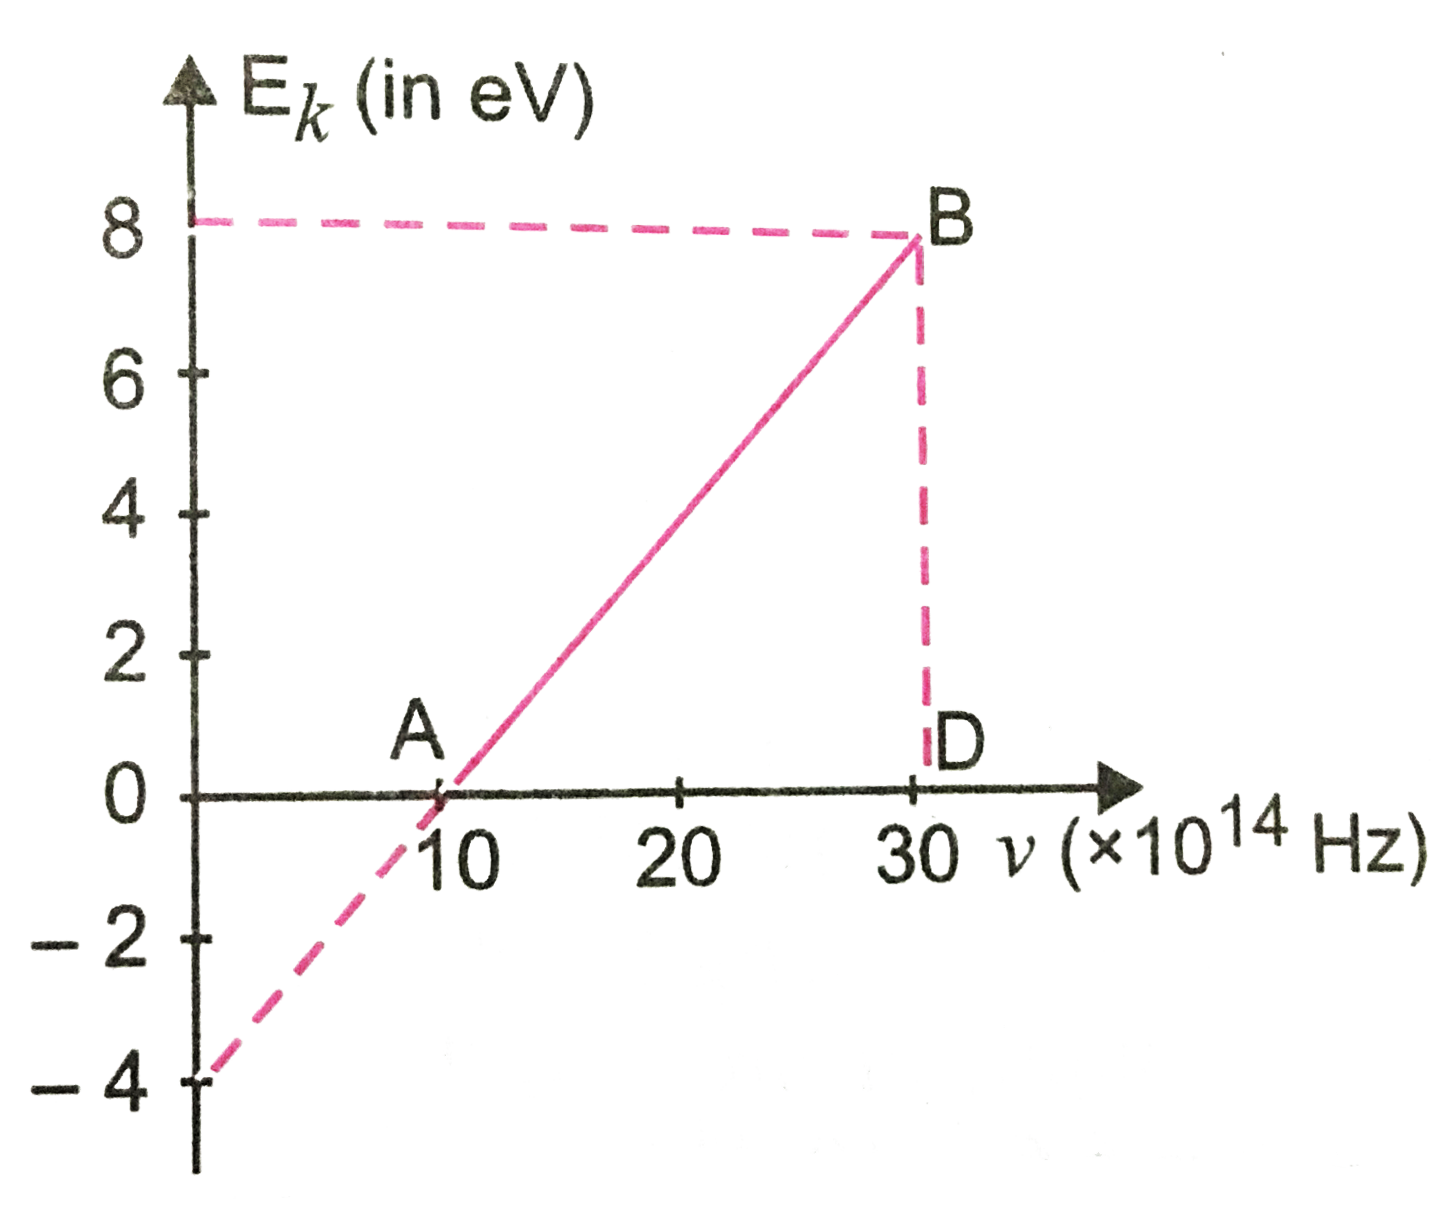
View SolutionGiven in fig. is the graph between frequency v of the incident light and maximum kinetic energy (Ek) of the emitted photoelectrons. Find the values of (i) threshold frequency and (ii) work function form the graph.

View Solution
