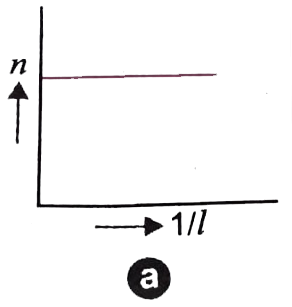
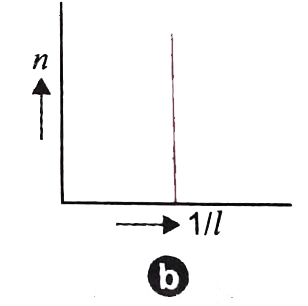
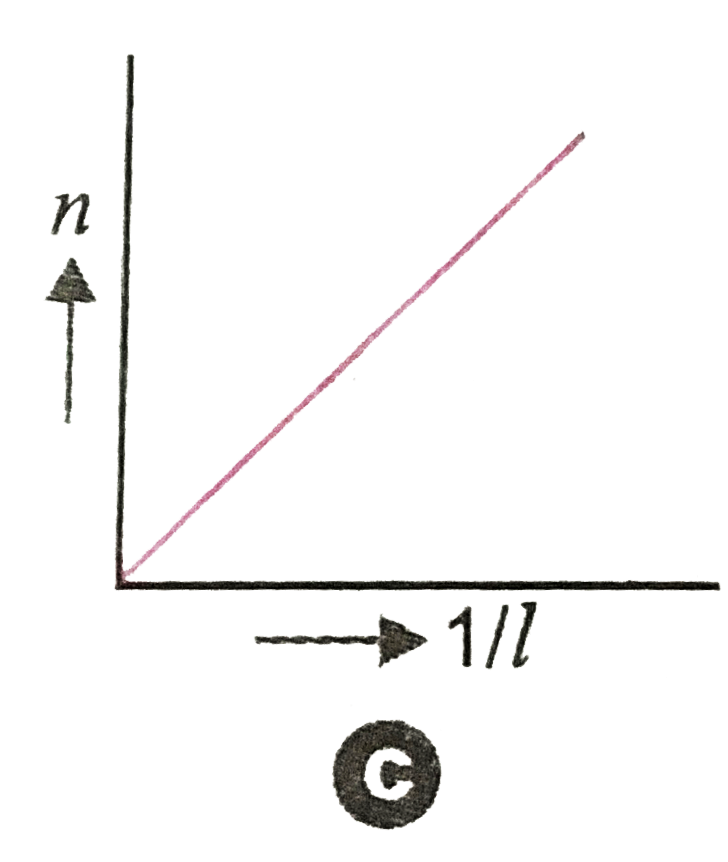
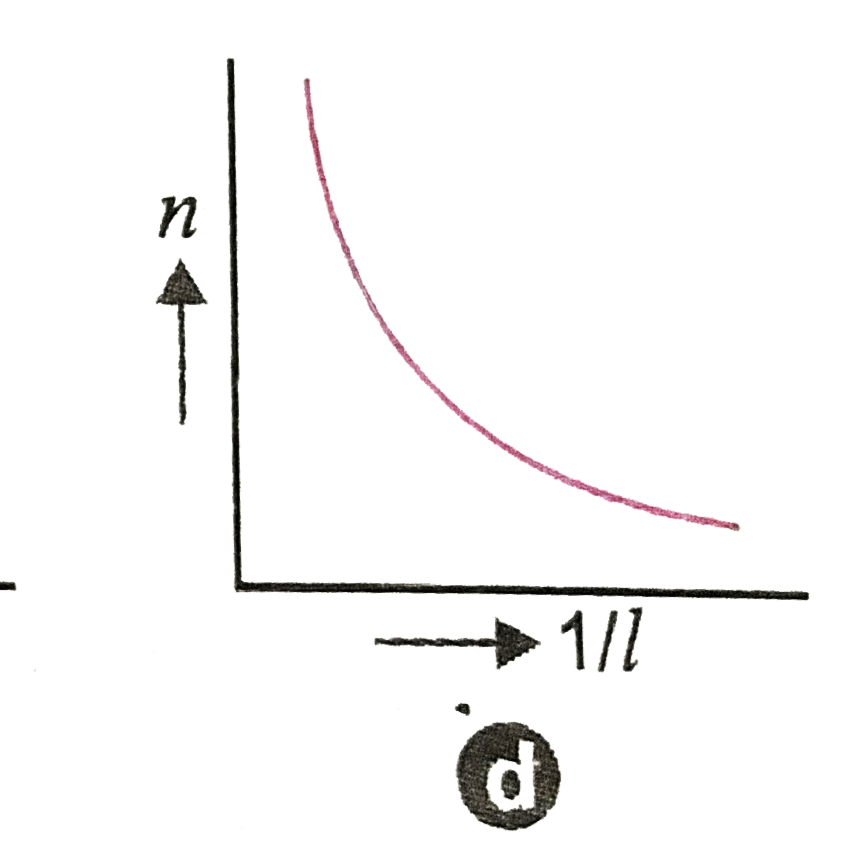
In a sonometer experiment, the graph between frequency n and reciprocaal of reonance length (1/l) is given by figure.
The correct Answer is:C
As, n∝1l, therefore, choise (c) is the correct graph.
Topper's Solved these Questions
- OSCILLATIONS AND WAVESBOOK - PRADEEPCHAPTER - OSCILLATIONS AND WAVESEXERCISE - Assertion-Reason Type Questions
23 Videos
- MATHEMATICAL TOOLSBOOK - PRADEEPCHAPTER - MATHEMATICAL TOOLSEXERCISE - Fill in the blanks
5 Videos
- PHYSICAL WORLD AND MEASUREMENTBOOK - PRADEEPCHAPTER - PHYSICAL WORLD AND MEASUREMENTEXERCISE - Competiton Focus Jee Medical Entrance
18 Videos
Similar Questions
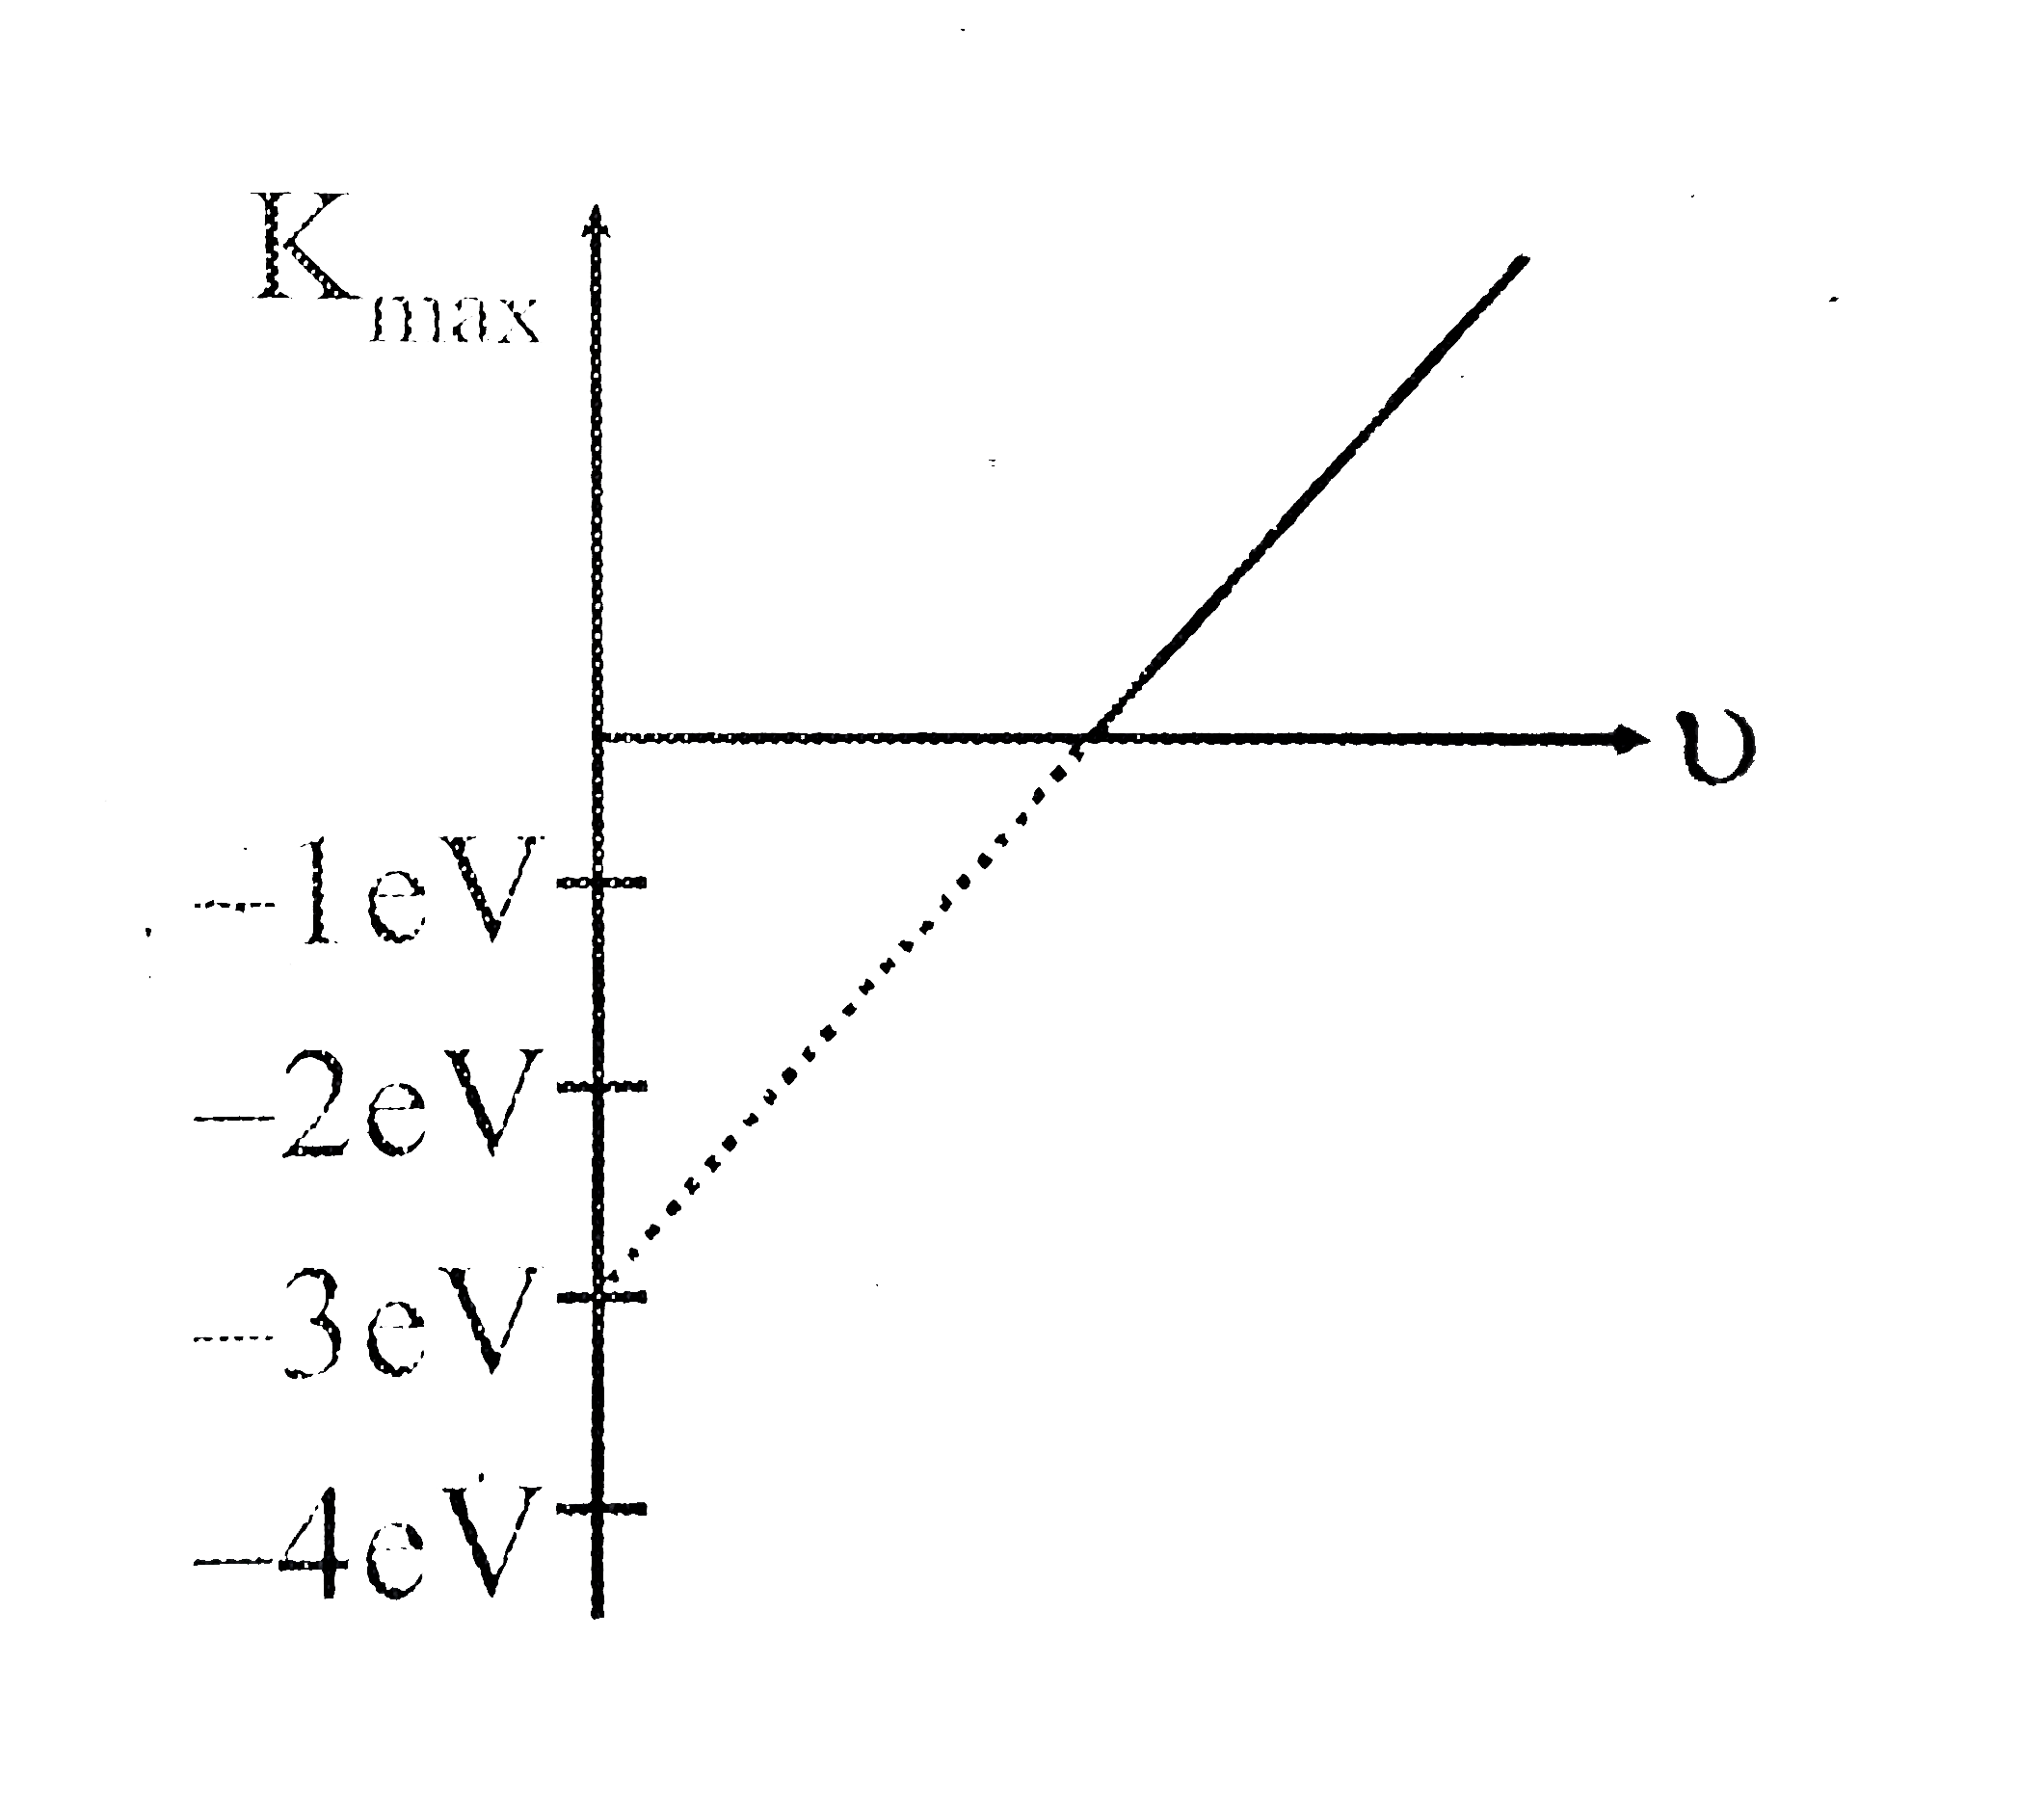
For a photoelectric experiment graph between kinetic energy of fastest electron and frequency of light is plotted find threshold wavelength of metal.
View SolutionIn a sonometer experiment, two wires are fixed whose tensions are in the ratio of 4 : 1, lengths in the ratio of 29 : 26 and diameter are in ratio of 2 : 1 and densities are in ratio of 4 : 5. What will be the frequency of beats produced if the frequency of note of higher pitch is 400 s−1 ?
View Solution
Knowledge Check
In Searl's experiment a graph is plotted between
Aload on hanger and radius of wireBload on hanger and mean value of spherometer screw readingCradius of the wire and spherometer screw readingDnone of theseThe graph between inductive reactance and frequency is
AparabolaBstraight lineChyperbolaDan arc of a circleIf the length of a sonometer, wire is increased, then its frequency
AIncreasesBDecreasesCRemains sameDNone of these.
Two vibrating strings of the same material but lengths L and 2L have radii 2r and r respectively. They are stretched under the same tension. Both the strings vibrate in their fundamental modes, the one of length L with frequency n1 and the other with frequency n2 the ratio n1/n2 is given by
View SolutionIn a photoelectric effect experiment, the slope of the graph between the stopping potential and the incident frequency will be :
View SolutionIn a photoelectric effect experiment, the slope of the graph between the stopping potential and the incident frequency will be :
View SolutionIn photoelectric effect the slope of stop of stopping potential versus frequency of incident light for a given surface will be
View SolutionThe correct graph between the frequency n and square root of density ρ of a wire, keeping its length, radius and tension constant, is
View Solution
