In an experiment of verification of Ohm's law, following observations are obtained.

Draw a V-I graph and use this graph to find :
the potential difference V when the current / is 0-5 A,
1.25V
Topper's Solved these Questions
- CURRENT ELECTRICITYBOOK - ICSECHAPTER - CURRENT ELECTRICITYEXERCISE - EXERCISE-8(B)
15 Videos
- CURRENT ELECTRICITYBOOK - ICSECHAPTER - CURRENT ELECTRICITYEXERCISE - EXERCISE-8(B) (MULTIPLE CHOICE TYPE)
3 Videos
- CURRENT ELECTRICITYBOOK - ICSECHAPTER - CURRENT ELECTRICITYEXERCISE - EXERCISE-8(A) ( MULTIPLE CHOICE TYPE)
2 Videos
- CALORIMETRYBOOK - ICSECHAPTER - CALORIMETRYEXERCISE - EXERCISE-11(B) (NUMERICALS)
15 Videos
- ELECTRO-MAGNETISM BOOK - ICSECHAPTER - ELECTRO-MAGNETISM EXERCISE - EXERCISE-10 (C) NUMERICALS
1 Videos
Similar Questions
In an experiment of verification of Ohm's law, following observations are obtained.

Draw a V-I graph and use this graph to find :
the resistance in circuit.
View SolutionIn an experiment of verification of Ohm's law, following observations are obtained.

Draw a V-I graph and use this graph to find :
the current / when the potential difference V is 0.75 V,
View SolutionDraw a graph of potential difference (V) versus current (I) for an ohmic resistor.
View SolutionFor a metallic wire, the ratio Vi ( V= applied potential difference and i= current flowing ) is
View SolutionDraw a graph of Potential difference (V) versus Current (I) for an ohmic resistor.
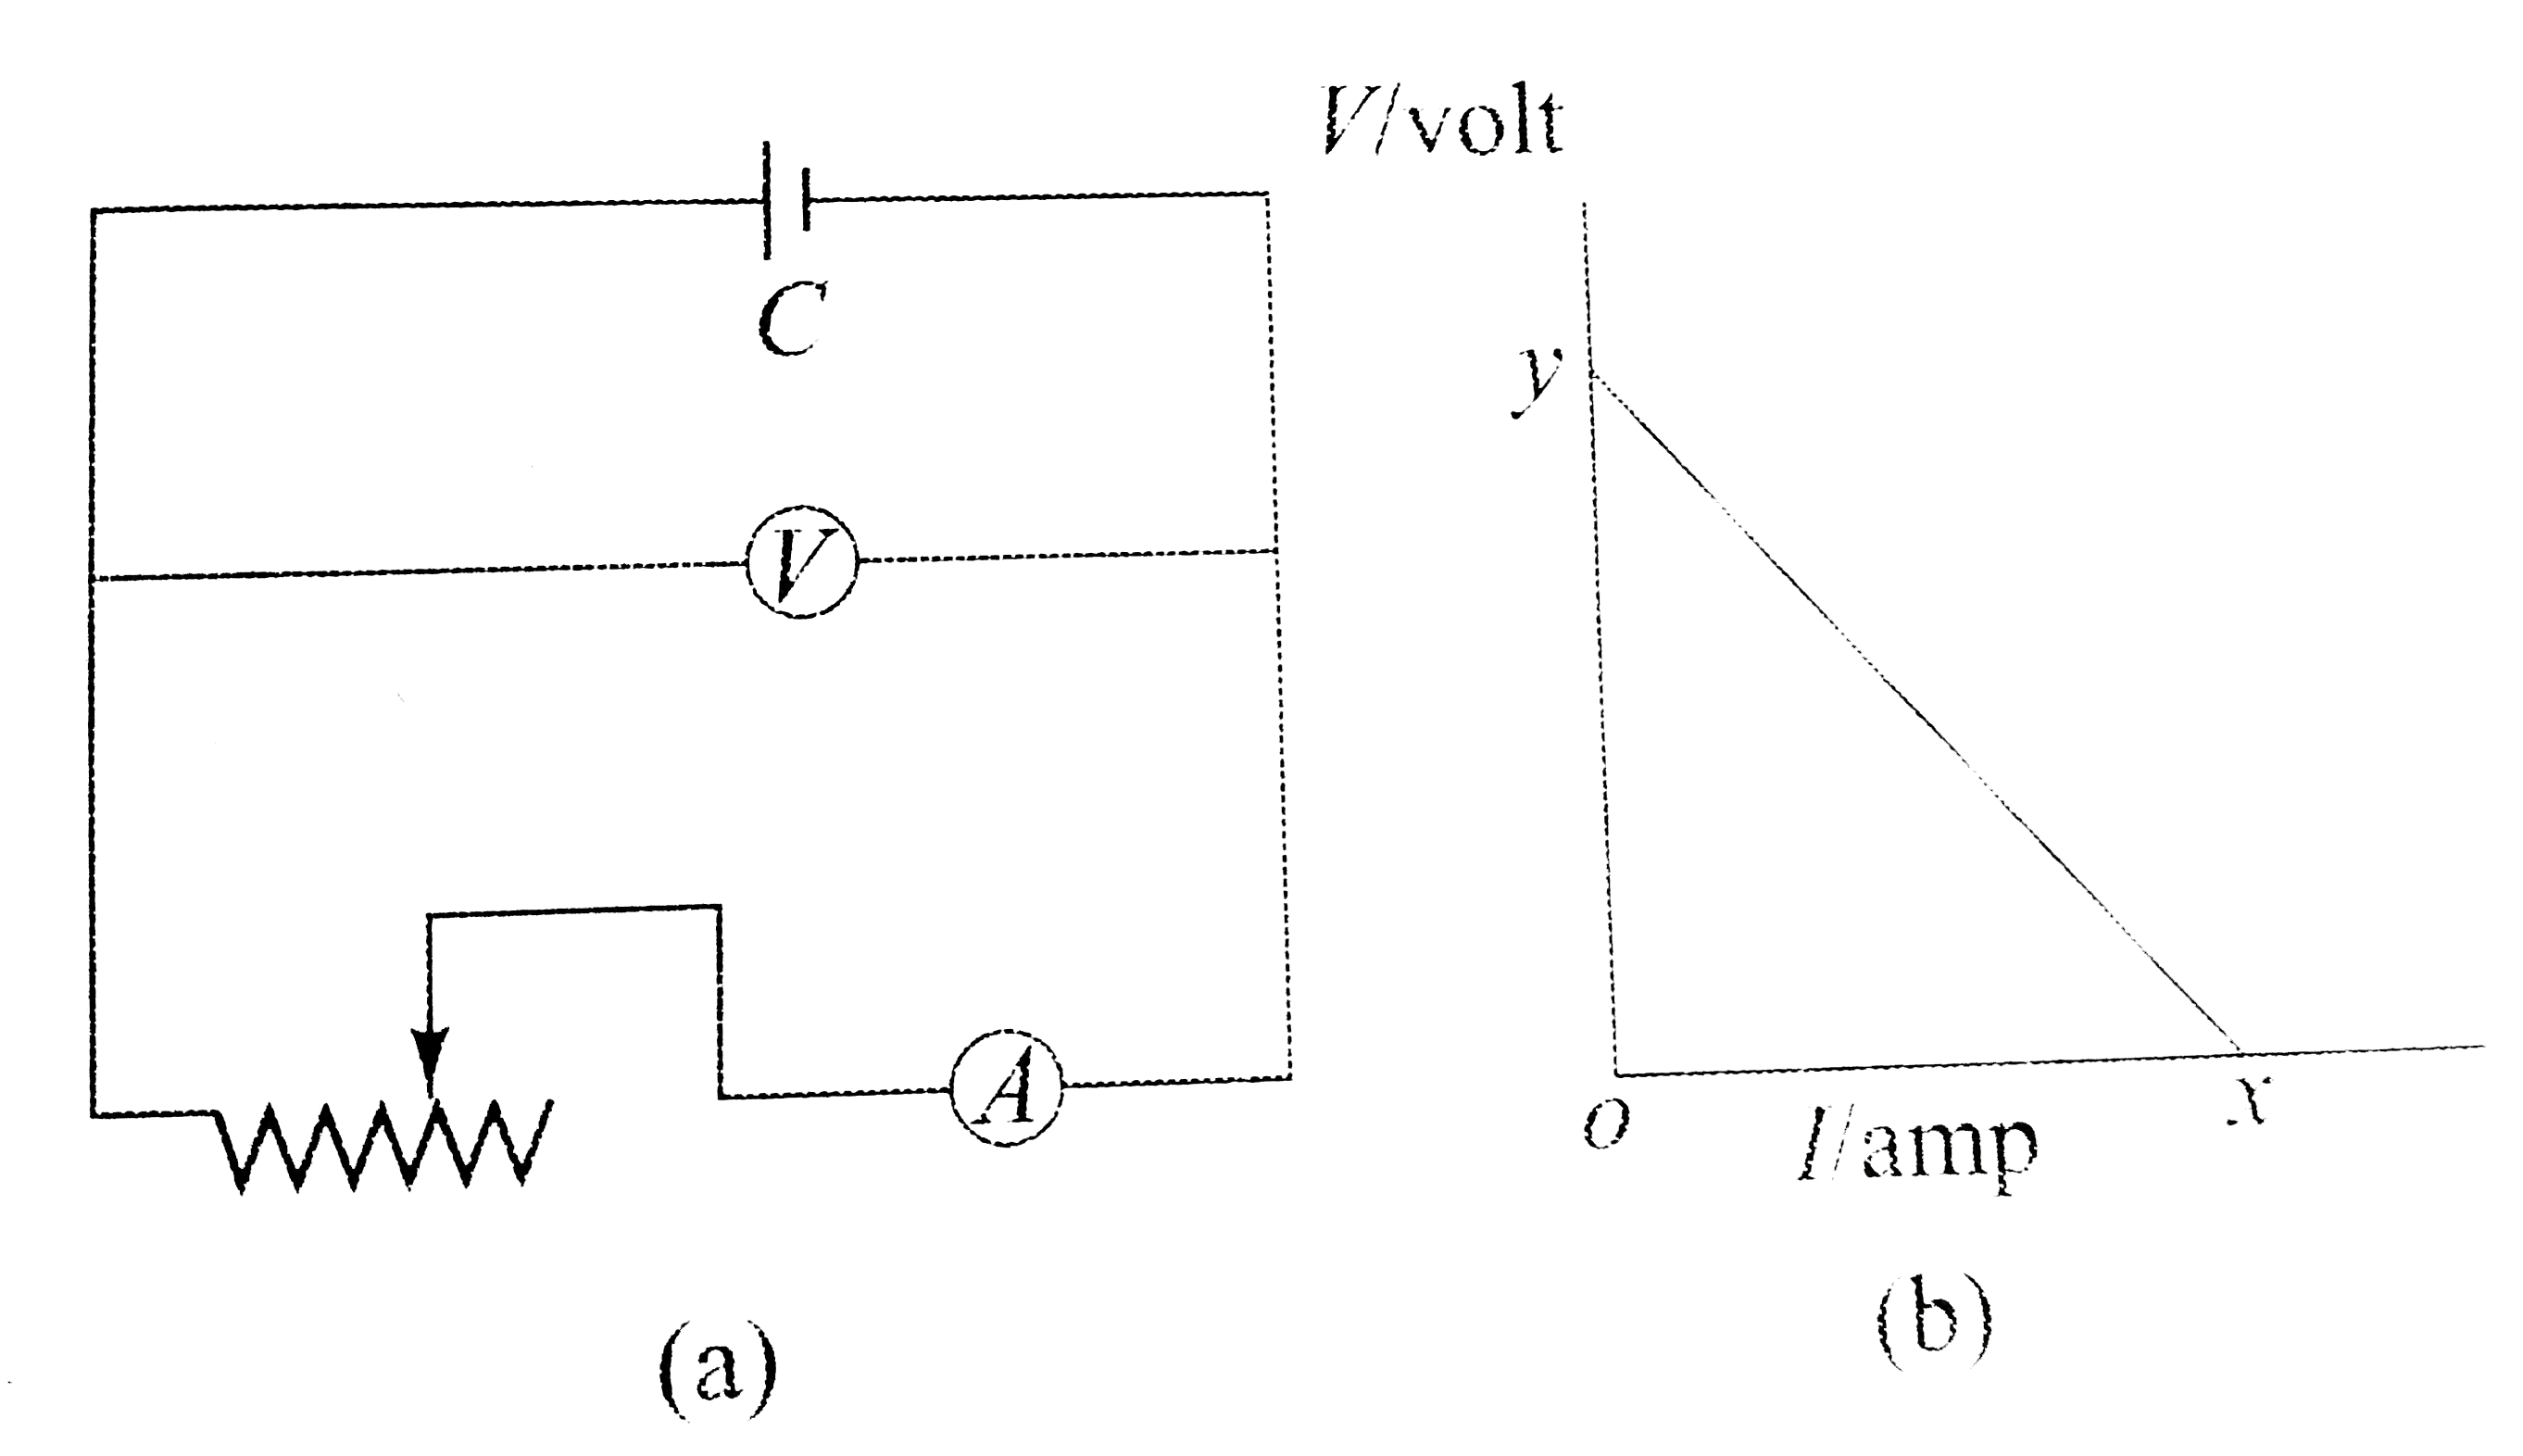
View Solutionshows a circuit used in an experiment to detrmine the emf and interanl resistance of the battery C. A graph was plotted of the potential difference V between the terminals of the battery against the current I, which was varied by adjusting the rheostat. The graph is shown in x and y are the intercepts of the graph with the axes as shown. What is the internal resistance of the battery?

View SolutionThe slope of the graph showing the variation of potential difference V on X-axis and current Y-axis gives conductor
View SolutionHow are the potential difference (V), current (I) and resistance (R) related ?
View SolutionWhich of the following.v-t graph can be obtained in practice?

View SolutionWhen the current in the portion of the circuit shown in the figure is 2A and increasing at the rate of 1A/s,the measured potential difference Va−Vb=8V.However when the current is 2A and decreasing at the rate of 1A/s, the measured potential difference Va−Vb=4V.The values of R and L are:

View Solution
