In given figure three curves a, b and c shows variation of resistance, (R) capacitive reactance (Xc) and inductive (XL) reactance with frequency. Identify the respective curves for these.
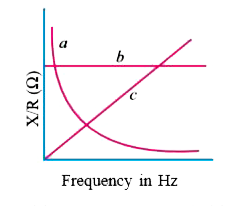
Step by step video & image solution for In given figure three curves a, b and c shows variation of resistance, (R) capacitive reactance (X_c) and inductive (X_L) reactance with frequency. Identify the respective curves for these. by Physics experts to help you in doubts & scoring excellent marks in Class 12 exams.
Topper's Solved these Questions
- BOOK - CBSE COMPLEMENTARY MATERIALCHAPTER - UNIT–III & UNIT–IV MAGNETIC EFFECTS OF CURRENT AND MAGNETISM & E.M.I. AND ALTERNATING CURRENTEXERCISE - SHORT ANSWER QUESTIONS (2 Marks)41videos
UNIT–III & UNIT–IV MAGNETIC EFFECTS OF CURRENT AND MAGNETISM & E.M.I. AND ALTERNATING CURRENT
- BOOK - CBSE COMPLEMENTARY MATERIALCHAPTER - UNIT–III & UNIT–IV MAGNETIC EFFECTS OF CURRENT AND MAGNETISM & E.M.I. AND ALTERNATING CURRENTEXERCISE - SHORT ANSWERS QUESTIONS (3 Marks)27videos
UNIT–III & UNIT–IV MAGNETIC EFFECTS OF CURRENT AND MAGNETISM & E.M.I. AND ALTERNATING CURRENT
- BOOK - CBSE COMPLEMENTARY MATERIALCHAPTER - SAMPLE QUESTION PAPER 2019EXERCISE - Section C19videos
SAMPLE QUESTION PAPER 2019
Similar Questions
Knowledge Check
- Question 1 - Select One
An alternating power supply of 220 V is applied across a series circuit of resistance 10√3Ω, capacitive reactance 40Ω and inductive reactance 30Ω The respective current in the circuit in the circuit for zero and infinite frequencies are
A2A,12AB0A,10AC10A,0AD0A,0A - Question 2 - Select One
In L-R circuit, resistance is 8Ω and inductive reactance is 6Ω then impedance is:
A2ΩB14ΩC4ΩD10Ω - Question 3 - Select One
Identify the graph which correctly reperesents the variation of capacitive reactance XC with frequency
A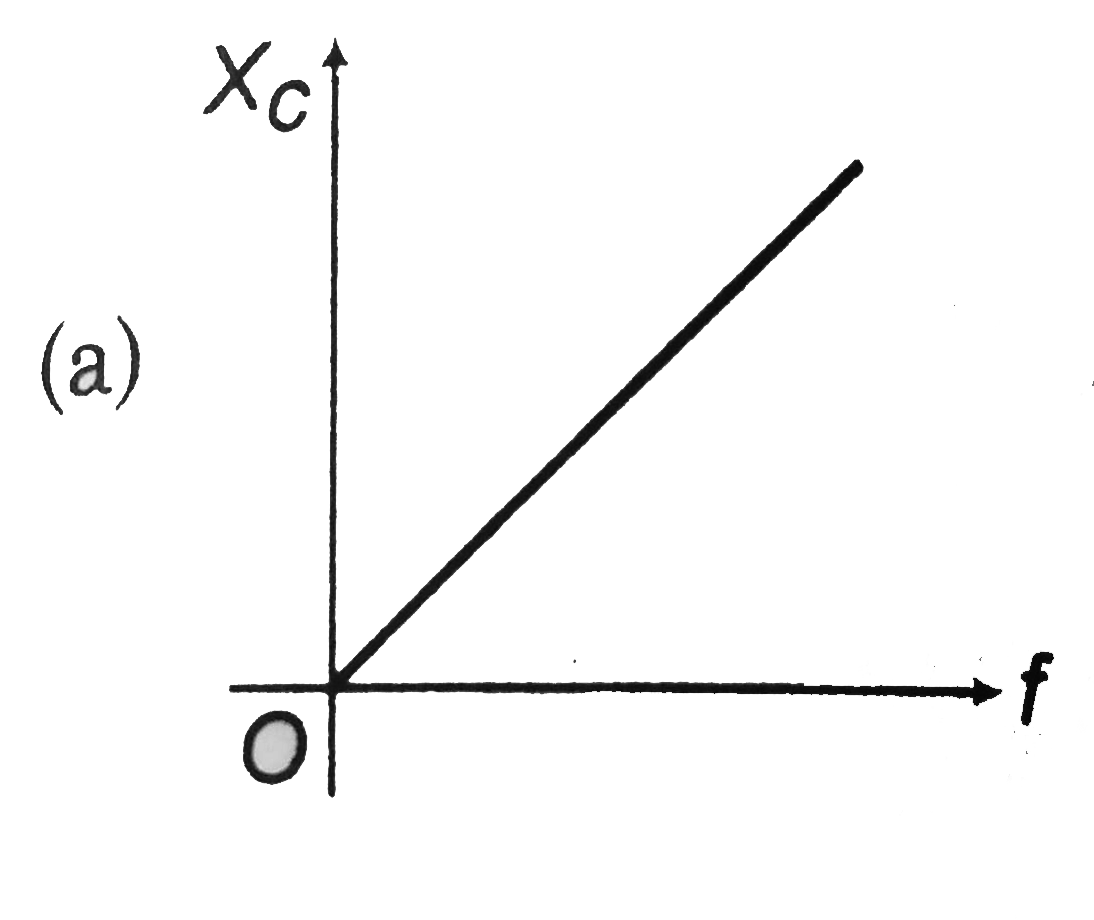 B
B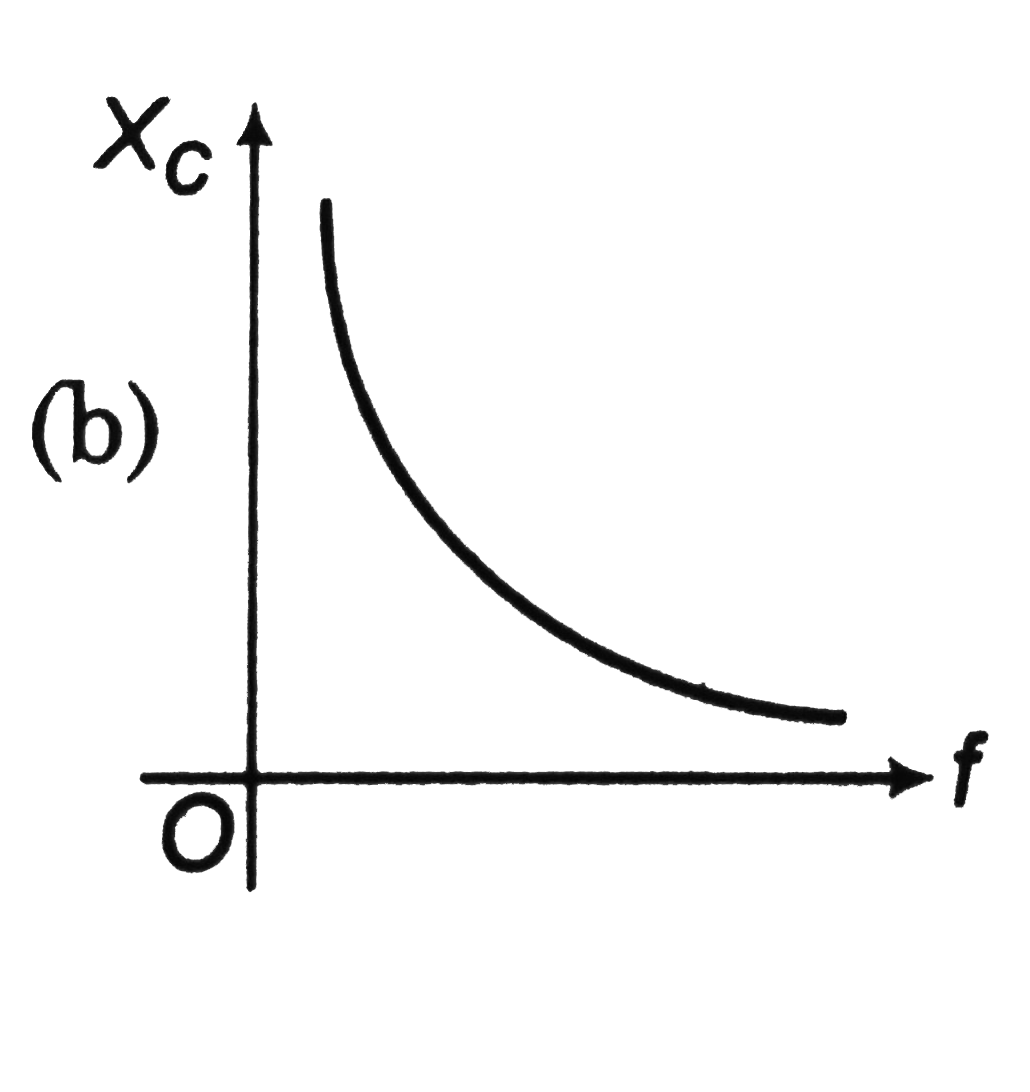 C
C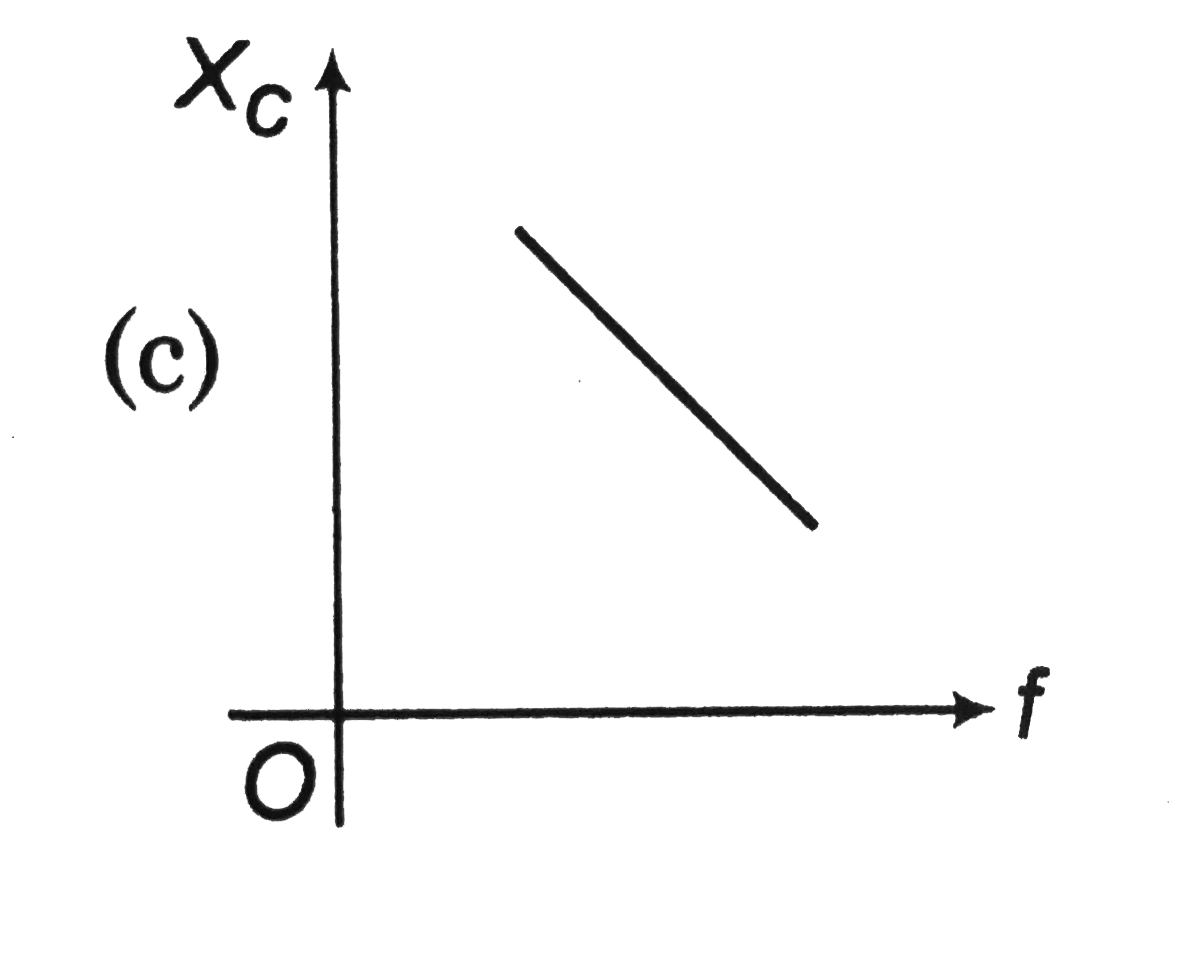 D
D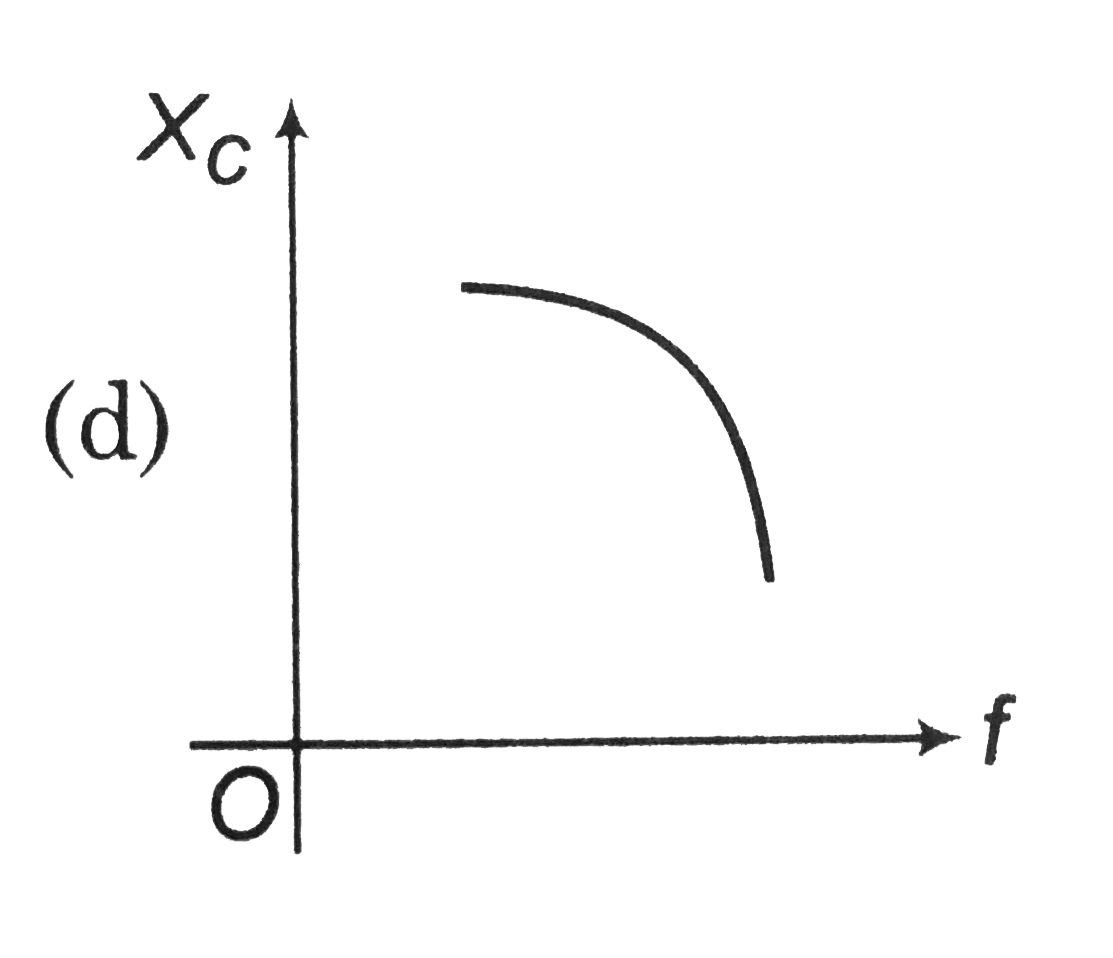
Plot a graph showing variation of capacitive reactance with the change in the frequency of the AC source.
View SolutionSketch a graph showing the variation of capacitive reactance with the change in frequency of the a.c. source.
View Solution(i) Draw the graphs showing variation of inductive reactance and capacitive reactance with frequency of applied a.c. source.
(ii) Can the voltage drop across the inductor or the capacitor in a series LCR circuit be greater than the applied voltage of the a.c. source ? Justify your answer.View SolutionThe inductance of a coil is 0.25 H. Calculate its inductive reactance in a.c. frequency 50 Hz.
View SolutionIn a series L–C–R circuit XL,XCandR are the inductive reactance, capacitive reactance and resistance respectively at a certain frequency f. If the frequency of a.c. is doubled, what will be the values of reactances and resistance of the circuit?
View Solution

