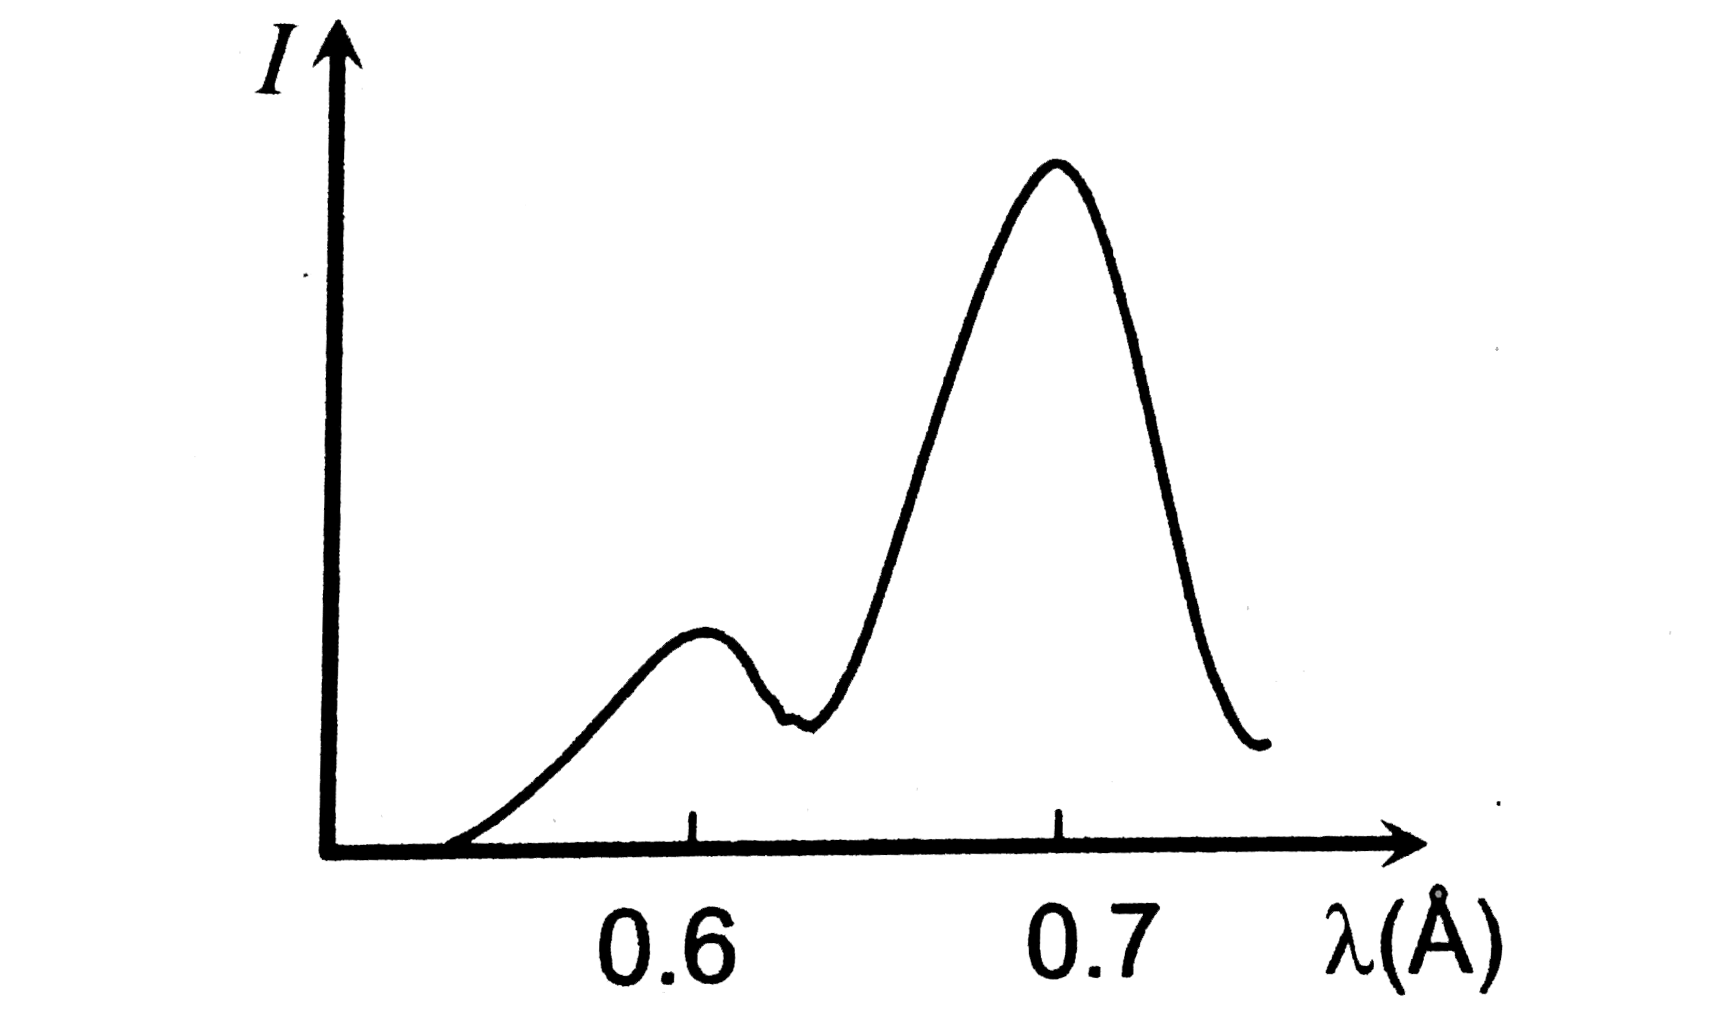
In the diagram a graph between the intensity of X-rays emitted by a molybdenum target and the wavelength is shown , when electrons of 30keV are incident on the target. In the graph one peak is of Kα line and the other peak is of Kβ line

first peak is of Kα line at 0.6Å
highest peak is of Kα line at 0.7Å
if the energy of incident particle is increased, then the peak will shift toward left
If the energy of incident particle is increased then the paak will shift toward right
The correct Answer is:B
Step by step video & image solution for In the diagram a graph between the intensity of X-rays emitted by a molybdenum target and the wavelength is shown , when electrons of 30 keV are incident on the target. In the graph one peak is of K_(alpha) line and the other peak is of K_(beta) line by Physics experts to help you in doubts & scoring excellent marks in Class 12 exams.
Updated on:21/07/2023Topper's Solved these Questions
- ATOMIC PHYSICSBOOK - CENGAGE PHYSICS ENGLISHCHAPTER - ATOMIC PHYSICSEXERCISE - dpp 4.2
15 Videos
- ALTERNATING CURRENTBOOK - CENGAGE PHYSICS ENGLISHCHAPTER - ALTERNATING CURRENTEXERCISE - Single Correct
10 Videos
- CAPACITOR AND CAPACITANCEBOOK - CENGAGE PHYSICS ENGLISHCHAPTER - CAPACITOR AND CAPACITANCEEXERCISE - Integer
5 Videos
Similar Questions
Calculate the wavelength of Kα line for the target made of tungsten (Z=74).
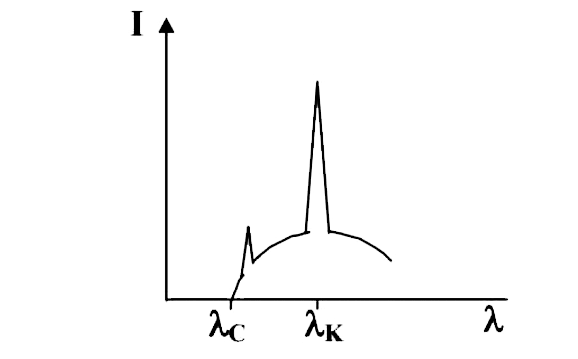
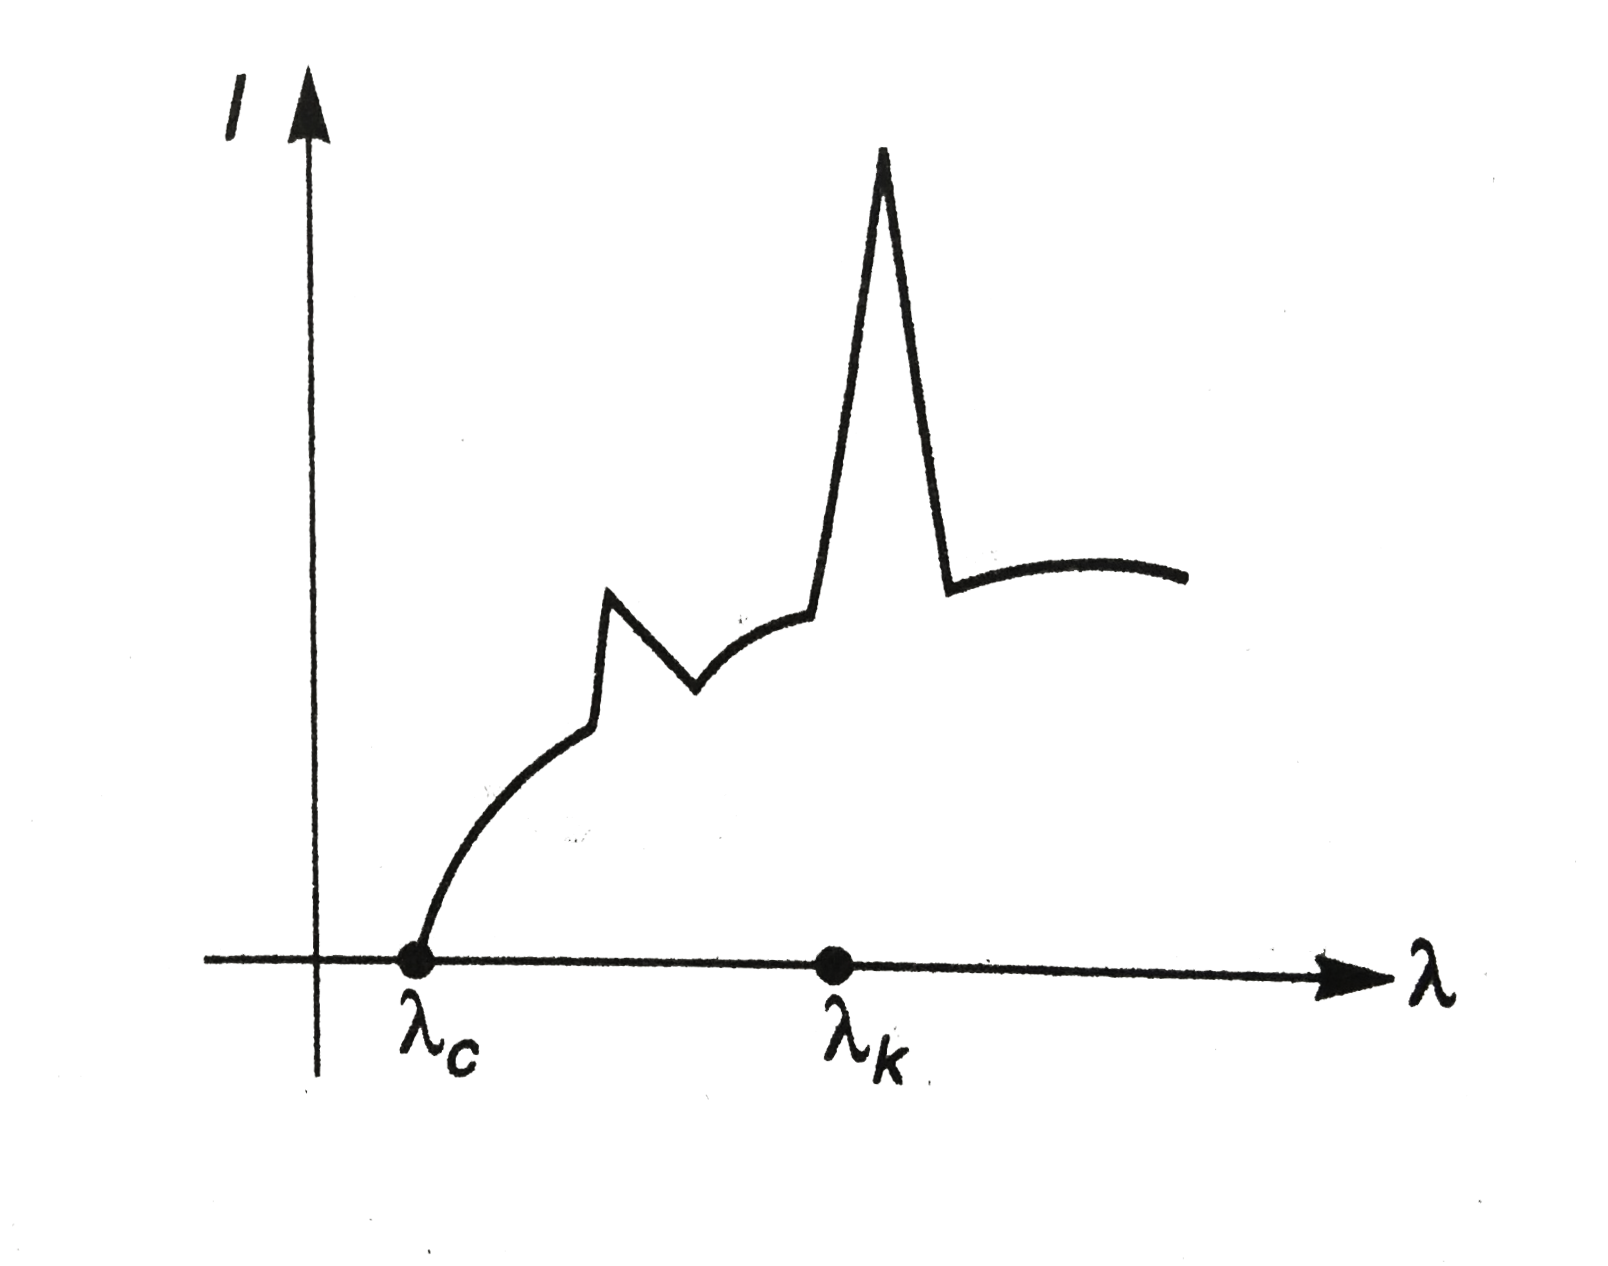
View SolutionThe intensity of X- ray from a coolidge tube is plotted againest wavelength λ as shown in the figure . The minimum wavelength found λc and the wavelength of theka line is λk, As the accelerating voliage is increase

View SolutionThe intensity of X-rays form a Coolidge tube is plotted against wavelength λ as shown in the figure. The minimum wavelength found is λc and the wavelength of the Kα line is λk. As the accelerating voltage is increased

(a) λk−λc increases (b) λk−λc decreases
(c ) λk increases (d) λk decreases
View SolutionObtain a relation between the frequencies of Kα,Kβ and Lα line for a target metrial .
View SolutionIn X-ray tube , when the accelerating voltage V is halved, the difference between the wavelength of Kα line and minimum wavelength of continuous X-ray spectrum
View SolutionFrom what meterial is the anod of an X-ray tube made if the Kα line wavelength of thej characteristic spectrum is 0.76Å?
View SolutionThe wavelength of Kα X-ray line for an element is 0.42Å . Find the wavelength of Kβ line emitted by the same element.
View SolutionThe wavelength of the characteristic X - ray kα line emitted by a hydrogens like element is 0.32λ . The wavelength of the Kβ line emitted by the same element will be …..
View Solutionstate True or False for the given statement a. X-ray are electromagnetic waves because these are producted by the deceleration of fast moving electron .
b. X-ray are electromagnetic waves because these produce line spectrum.
c. the cut-off wavelength depends on the target material .
d. The intensity of Kα transition is more probable then of Kβ
transition.
e. Frequency of Kα radiation is more than that of Kβ.
View SolutionA target element A is bombarded with electrons and the wavelengths of the characterstic spectrum are measured. A second characteristic spectrum is also obtained , because of an impurity in the target. The wavelengths of the Kα lines are 196 pm (element A) and 169 pm (impurity). If the atomic number of impurity is z=(10λ−1) . Find the value of λ . (atomic number of element A is 27).
View Solution
