In the following graph (Fig. 2.4) of displacement versus time, 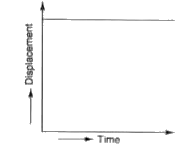
the body is at rest
the body has some initial speed
the body moves with sonstant speed
the body moves with constant velocity
The correct Answer is:A
Step by step video, text & image solution for In the following graph (Fig. 2.4) of displacement versus time, by Physics experts to help you in doubts & scoring excellent marks in Class 10 exams.
Updated on:21/07/2023Topper's Solved these Questions
- MOTIONBOOK - MCGROW HILL PUBLICATIONCHAPTER - MOTIONEXERCISE - HIGHER ORDER THINKING QUESTIONS
48 Videos
- MISCELLANEOUS QUESTIONSBOOK - MCGROW HILL PUBLICATIONCHAPTER - MISCELLANEOUS QUESTIONSEXERCISE - PART-B
99 Videos
- REFLECTION OF LIGHT BOOK - MCGROW HILL PUBLICATIONCHAPTER - REFLECTION OF LIGHT EXERCISE - HIGHER ORDER THINKING QUESTIONS
10 Videos
Similar Questions
i.The acceleration versus time graph of a partical SHM is shown in the figure . Plot the displacement versus time graph
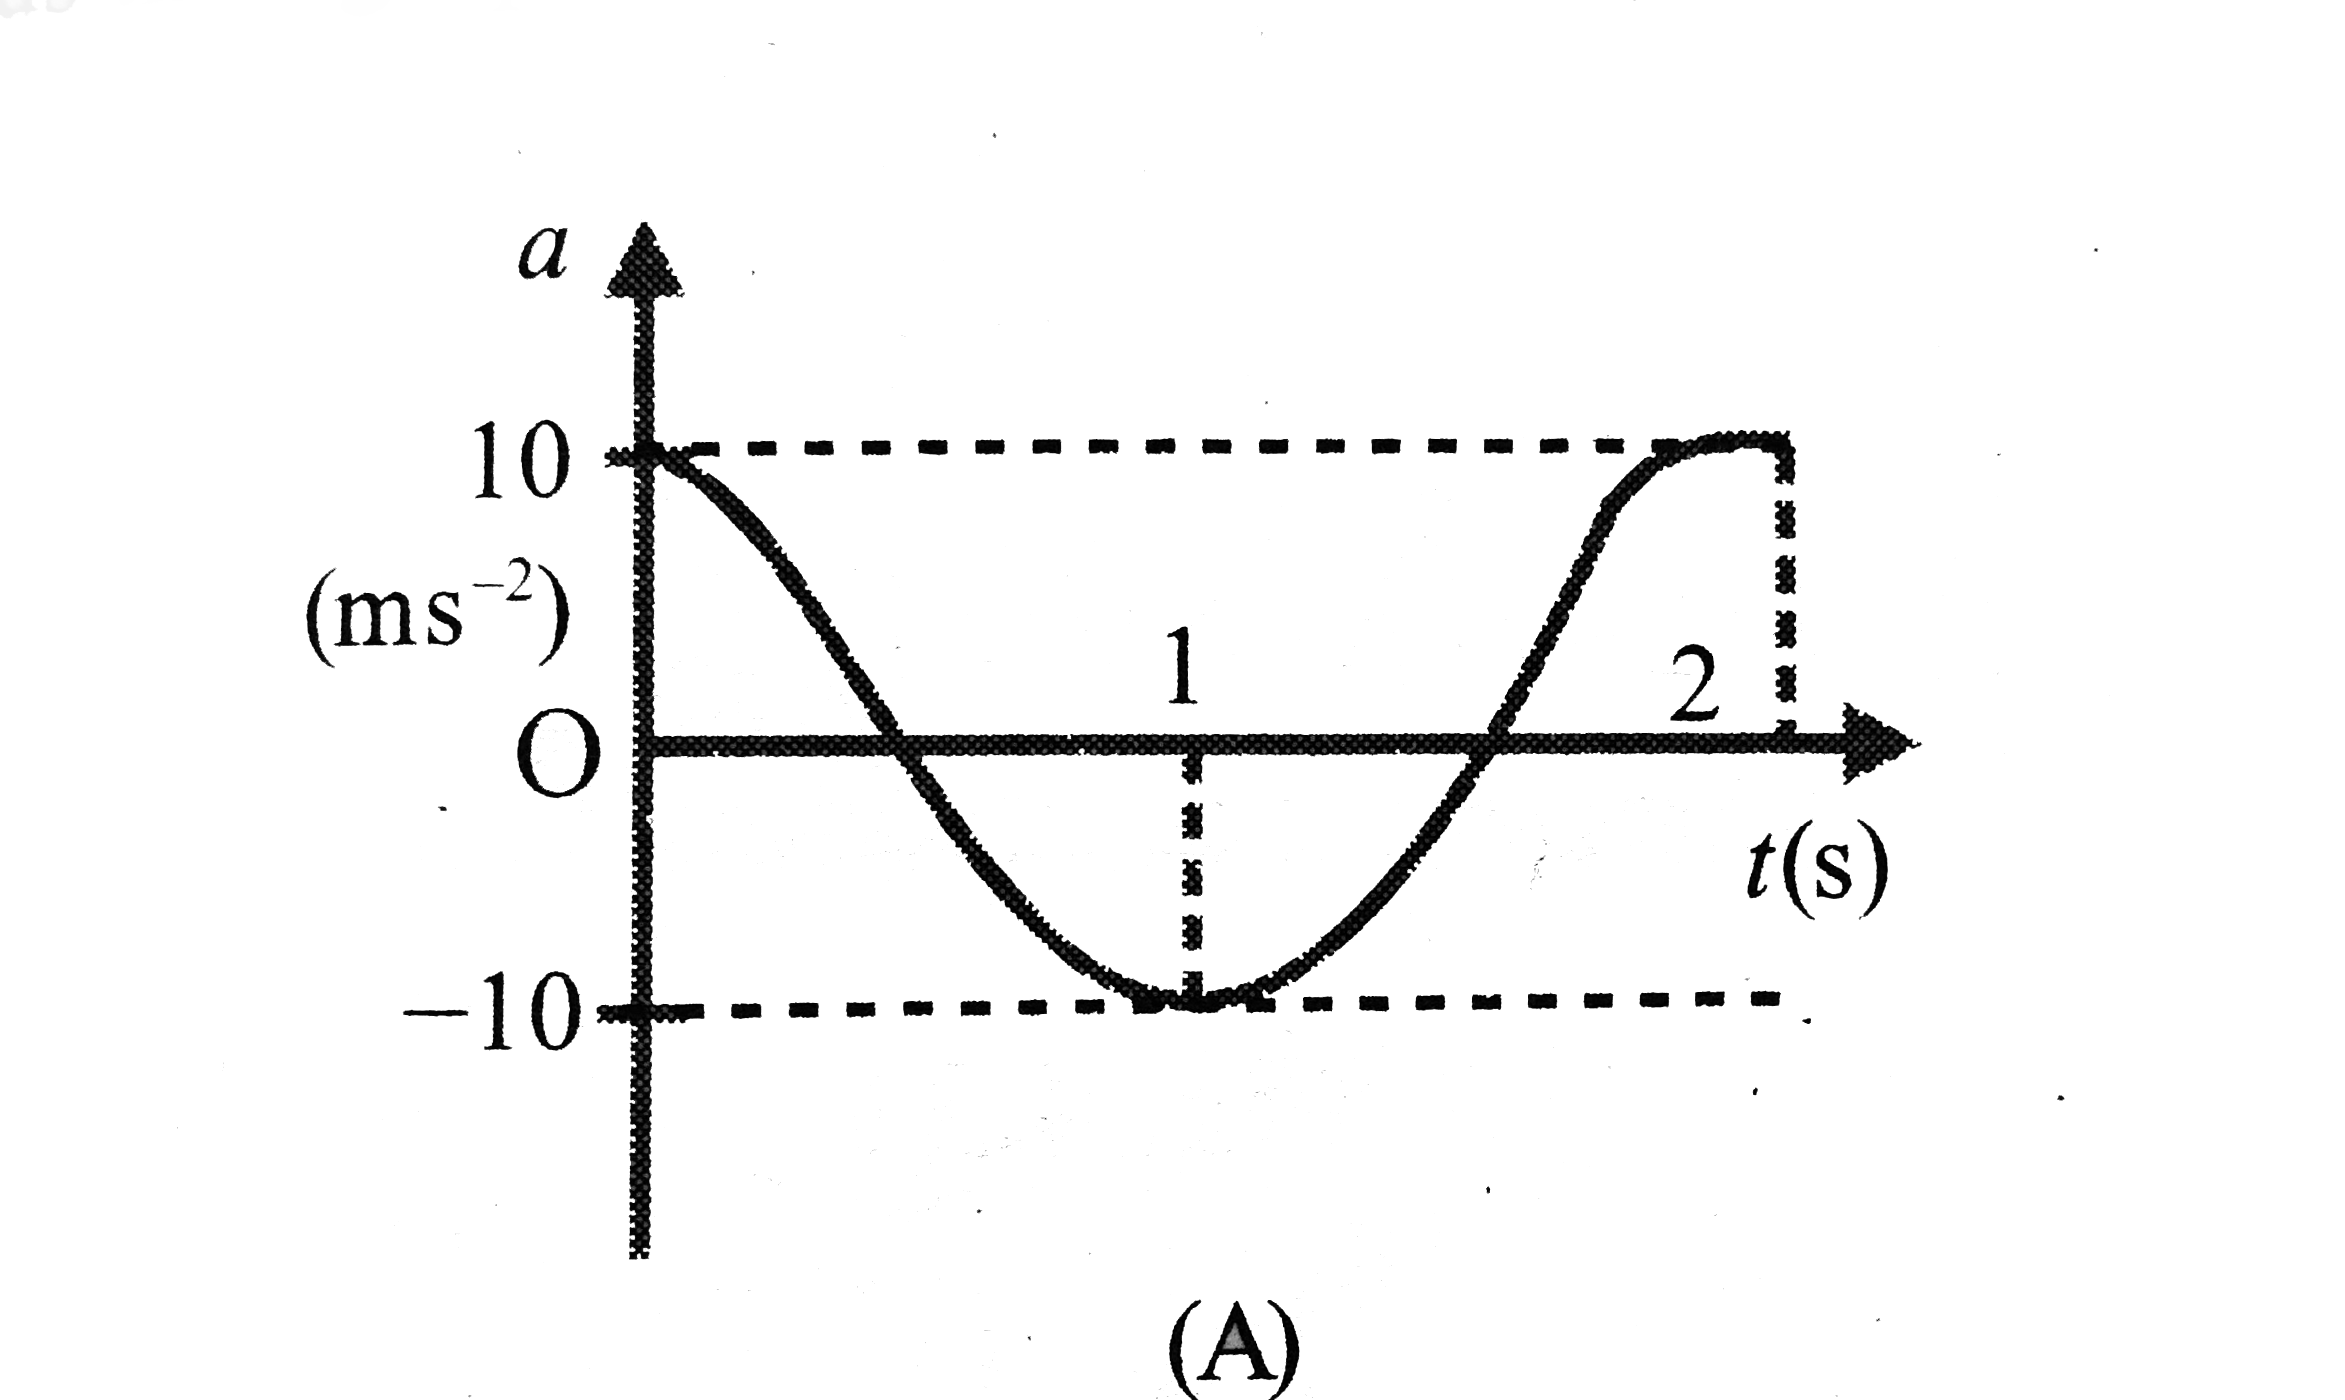
ii. The frection of oscillation is……..
iii. The displacement amplitude is ………
iv. At t=0, the velocity of the partical is ......
v. The kinetic energy of the partical is maximum at t=....... and t = ......
vi. The potential energy is maximum at t = ....... : t = ..... ans t = .........
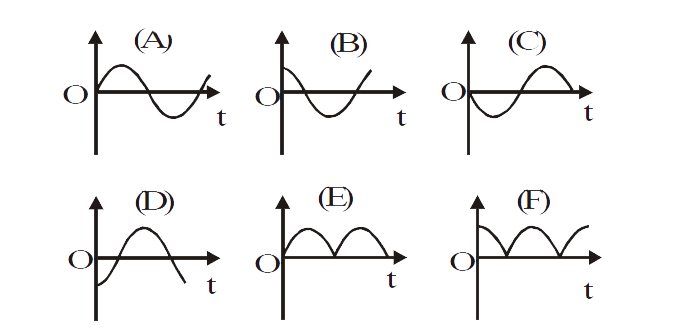
View SolutionThe displacement of a particle in S.H.M. is x=asinωt. Which of the following graph between displacement and time is correct :
View Solution
Knowledge Check
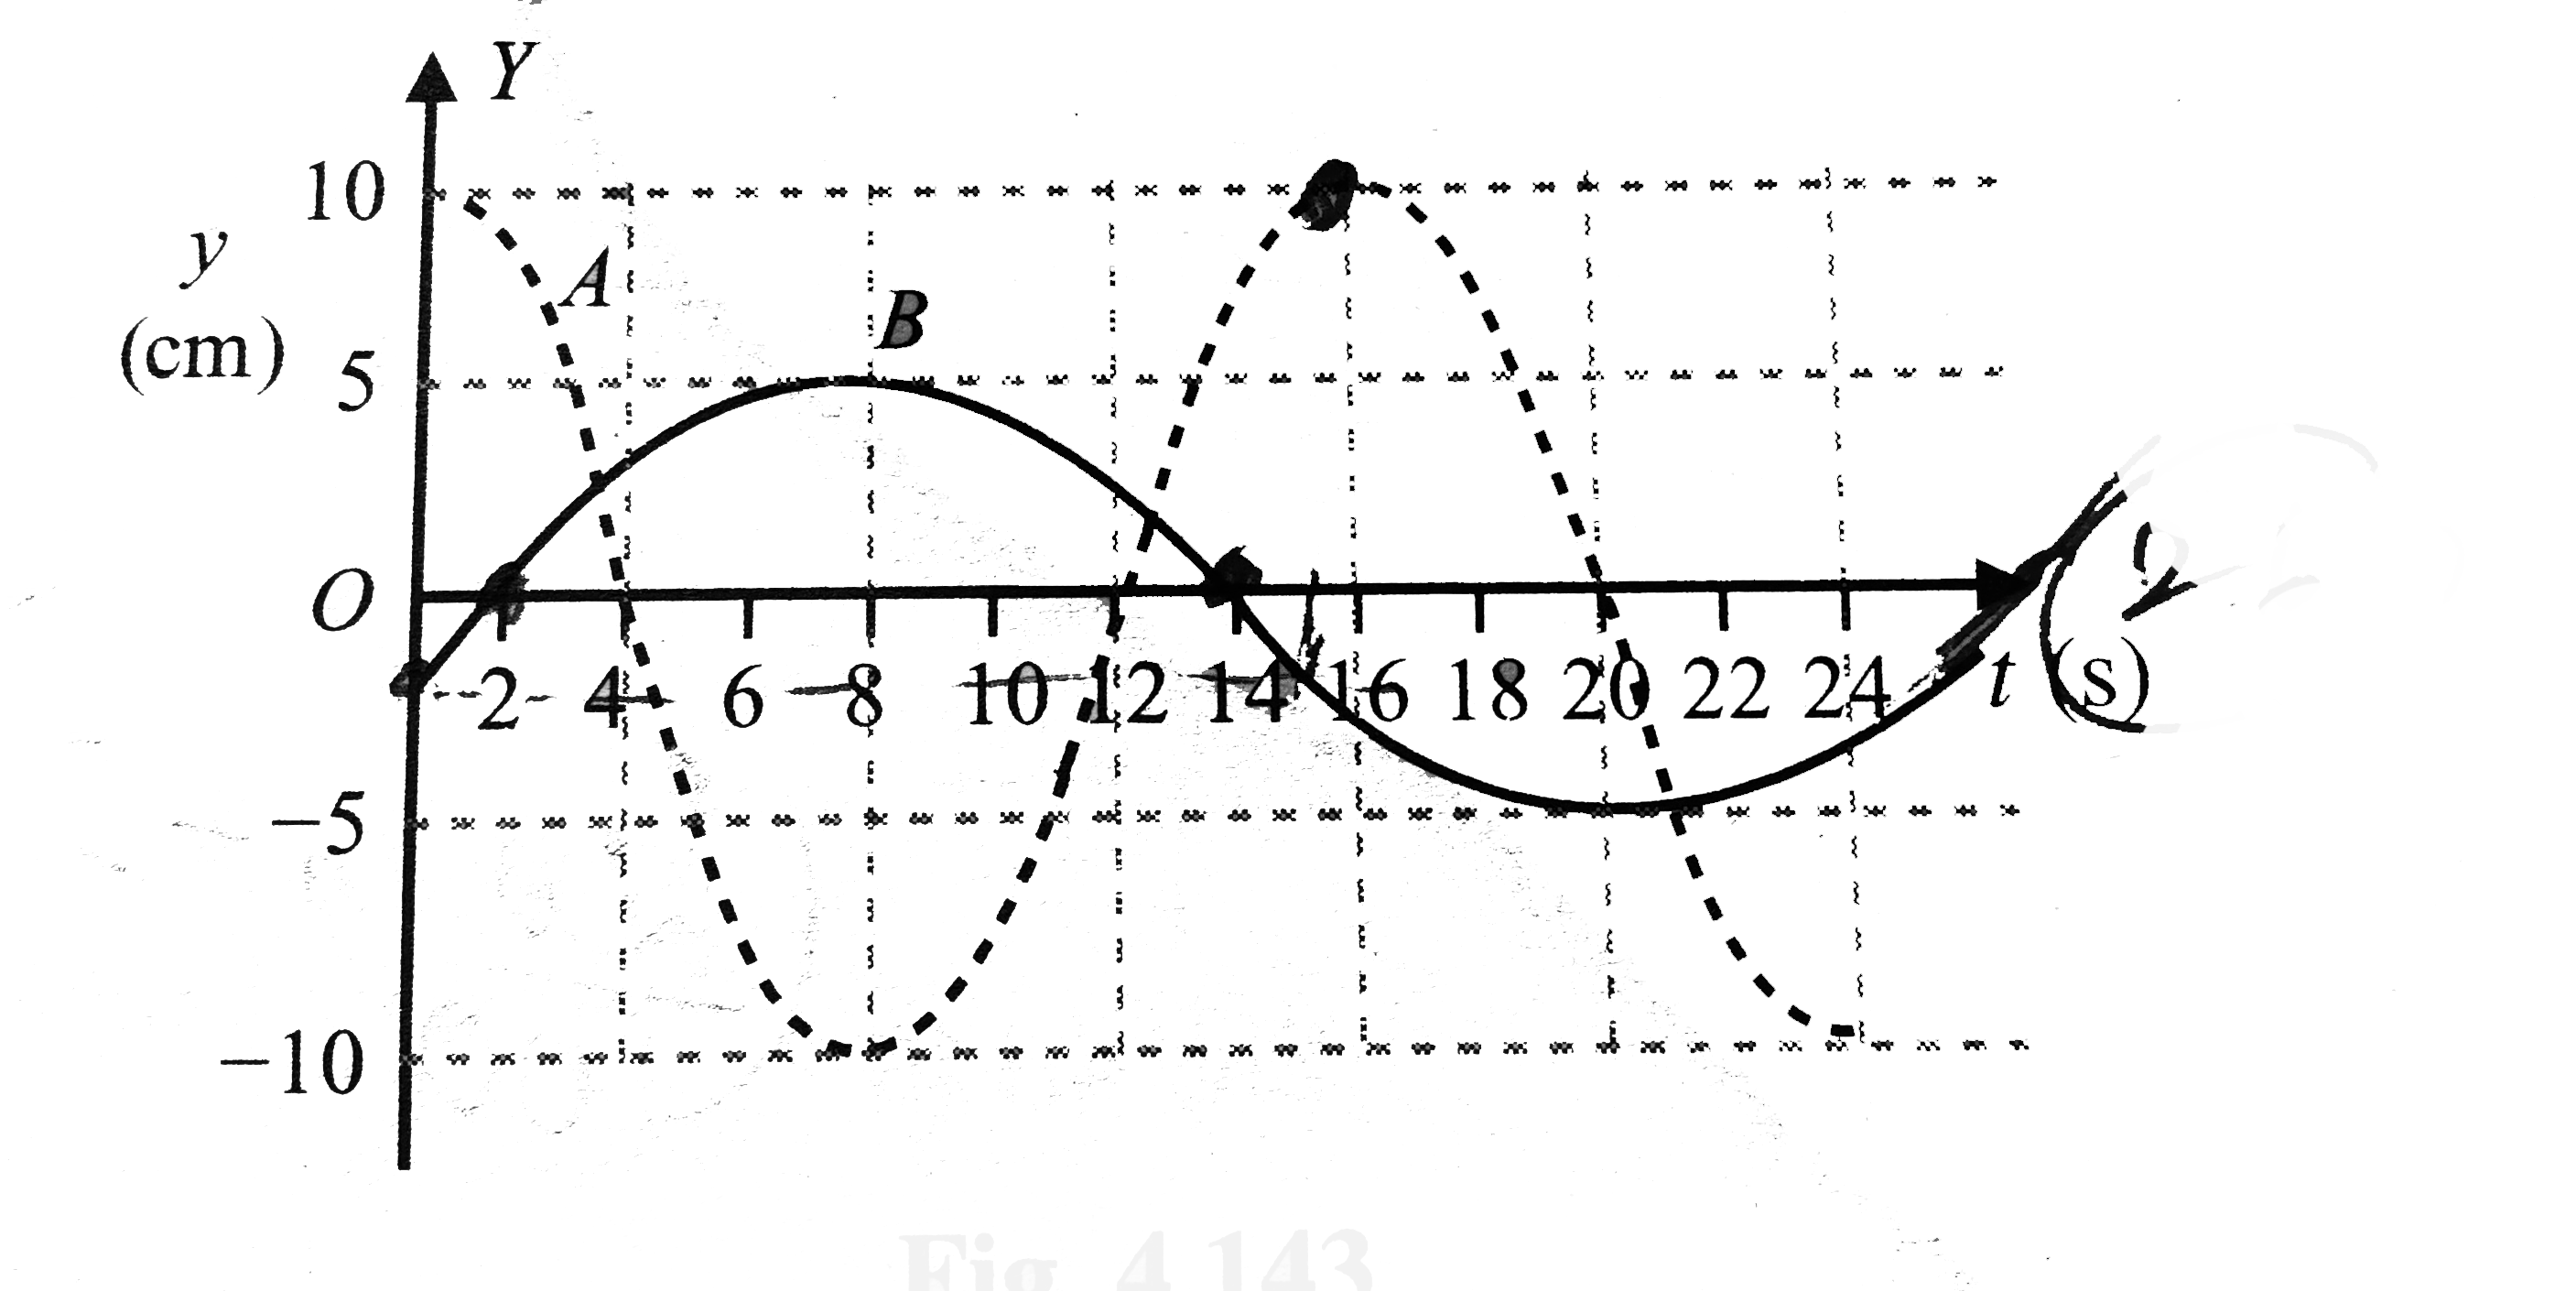
The following figure shows the displacement versus time graph for two particles A and B executing simple harmonic motions. The ratio of their maximum velocities isA3:1B1:3C1:9D9:1Which of the following graphs represents the displacement (s) -time (t) graph for uniform motion ?
A B
B C
C D
D
In the following speed-time graph (Fig. 2.10), the shaded portion gives
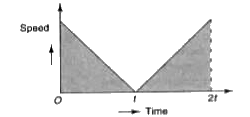 Adistance travelledBaverage speedCaverage velocityDdisplacement travelled
Graphs(Displacement-time)
View SolutionA ball is thrown vertically upwards and its velocity v varies with time t as shown in the figure. Which of the graphs (1),(2),(3),(4) shows the correct vurve of displacement versus time ?
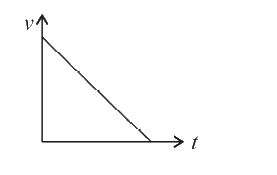
View SolutionThe following graph shows the displacement of the bob from its mean position versus time . The time period and the amplitude of the bob are :
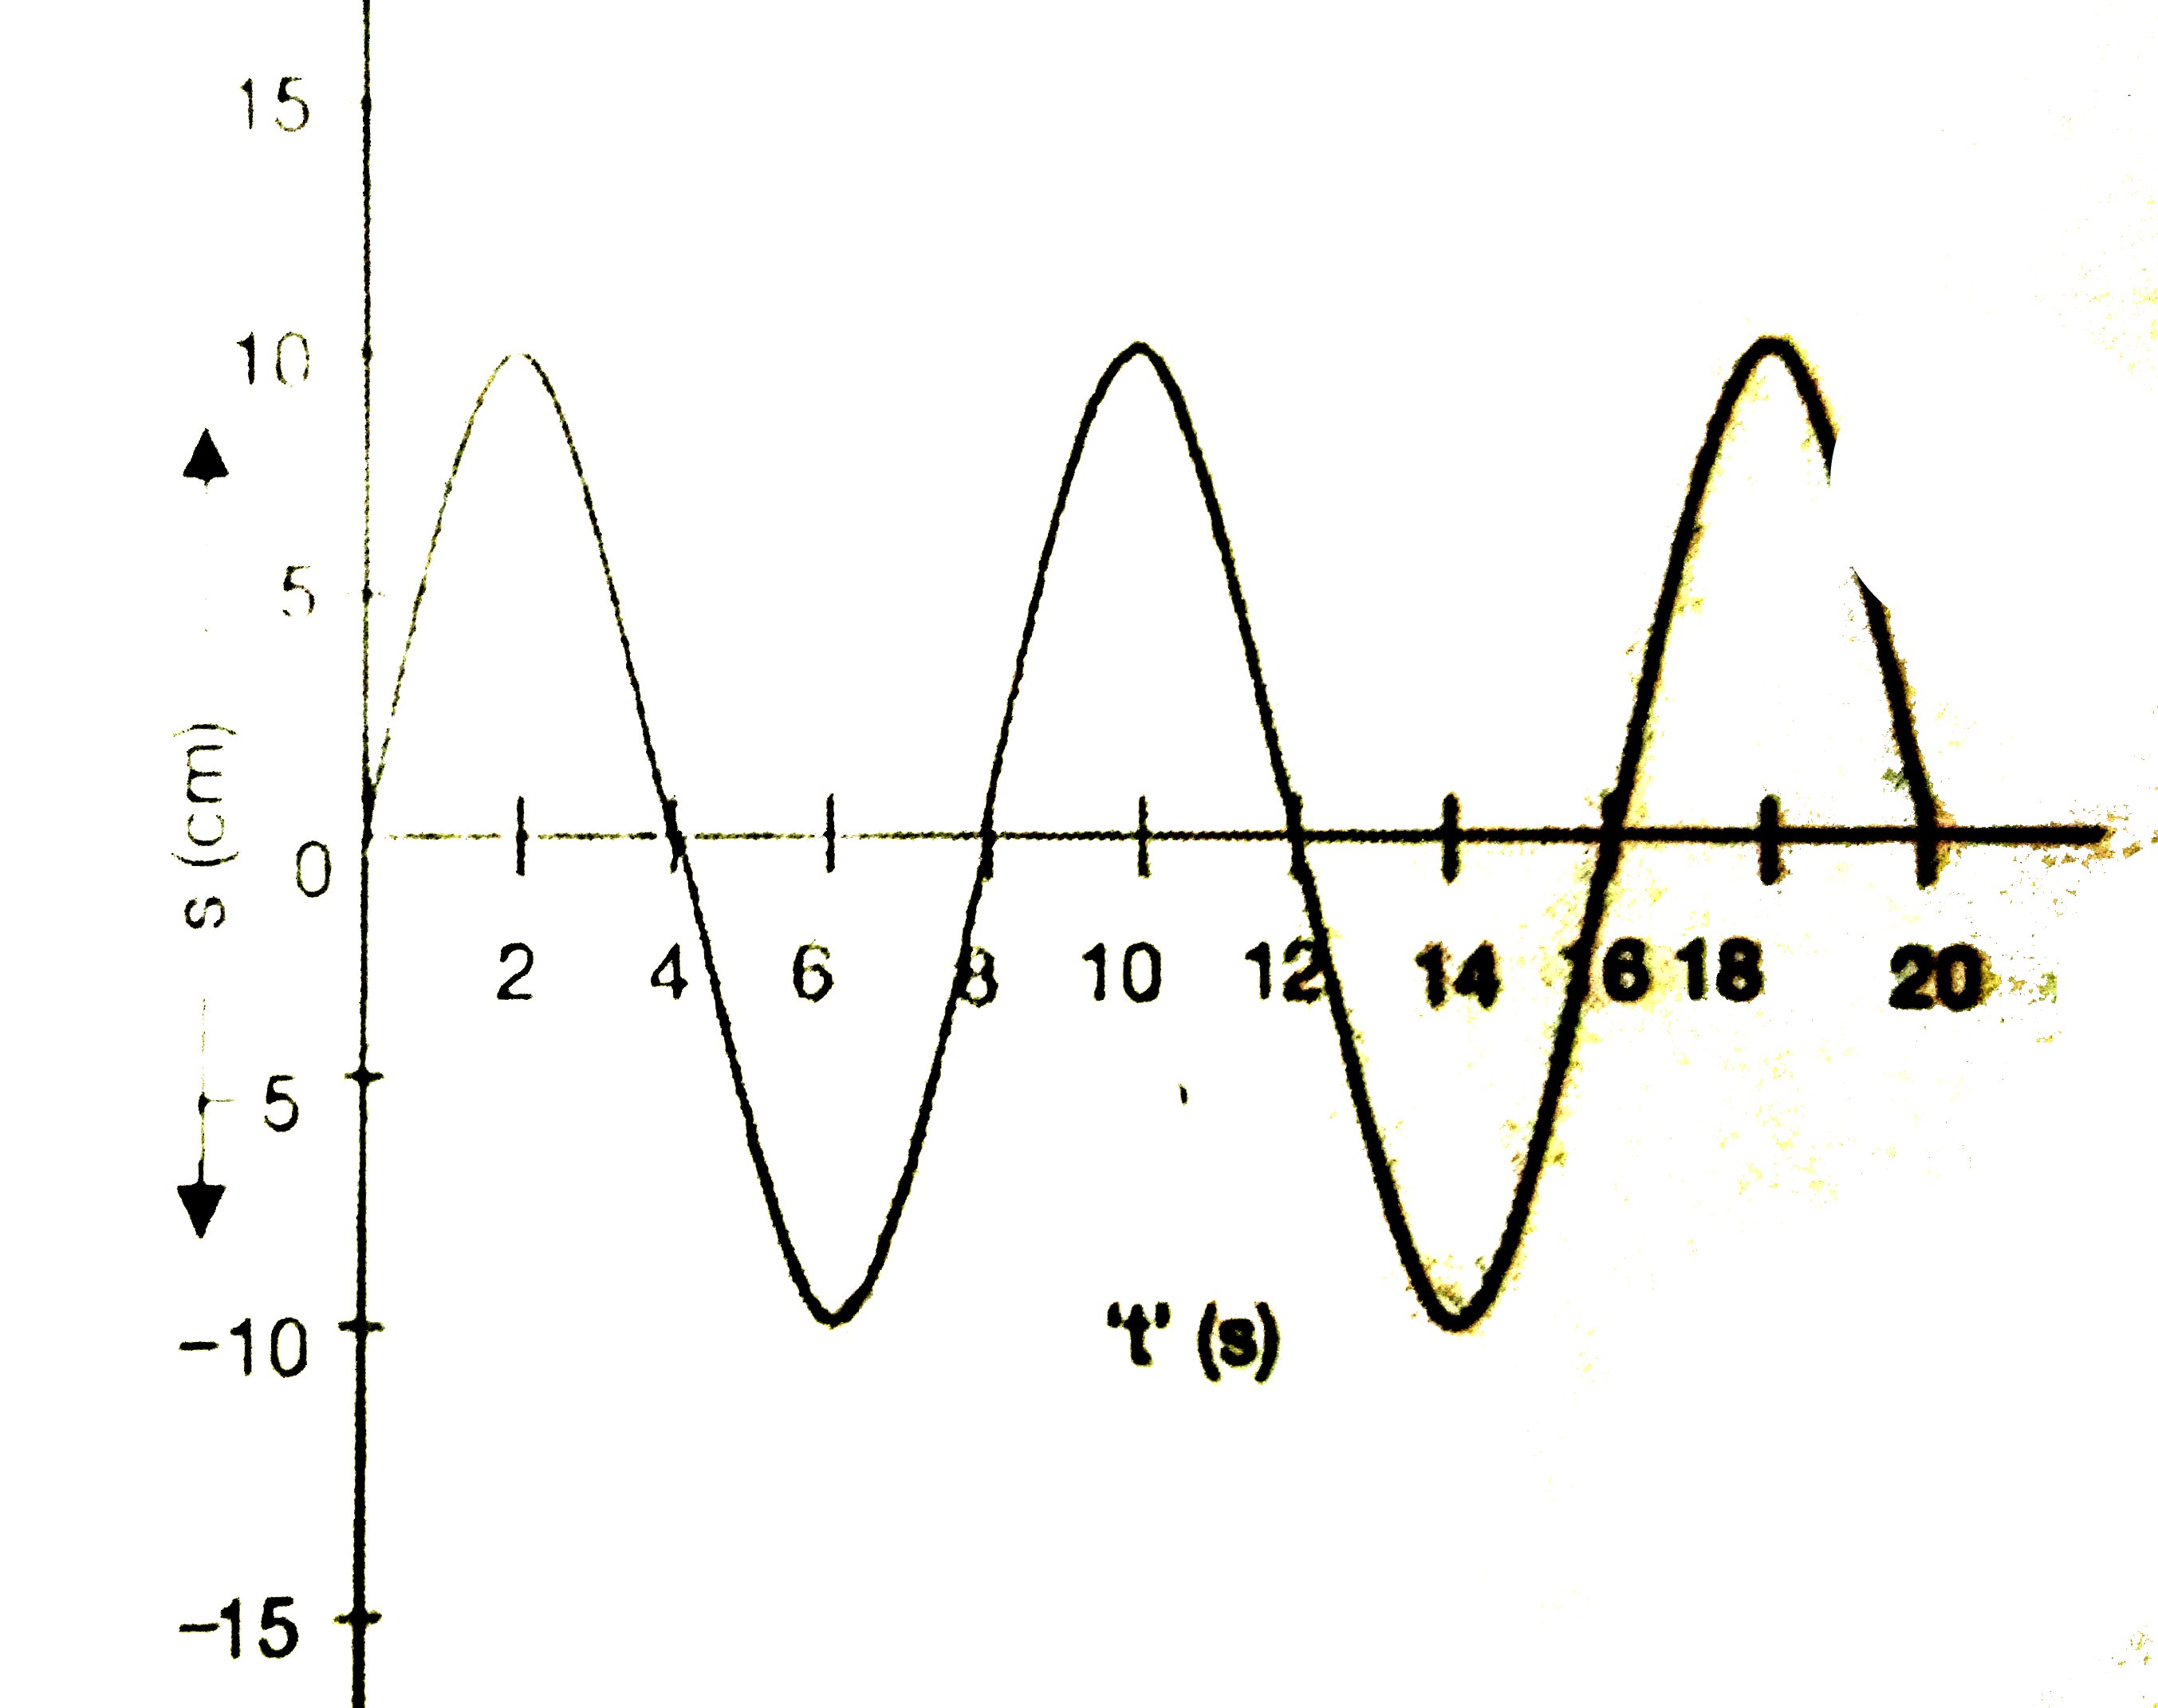
View SolutionA particle is moving in x−y plane with y=x2 and Vx=4−2t. The displacement versus time graph of the particle would be
View SolutionThe graph of displacement versus time is shown. Its corresponding velocity-time graph will be.
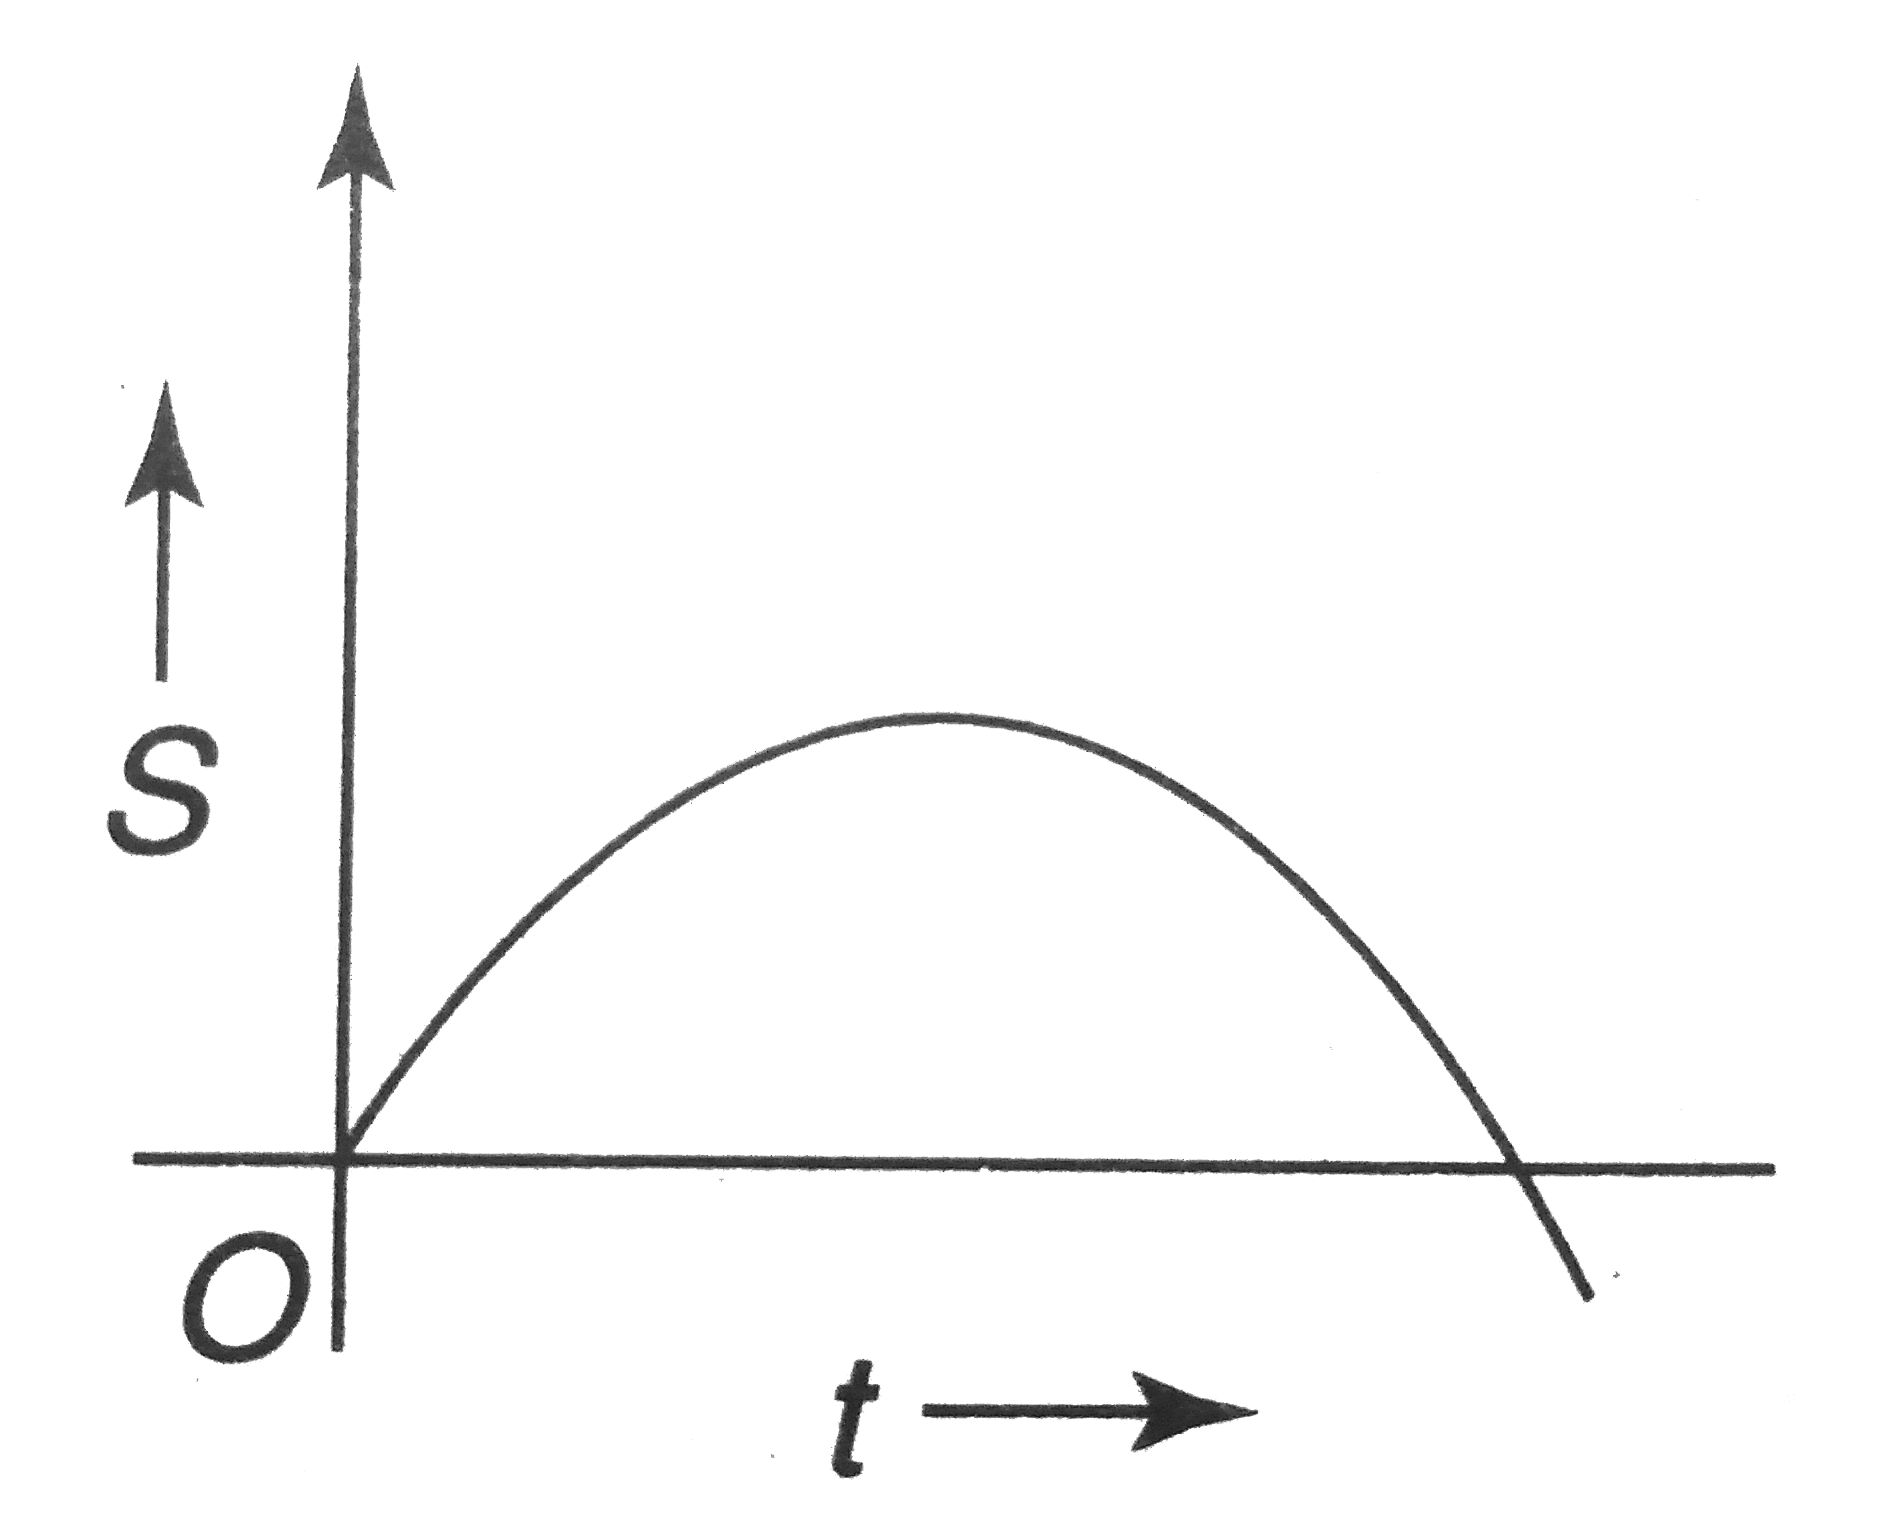
View Solution
