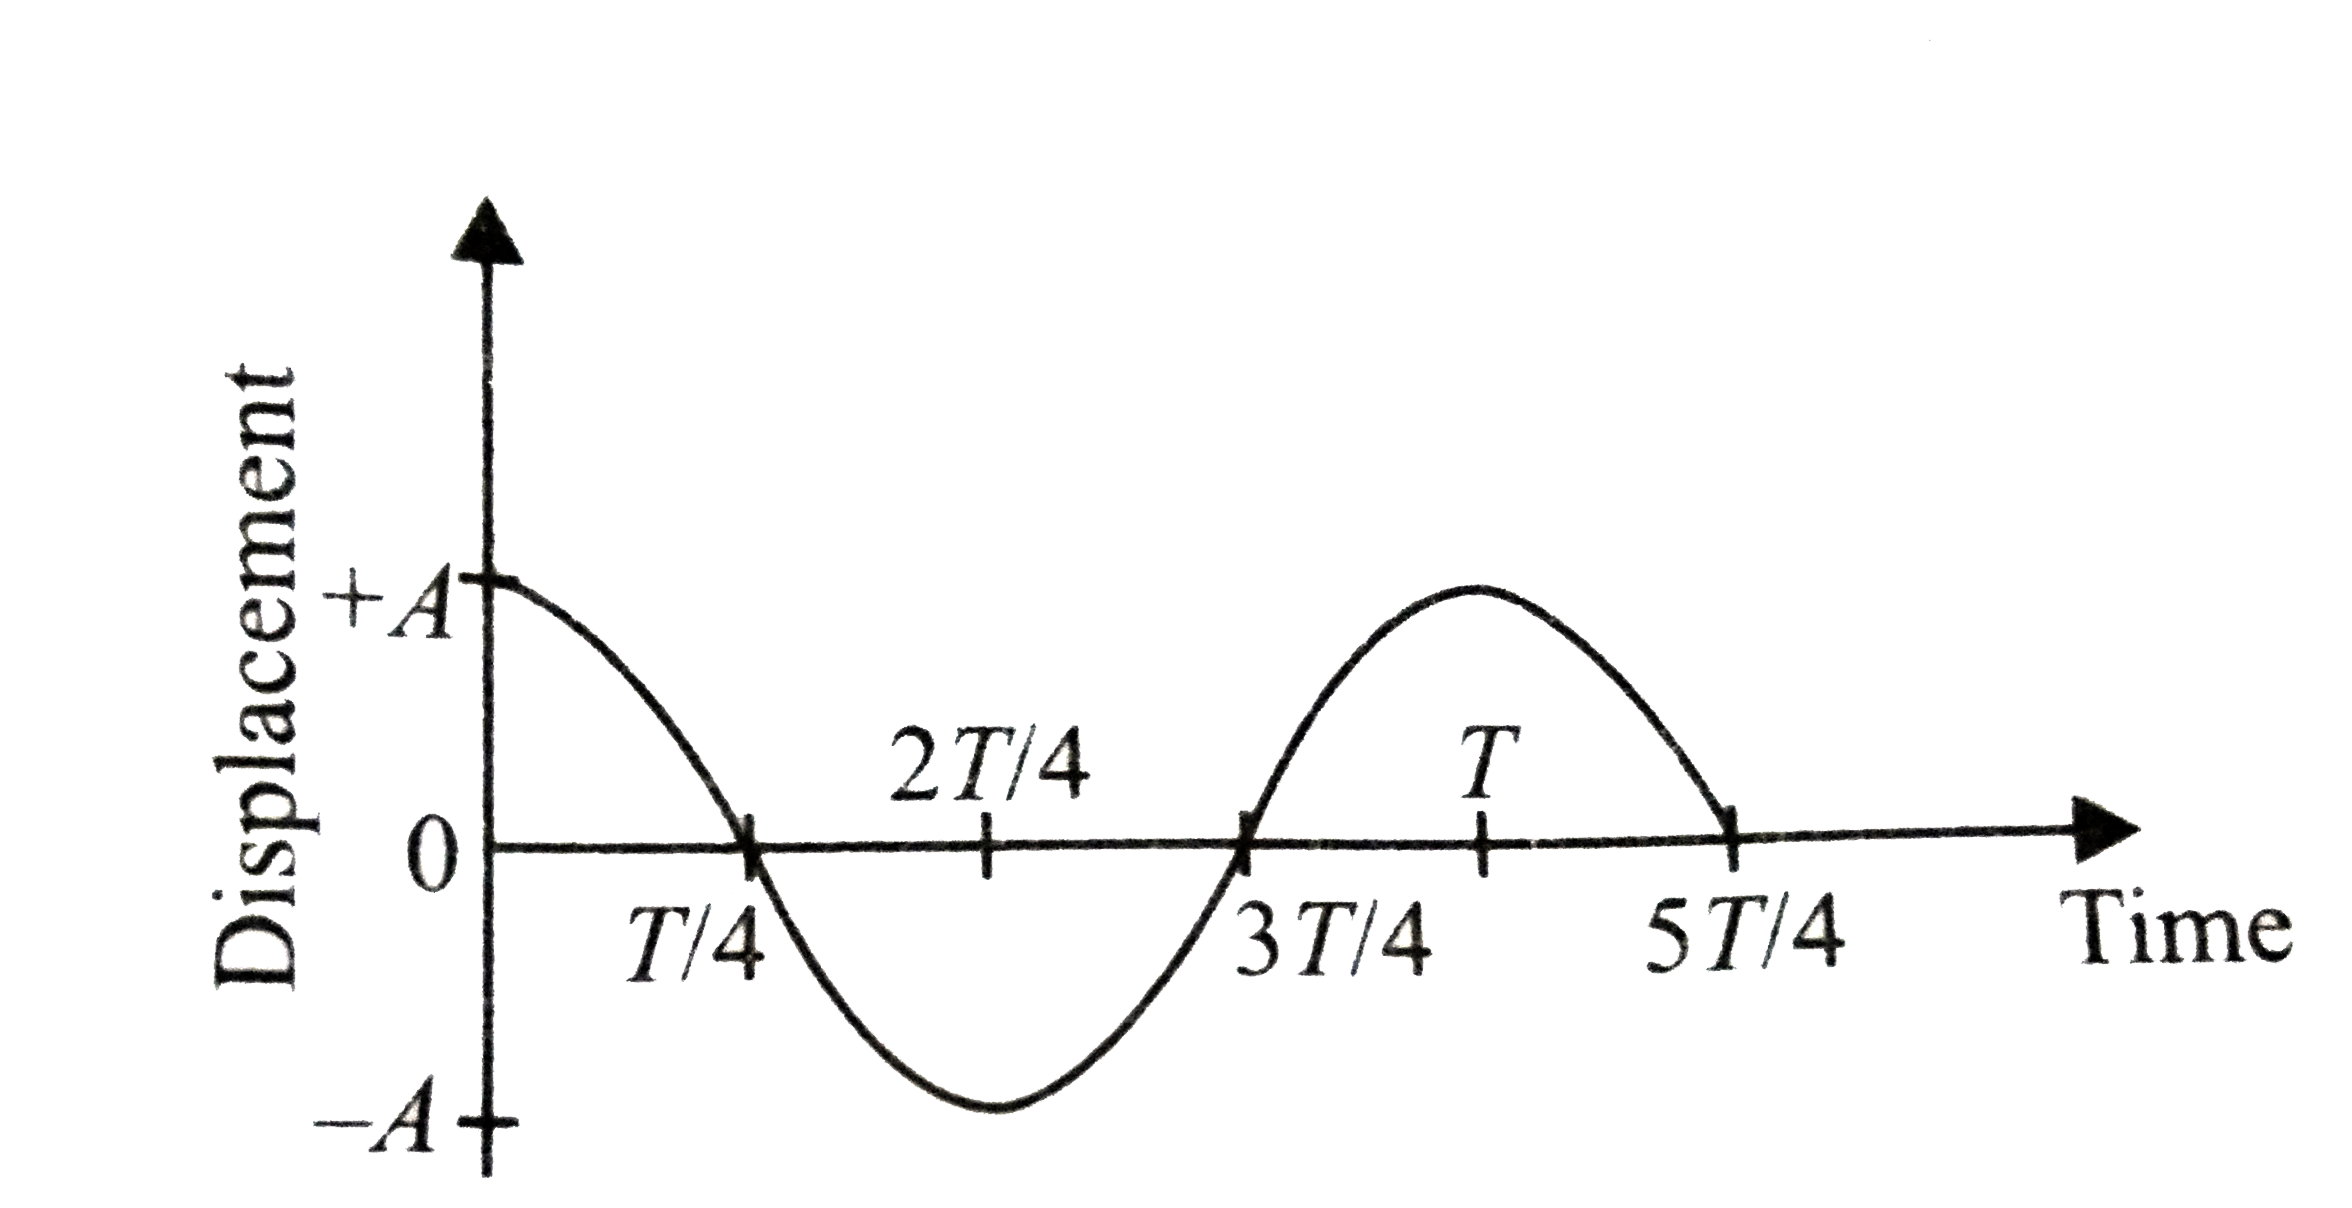
The displacement of a particle in S.H.M. is x=asinωt. Which of the following graph between displacement and time is correct :
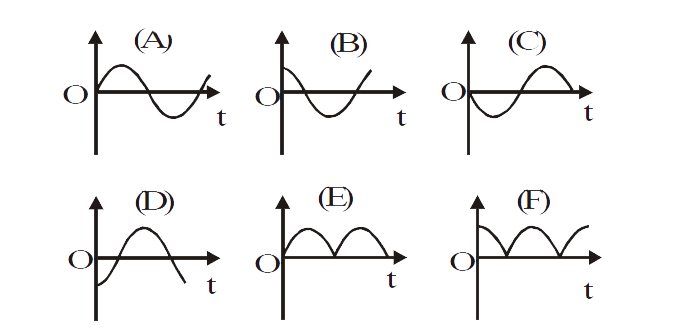
A
B
C
D
The correct Answer is:A
Step by step video & image solution for The displacement of a particle in S.H.M. is x = a sin omega t. Which of the following graph between displacement and time is correct : by Physics experts to help you in doubts & scoring excellent marks in Class 12 exams.
Updated on:21/07/2023Topper's Solved these Questions
- SIMPLE HARMONIC MOTIONBOOK - MOTIONCHAPTER - SIMPLE HARMONIC MOTIONEXERCISE - EXERCISE -3 Section - A Previous Year Problems | NEET
24 Videos
- SIMPLE HARMONIC MOTIONBOOK - MOTIONCHAPTER - SIMPLE HARMONIC MOTIONEXERCISE - EXERCISE -3 Section - B Previous Year Problems | JEE MAIN
23 Videos
- SIMPLE HARMONIC MOTIONBOOK - MOTIONCHAPTER - SIMPLE HARMONIC MOTIONEXERCISE - EXERCISE -1 (Objective Problems | NEET) SECTION-E Simple Pendulum
6 Videos
- SEMI CONDUCTOR AND LOGIC GATESBOOK - MOTIONCHAPTER - SEMI CONDUCTOR AND LOGIC GATESEXERCISE - EXERCISE 3
34 Videos
- SIMPLE HARONIC MOTION BOOK - MOTIONCHAPTER - SIMPLE HARONIC MOTION EXERCISE - EXERCISE -4 (Leve-II) [ JEE 2011]
11 Videos
Similar Questions
Knowledge Check
The displacement of a particle in S.H.M. in one time period is
AAB2AC4ADZeroThe displacement time graph of a particle executing S.H.M. is shown in figure. Which of the following statement is / are true ?
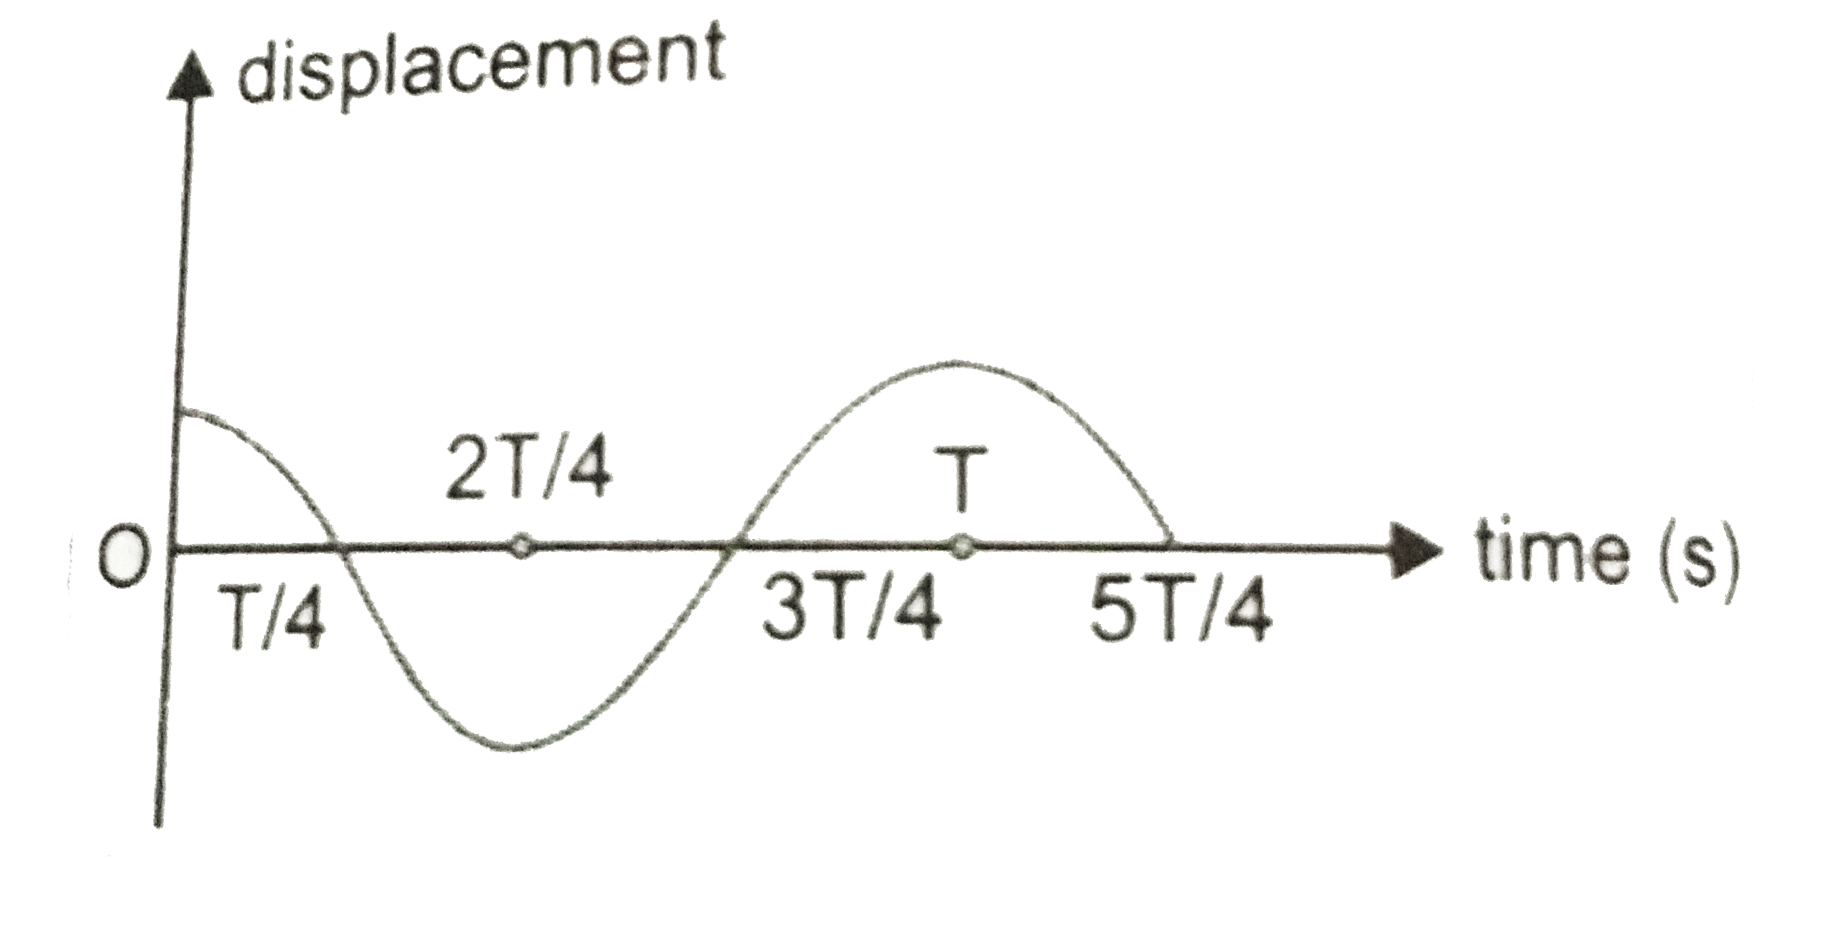 AThe force is zero at t=3T4BThe acceleration is maximum at t=4T4CThe velocity is maximum at t=T4DThe P.E. is equal to K.E. of oscillation at t=T2
The displacement of a particle executing S.H.M. is x = 5 sin (20πt). Then its frequency will be
A20π HzB20 HzC10 HzD10π Hz
Which of the following graphs represents the displacement (s) -time (t) graph for uniform motion ?
View SolutionThe displacement of a particle in S.H.M. is given by x=sinωt+√3cosωtm. Then at t = 0 its displacement in metres is
View SolutionThe graph in the figure shows how the displacement of a particle describing S.H.M. varies with time. Which one of the following statements is not true ?
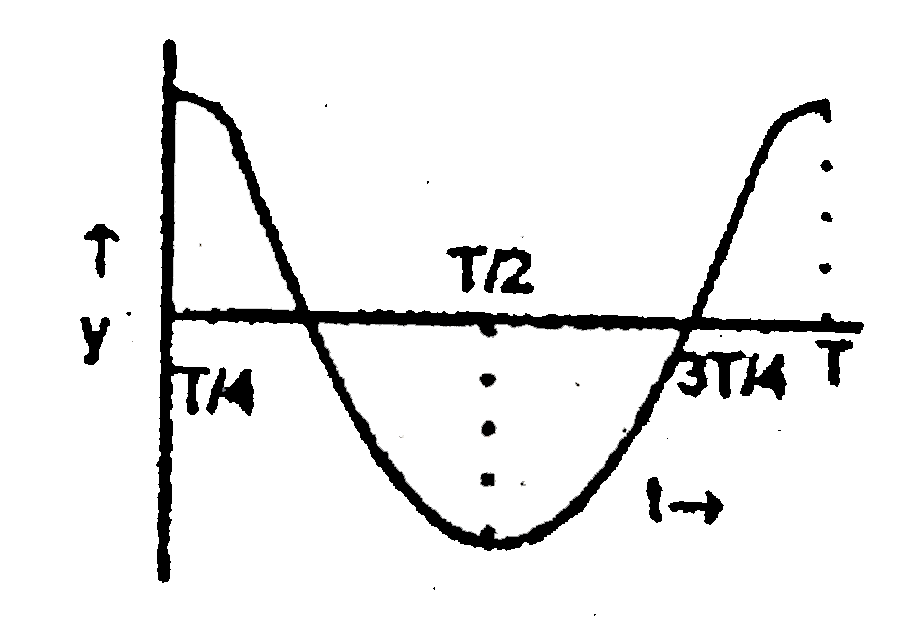
View SolutionThe graph in the figure shows how the displacement of a particle describing S.H.M varies with time. Which one of the following statements is not true ?
View SolutionThe displacement of a particle performing S.H.M. is given by x=10sin(ωt+α) metre. If the displacement of the particle is 5m, then the phase of S.H.M. is
View Solution

