In the following table relation of graph in column-I and shape of graph in column-II is shown match them appropriately.
 .Solution in Gujrati
⇒A−i,B−iii,C−ii
Topper's Solved these Questions
- BOOK - KUMAR PRAKASHANCHAPTER - OSCILLATIONSEXERCISE - SECTION-C (OBJECTIVE QUESTIONS ASSERTION OR REASION)7videos
OSCILLATIONS
- BOOK - KUMAR PRAKASHANCHAPTER - OSCILLATIONSEXERCISE - SECTION-D (NCERT EXEMPLAR SOLUTION MCQs)10videos
OSCILLATIONS
- BOOK - KUMAR PRAKASHANCHAPTER - OSCILLATIONSEXERCISE - SECTION-C (OBJECTIVE QUESTIONS FILL IN THE BLANK)7videos
OSCILLATIONS
- BOOK - KUMAR PRAKASHANCHAPTER - OBJECTIVE QUESTIONS AS PER NEW PAPER STYLE EXERCISE - CHAPTER - 8 (Match Type questions)5videos
OBJECTIVE QUESTIONS AS PER NEW PAPER STYLE
- BOOK - KUMAR PRAKASHANCHAPTER - PHYSICAL WORLDEXERCISE - SECTION-E (QUESTIONS FROM MODULE)9videos
PHYSICAL WORLD
Similar Questions
Assertion : All oscillatory motions are necessarily periodic motion but all periodic motion are not oscillatory.
Reason : Simple pendulum is an example of oscillatory motion.View SolutionThe displacement of a particle represented by the equation y=3cos(π4−2ωt). The motion of the particle is
View SolutionThe ratio of displacement at any position and………….remains constant for a particle executed SHM.
View SolutionType of satellites are given in Column-I and their uses are given in Column-II. Match them properly :
Column-IColumn-II(1) Polar satellite(a) Tele communication(2) Geo-stationary satellite(b) Investigation(c) For information about atmosphere07:18View Solution.…. state of substance at very high temperature has generated hope of energy source for mankind.
12:54View SolutionIn column-I some situations have been described and in column-II corresponding graph is given. Match the entries in column-I with appropriate entries in column-II.
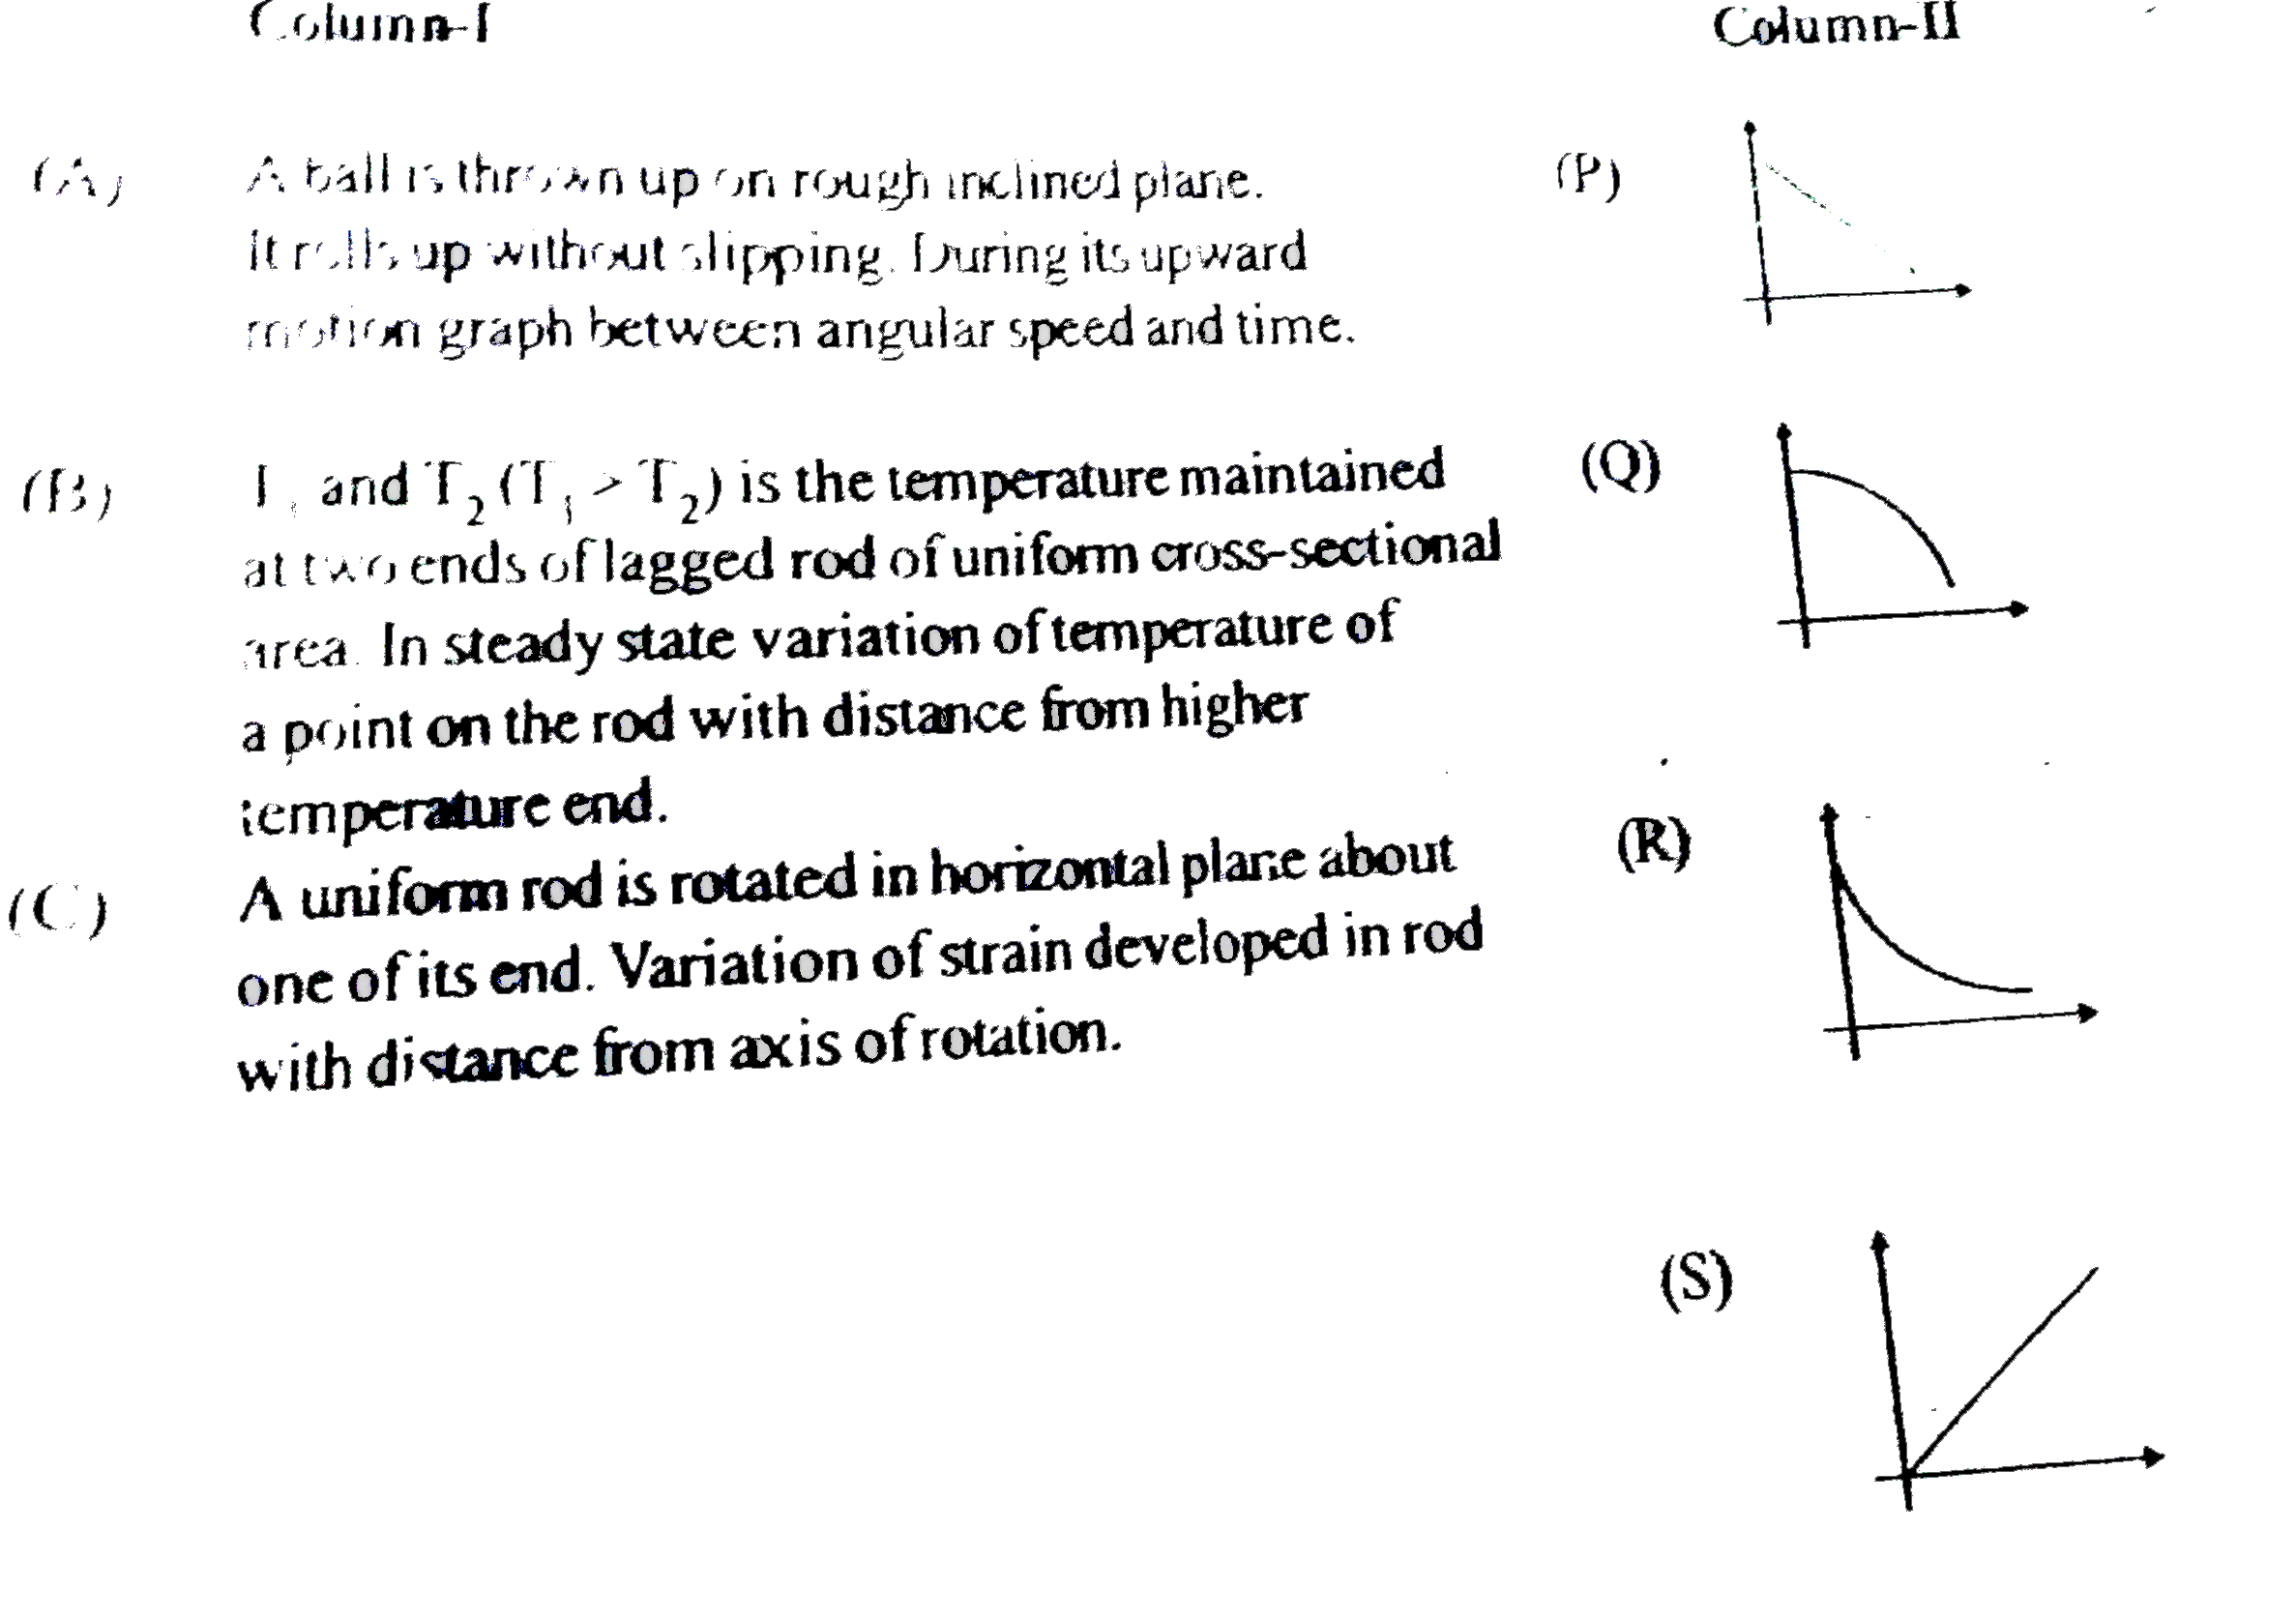 04:17View Solution
Column I gives a list of possible set of parameters measured in some expreriments. The variations of the parameers in the form of graphs are shown in Column II. Match the set of parameters given in Column I with the graphs given in Column II.
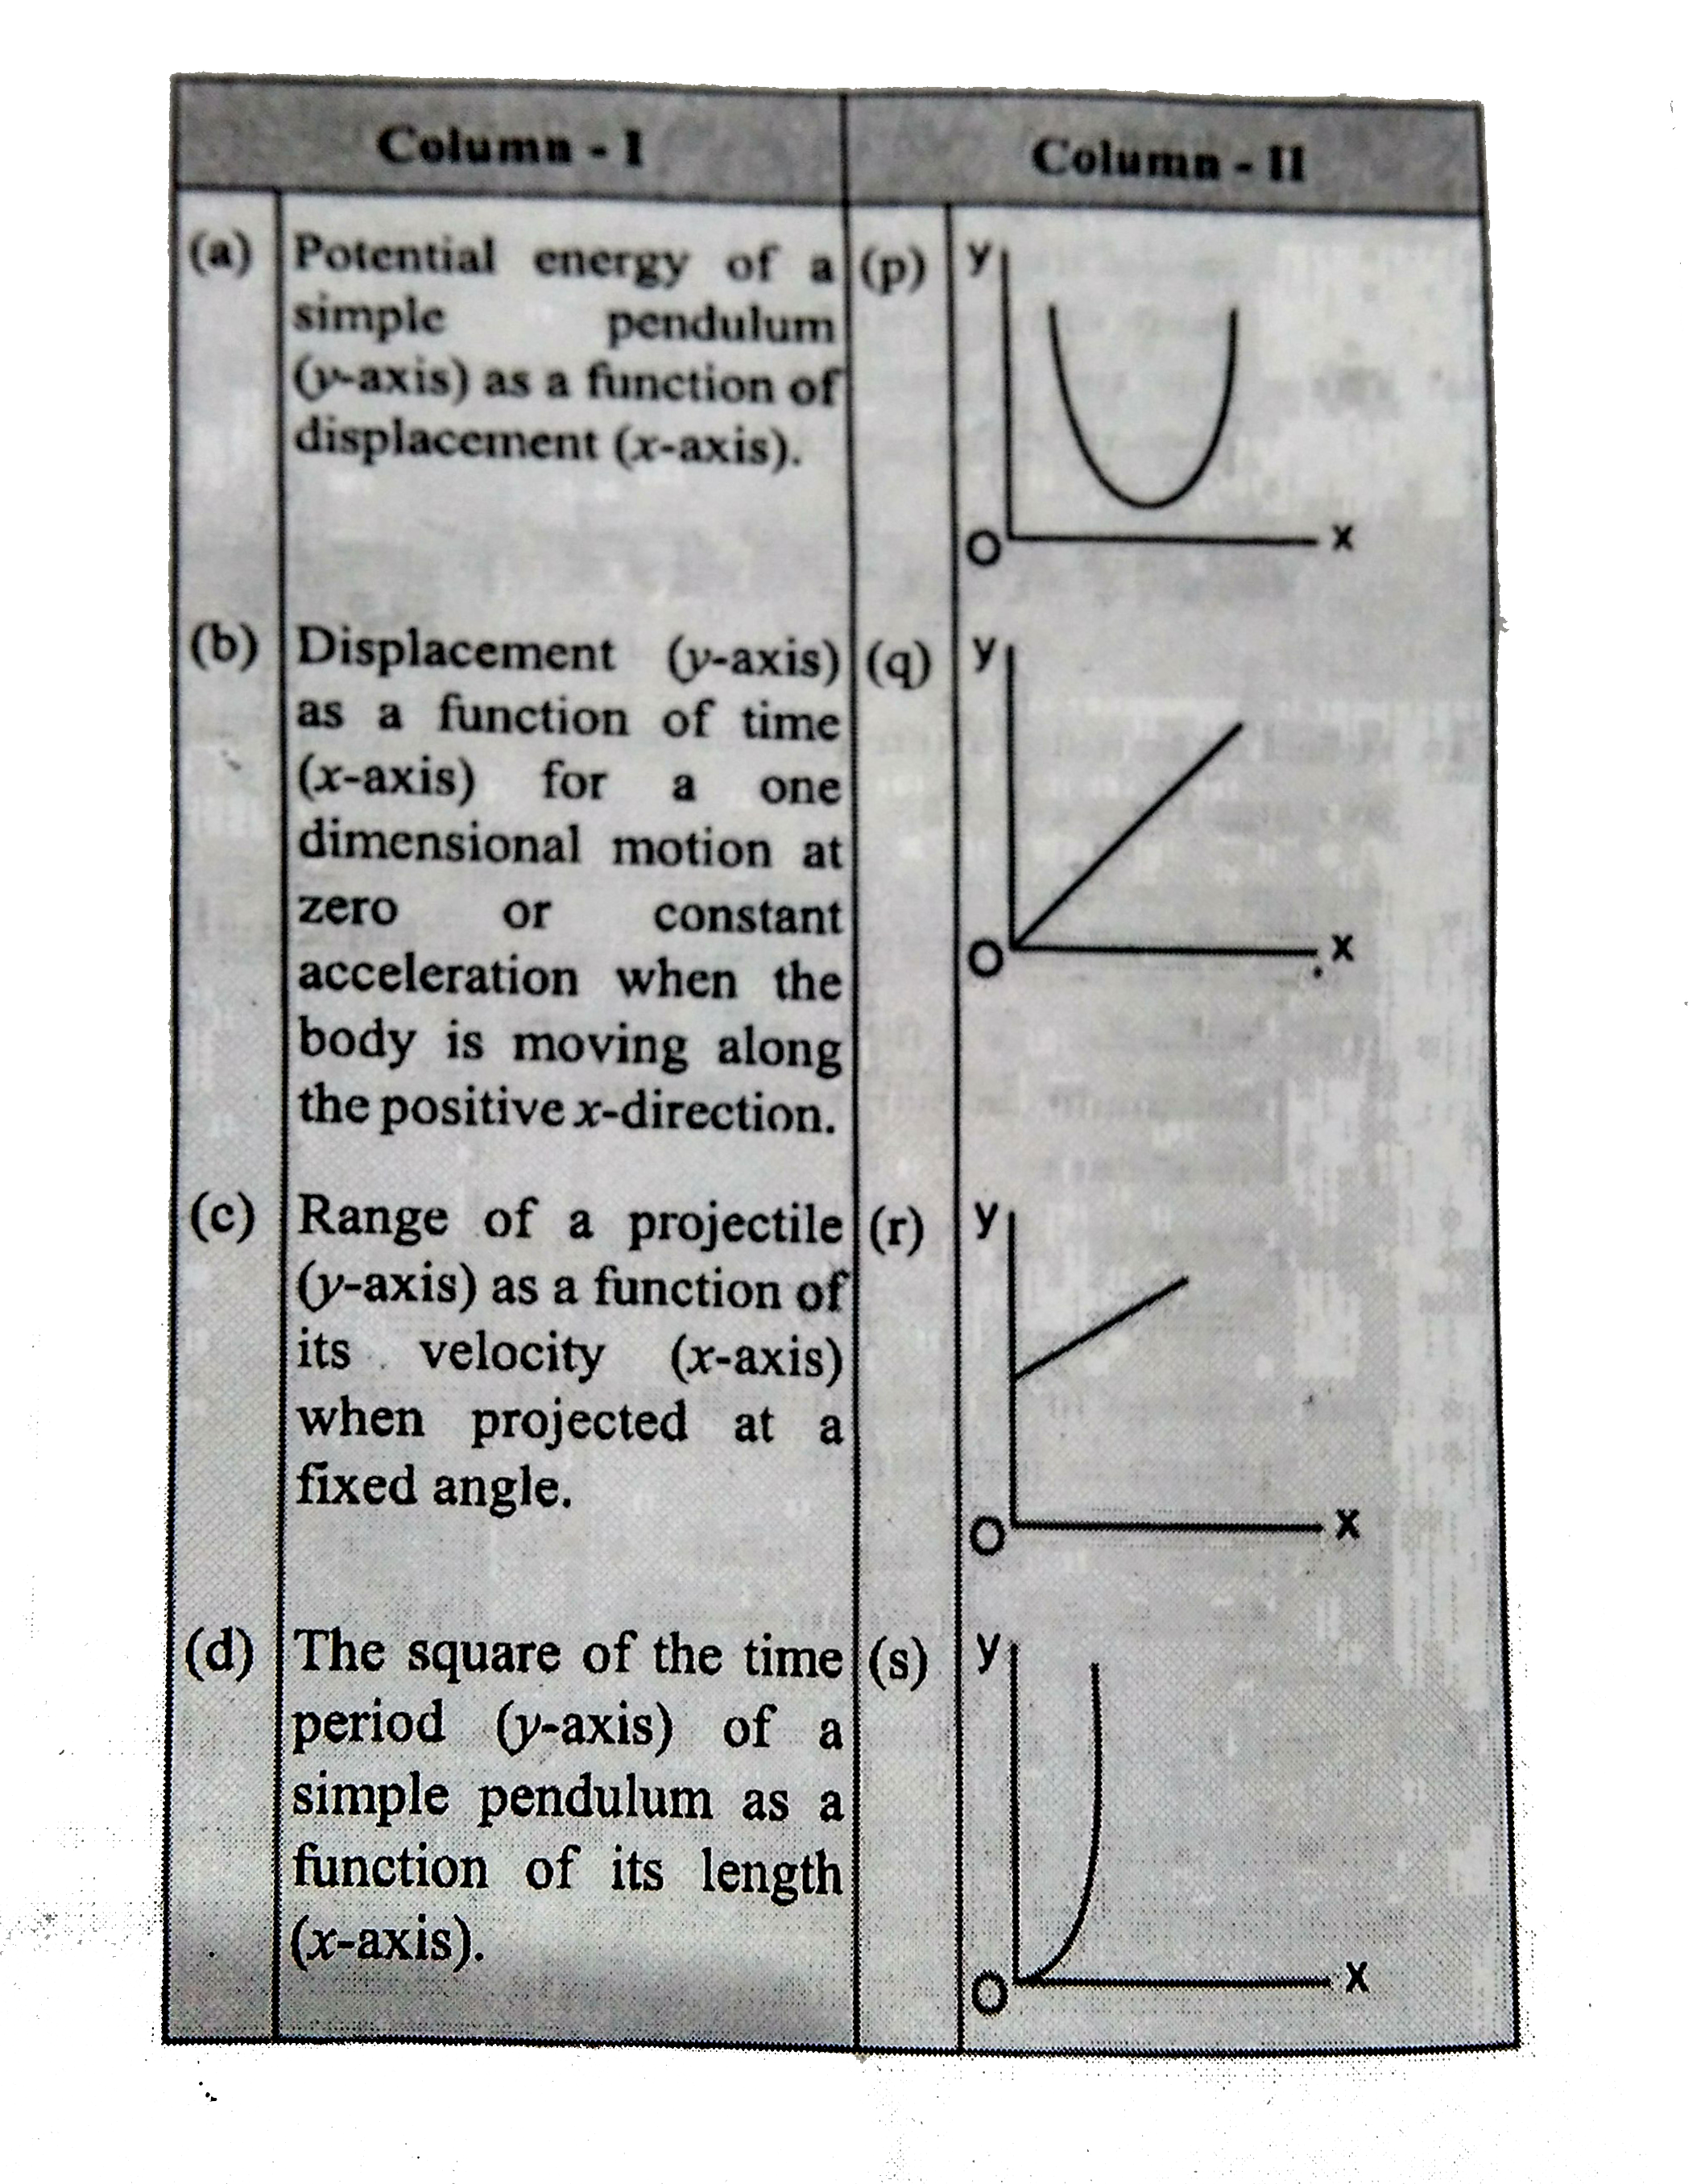 05:06View Solution
Match the graph of y = f(x) in Column I with the corresponding graph of y = f'(x) in Column II.
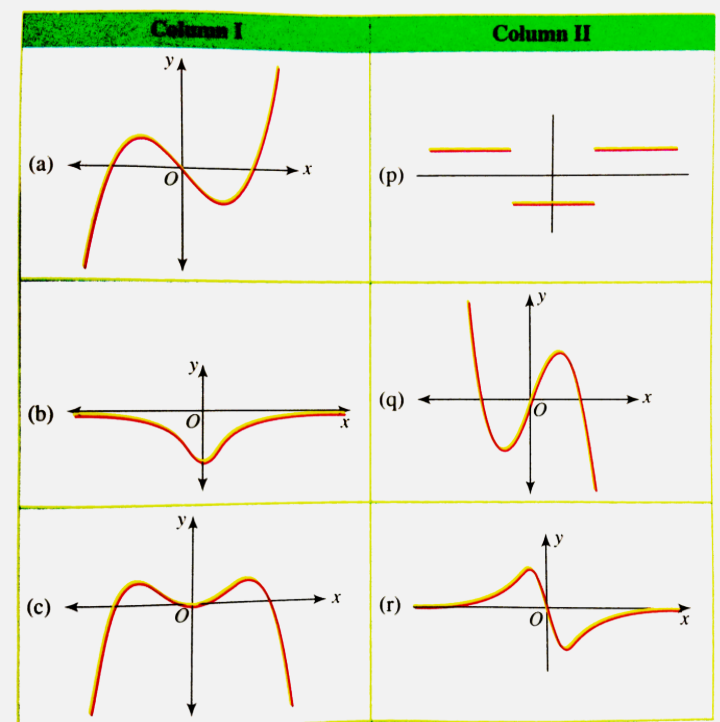
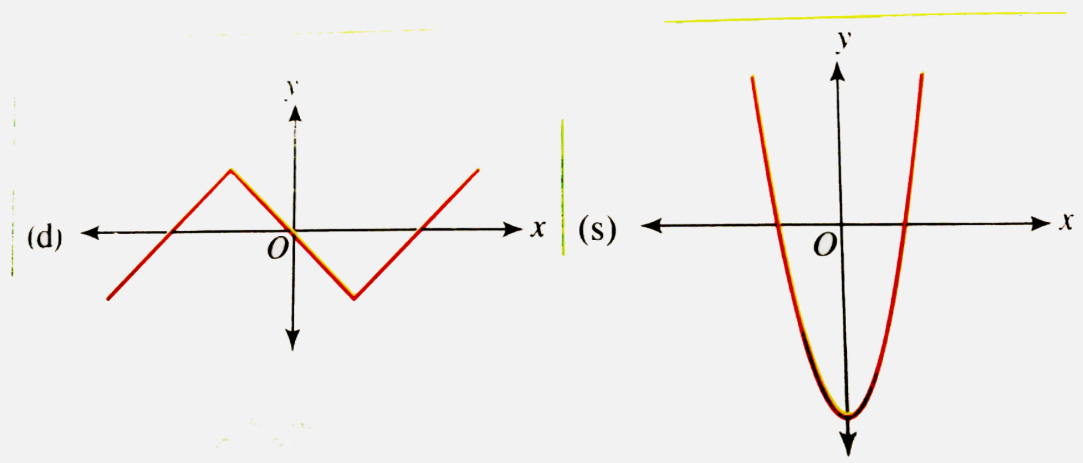 08:20View Solution
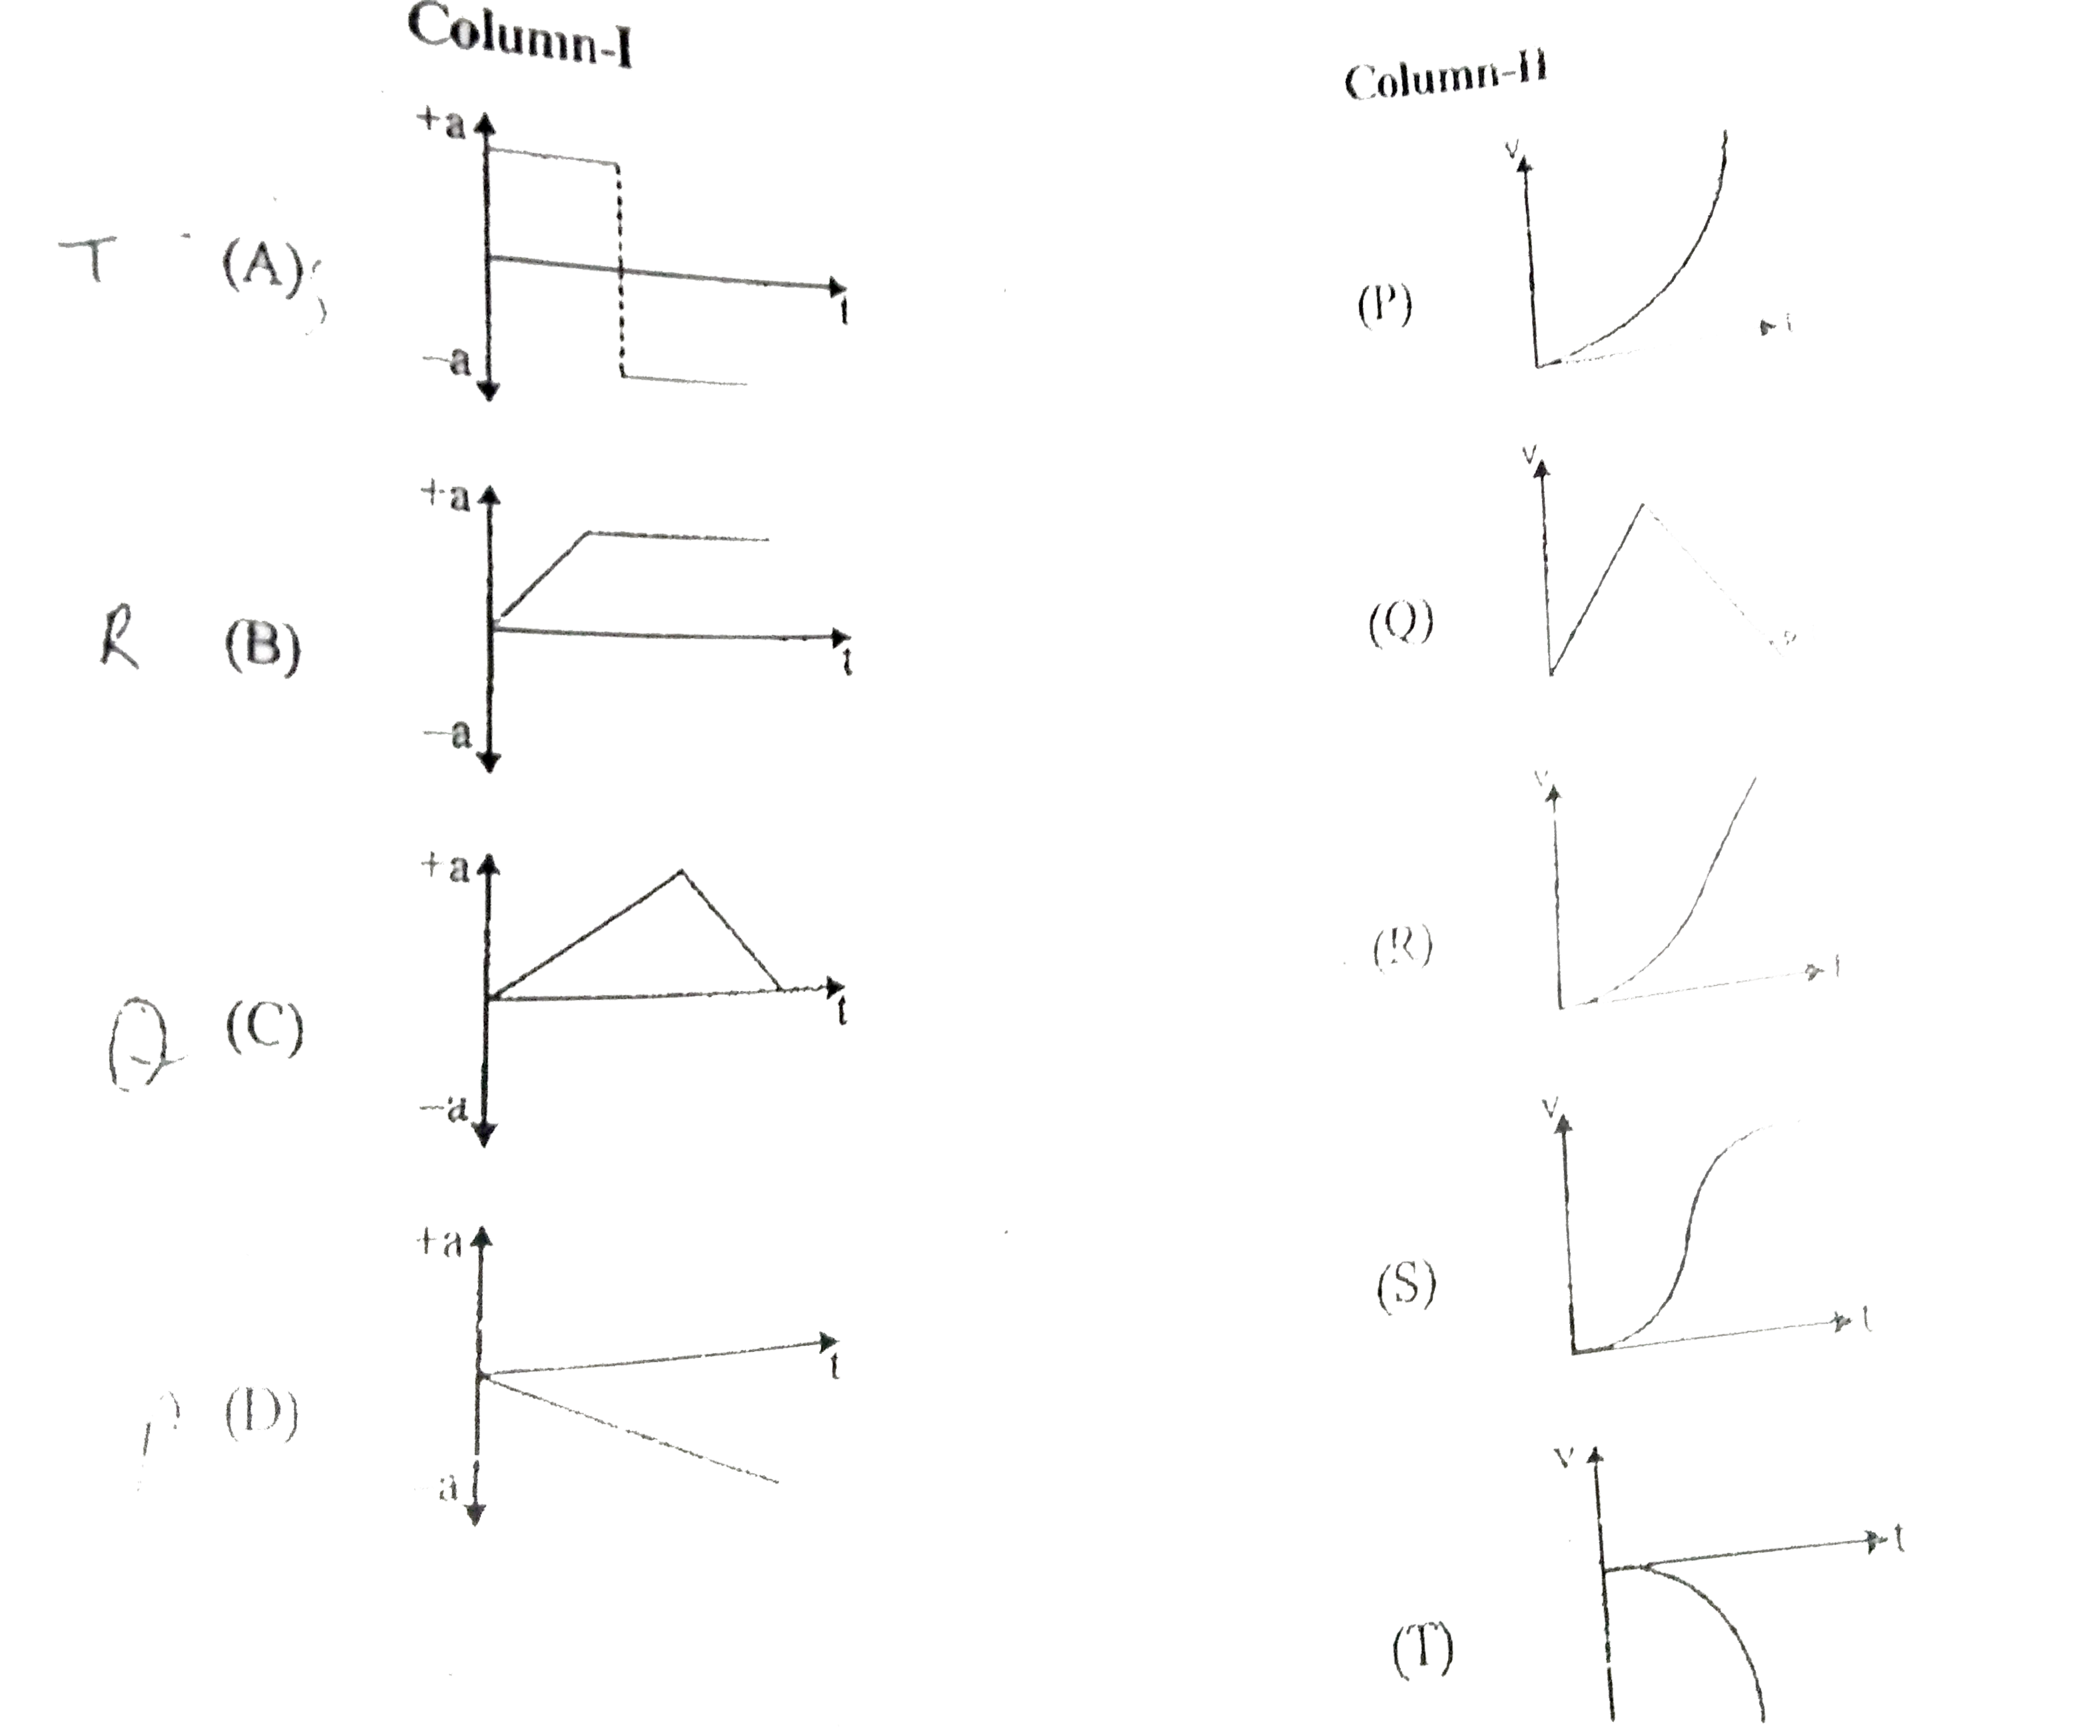
Column-I shows a-t graph and column-II shows v-t graph. Mathc the column-I and column-II.
 01:29View Solution
Column I gives a listof possible set of parameters measured in some experiments. The variations of the parameters in the form of graphs are shown in Column II. Match the set of parameters given in Column I with the graphs even in Column II. Indicate your answer by darkening the appropriate bubbles of the 4 xx 4 matrix given in the ORS.
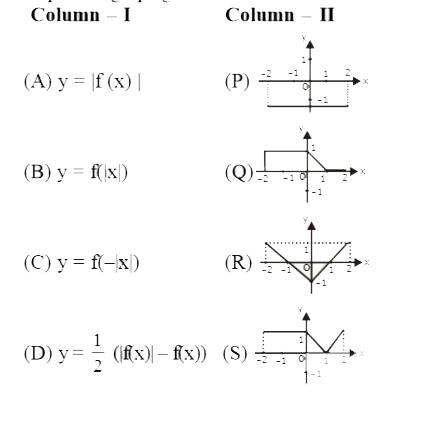
01:36View SolutionThe graph of the function y = f(x) is as follows.
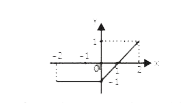
Match the function mentioned in Column-I with the respective graph given in Column-II.
 03:07View Solution
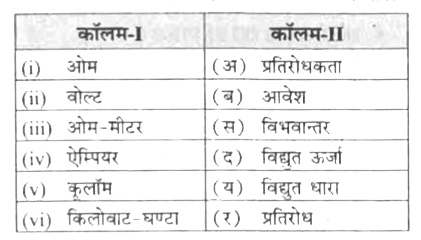
कॉलम I को कॉलम II से उपयुक्त सुमेलन करें।
 01:19View Solution
Match the molecule in Column I with the shape in Column II
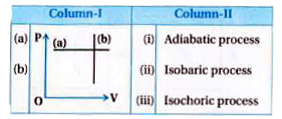
01:12View SolutionIn Column-I a graph and in Column-II processes are given. Match them appropriately:
 02:22View Solution
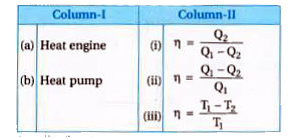
In Column-I devices and in Column-II efficiency are given. Match them appropriately:
 02:21View Solution

