Column I gives a list of possible set of parameters measured in some expreriments. The variations of the parameers in the form of graphs are shown in Column II. Match the set of parameters given in Column I with the graphs given in Column II.
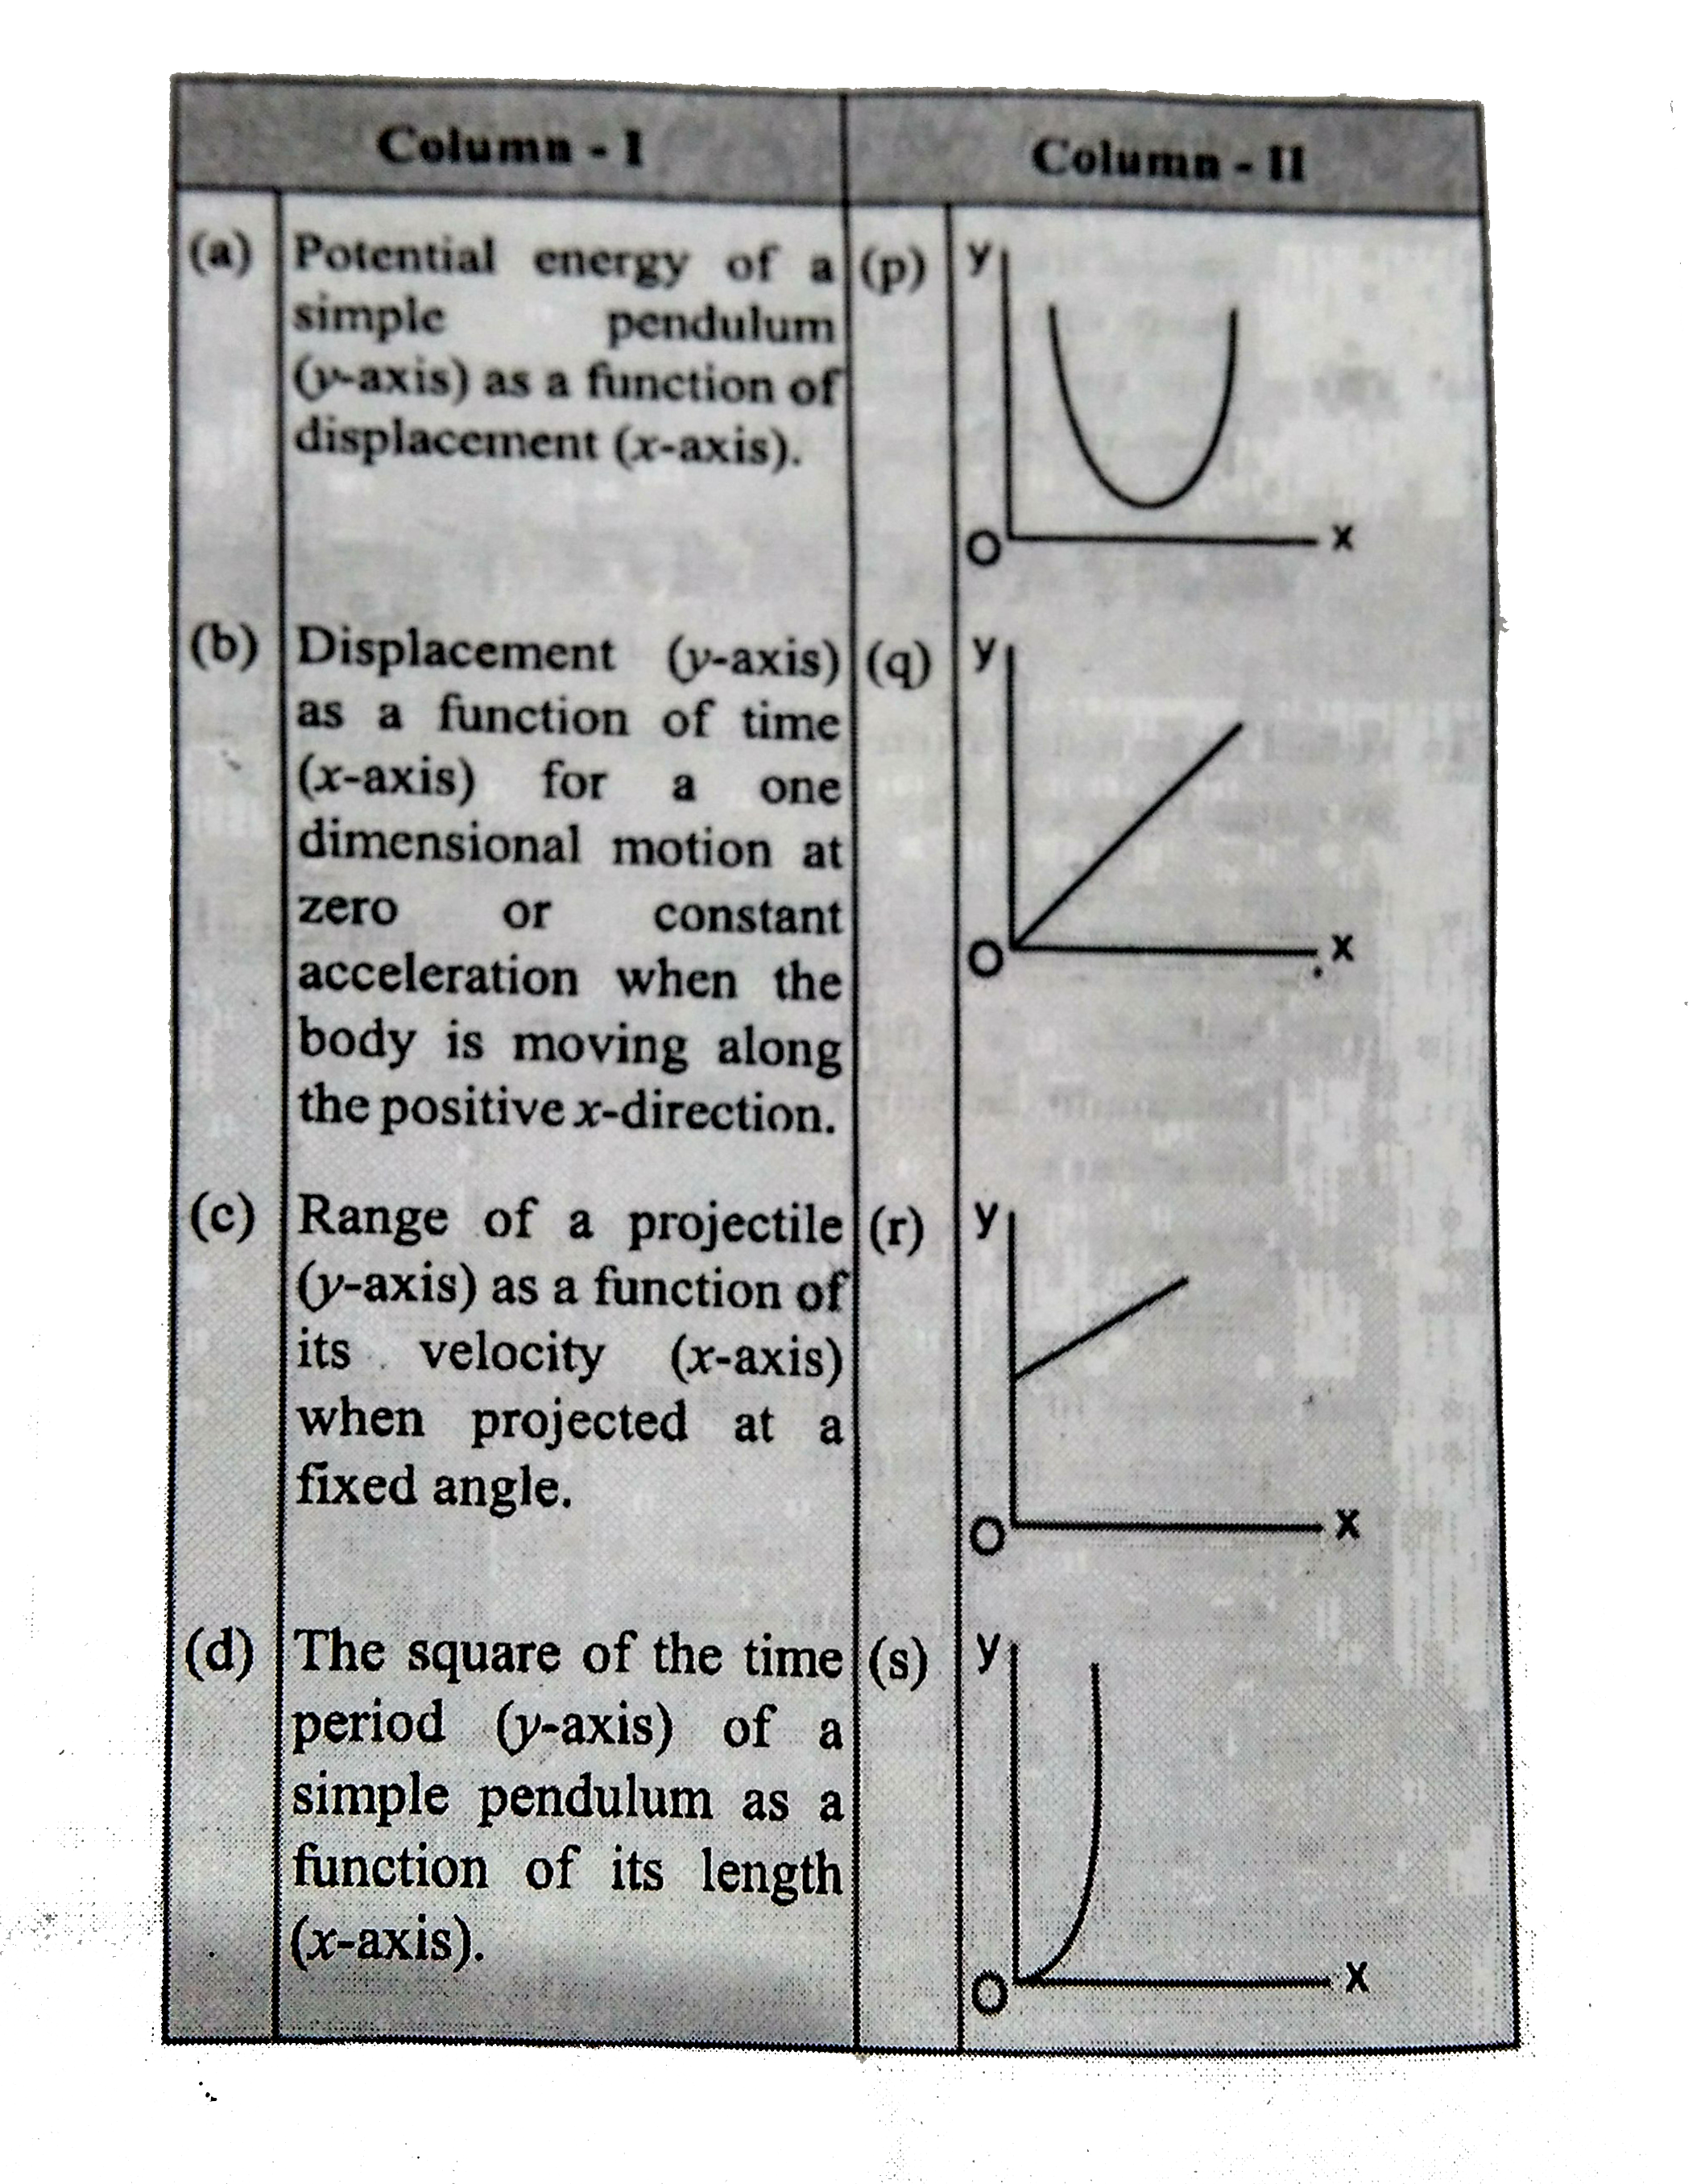
The correct Answer is:a→p,s;b→q,s;c→s;d→q
Topper's Solved these Questions
Similar Questions
Column I gives a listof possible set of parameters measured in some experiments. The variations of the parameters in the form of graphs are shown in Column II. Match the set of parameters given in Column I with the graphs even in Column II. Indicate your answer by darkening the appropriate bubbles of the 4×4 matrix given in the ORS.
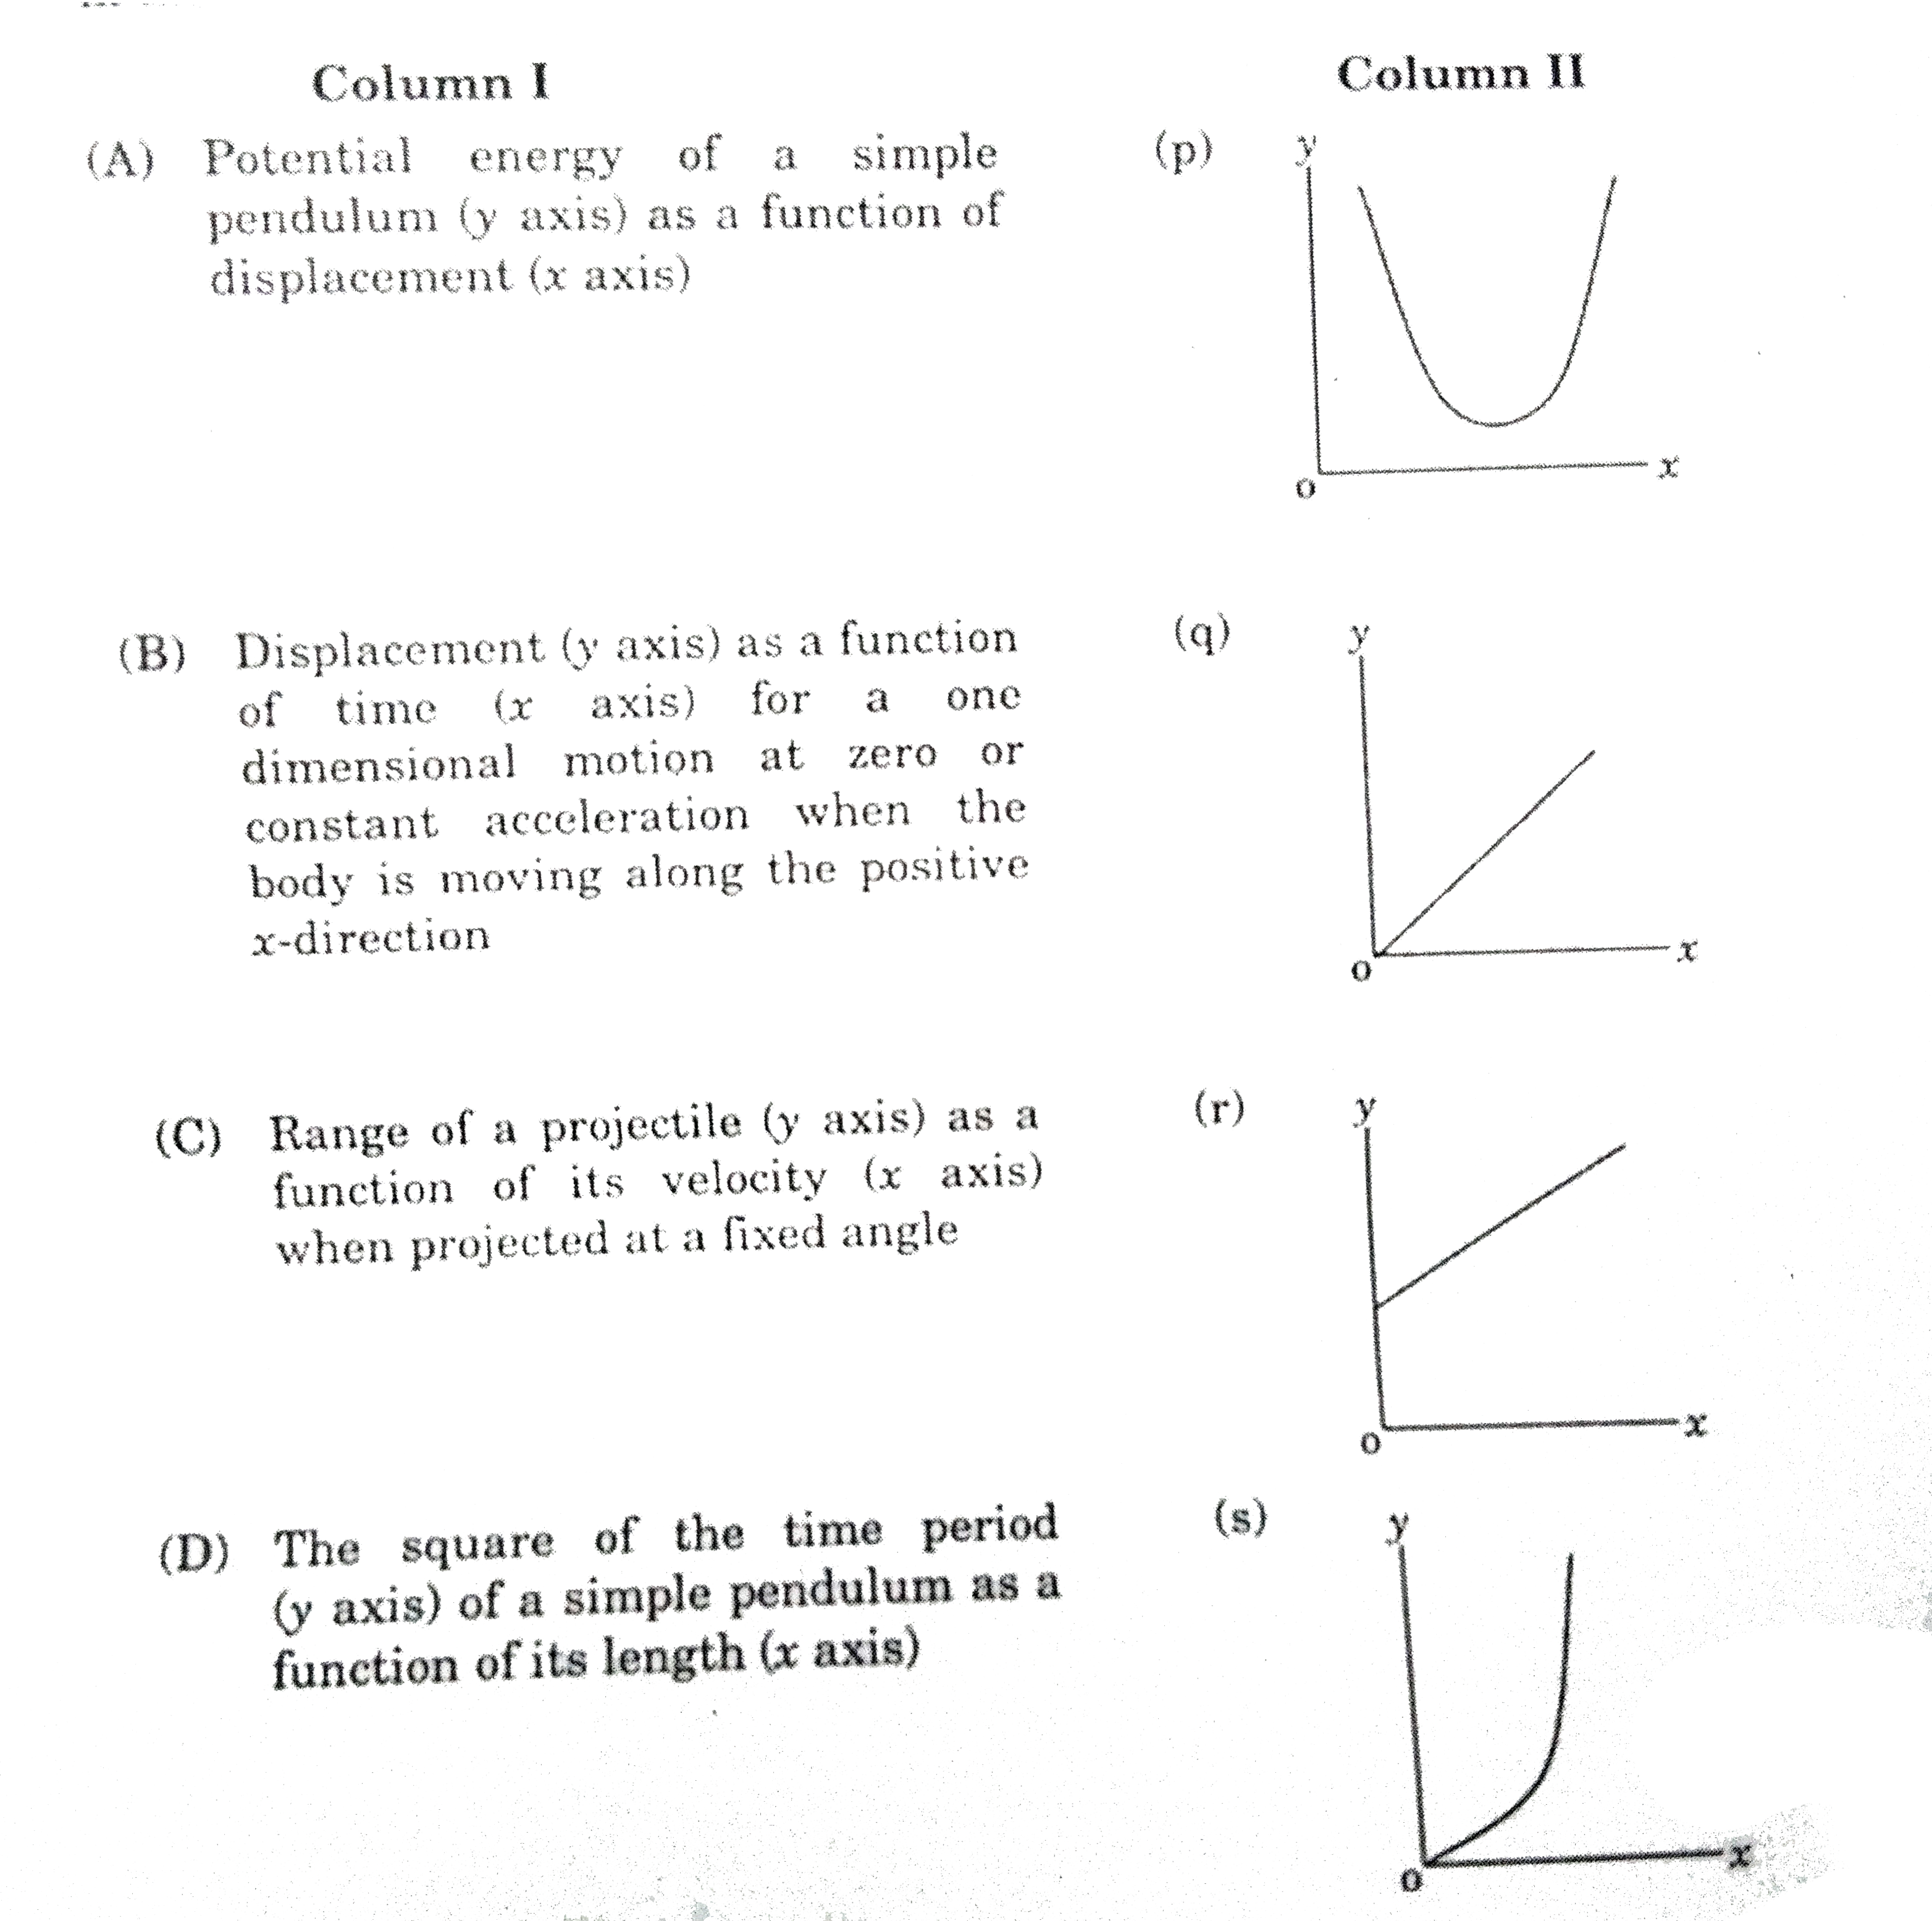
View SolutionColumn I gives a listof possible set of parameters measured in some experiments. The variations of the parameters in the form of graphs are shown in Column II. Match the set of parameters given in Column I with the graphs even in Column II. Indicate your answer by darkening the appropriate bubbles of the 4×4 matrix given in the ORS.

View SolutionColumn A gives a list of possible set of parameters measured in some experiments . The variations of the parameters in the form of graphs are shown in column B.
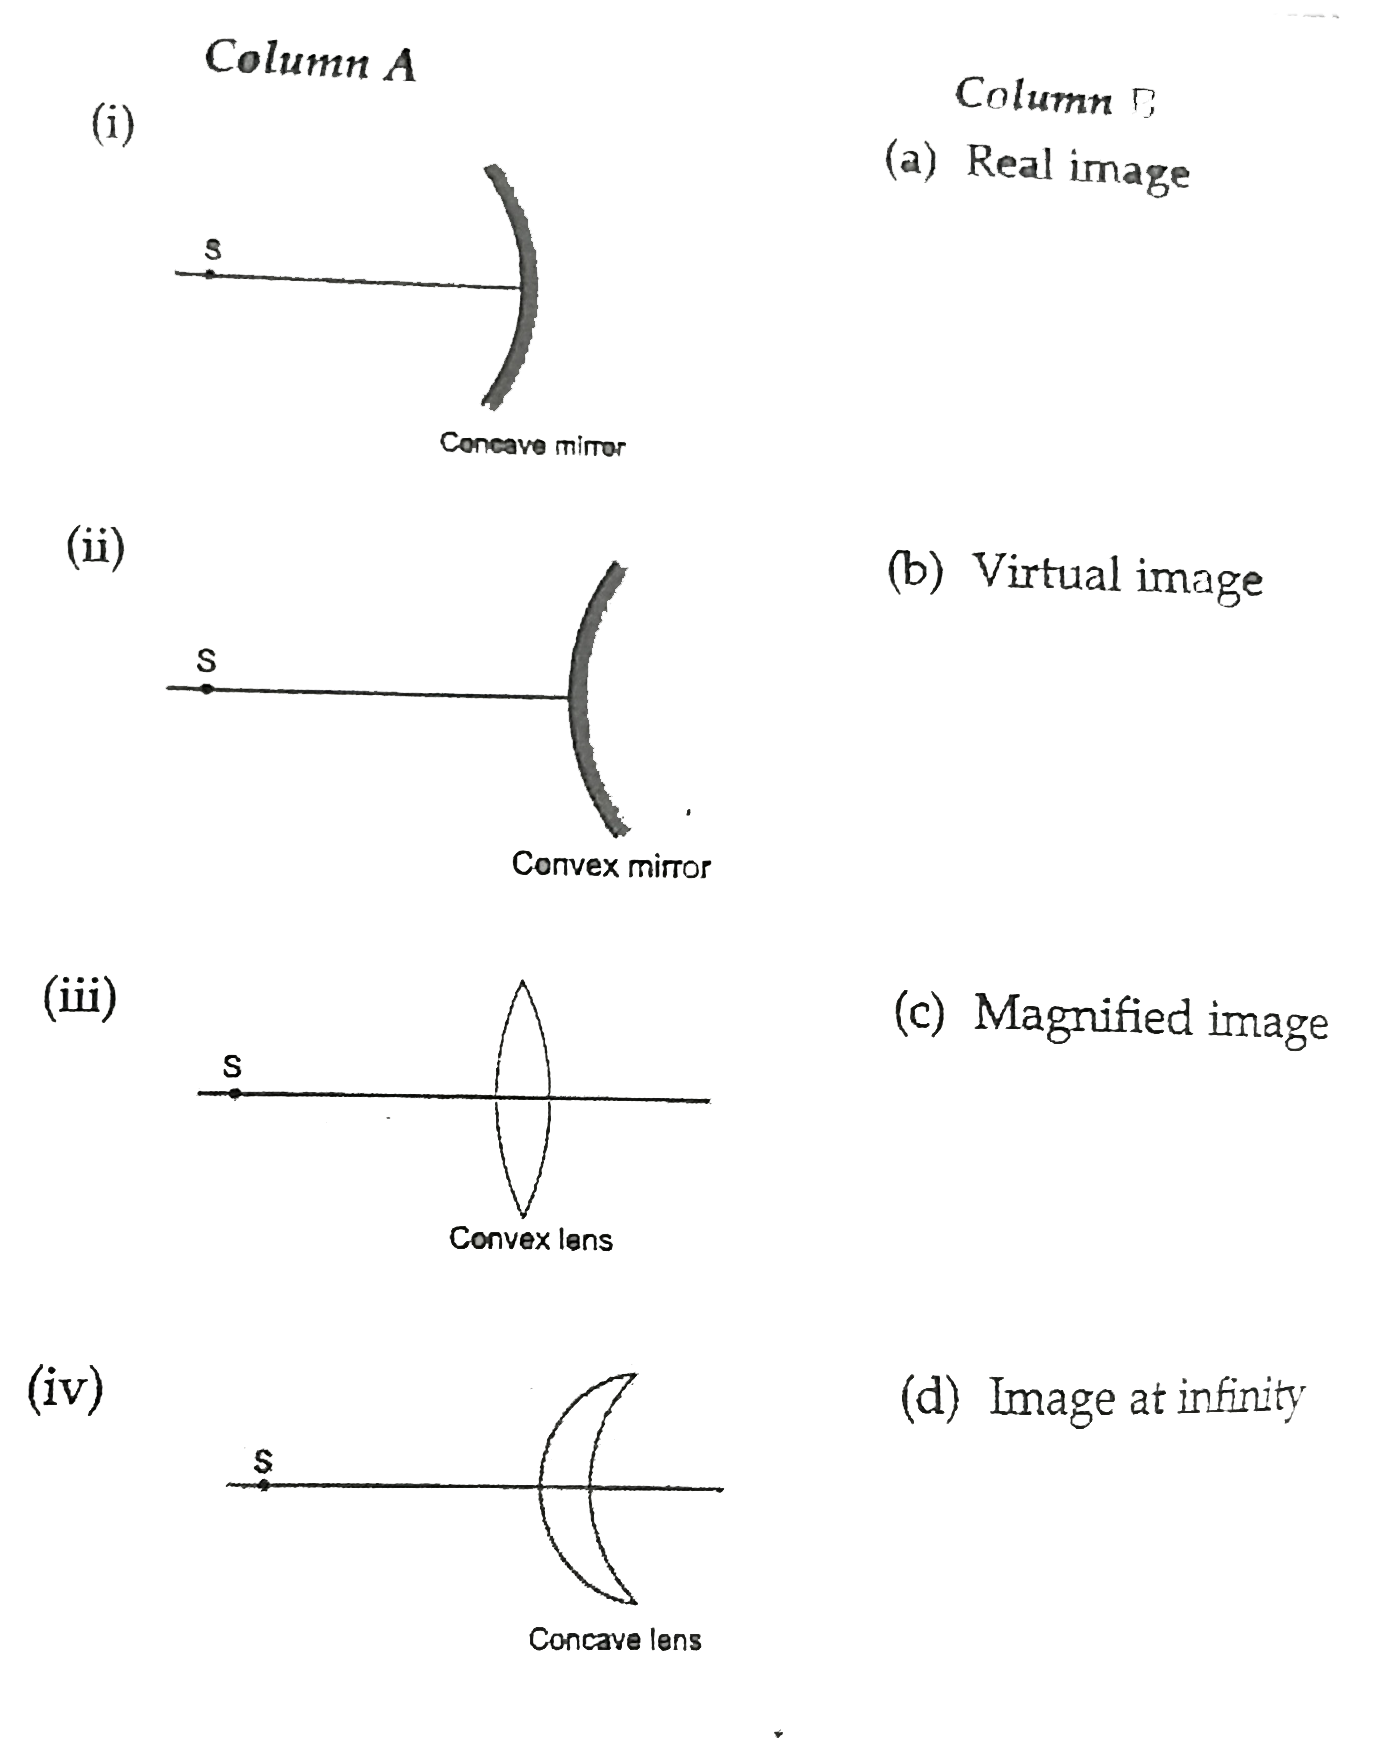
View SolutionColumn A gives a list of possible set of parameters measured in some experiments . The variations of the parameters in the form of graphs are shown in column B.
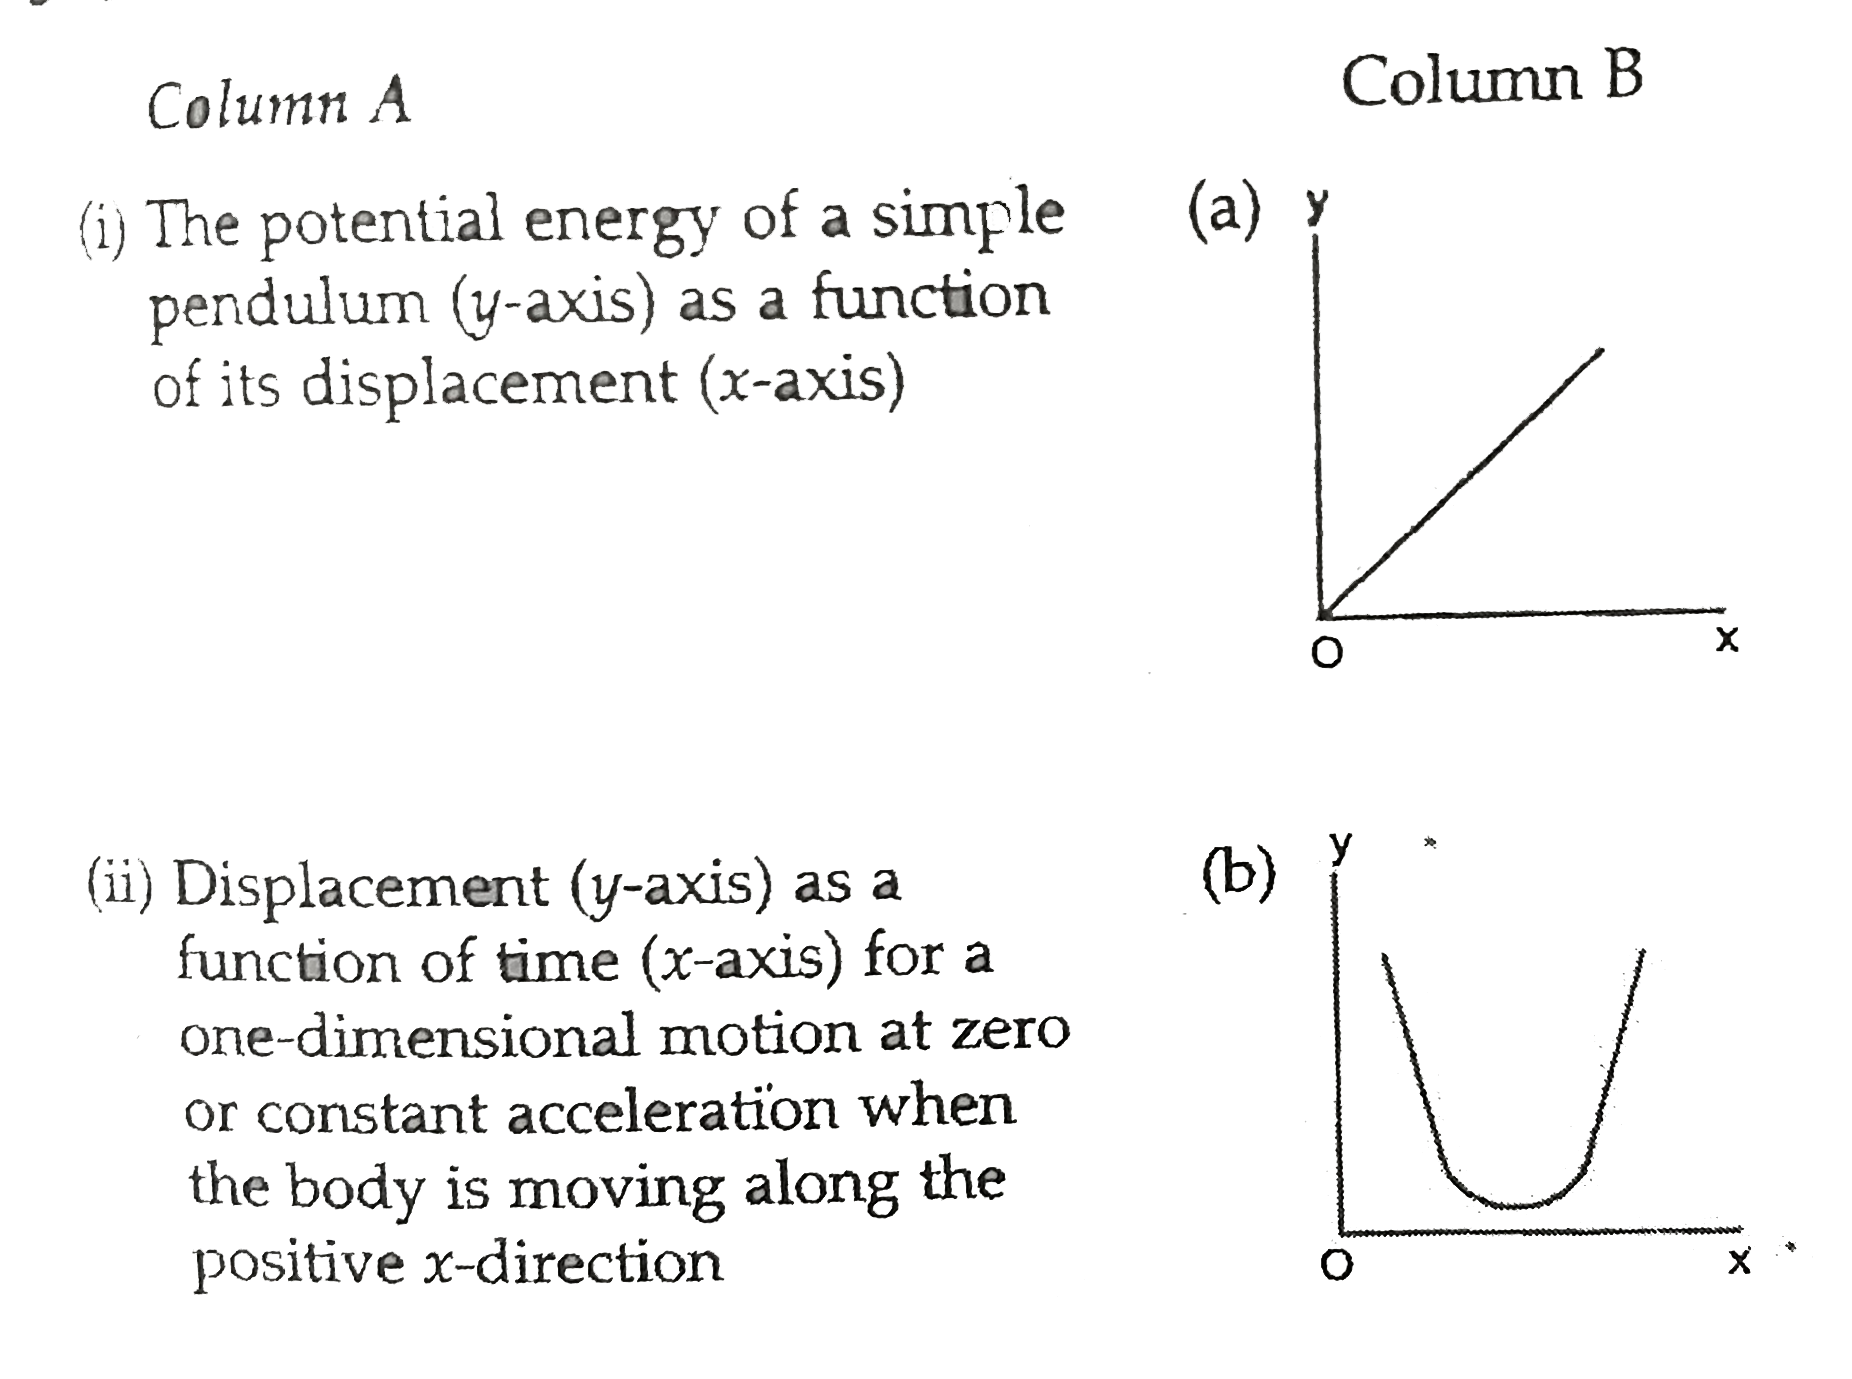
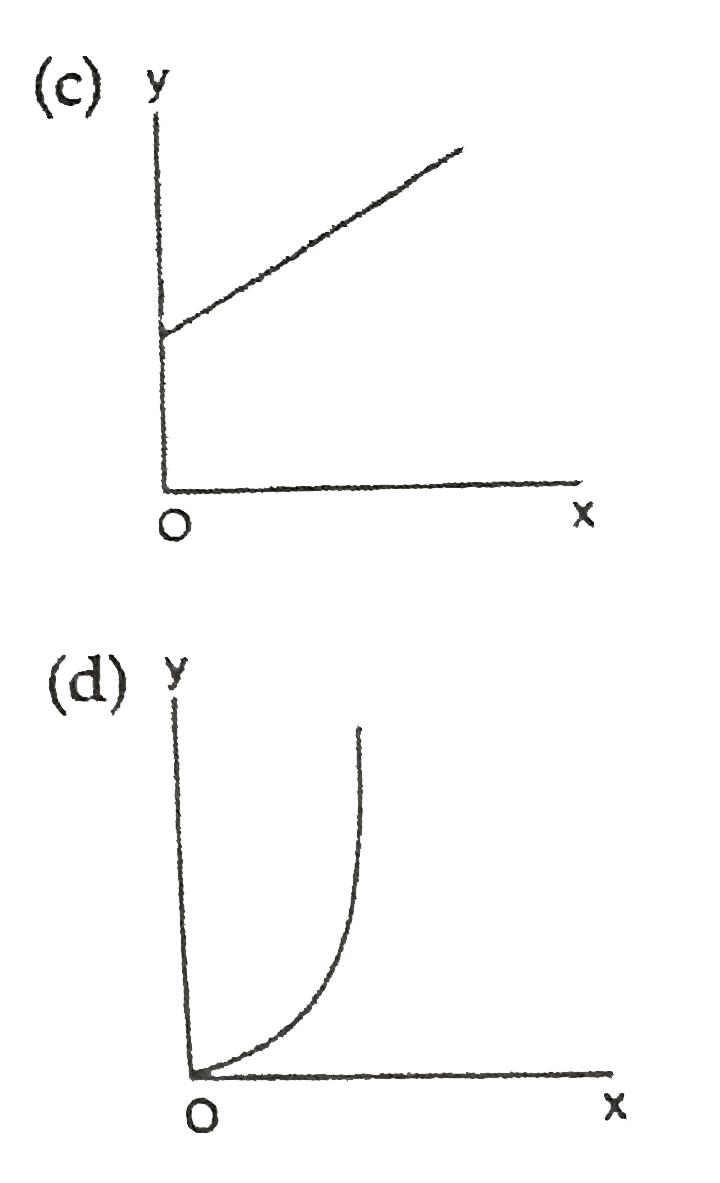
View SolutionColumn I gives a list of possible set of parameters measured in some expermients. The varitions of the parameters in the form of graphs ar shown in Column II. Match the set of parameters given Column I with the graph given in Column II. Indicate your answer by darking the appropriate bubbles of the 4×4 matrix given in the ORS.
_E01_169_Q01.png)
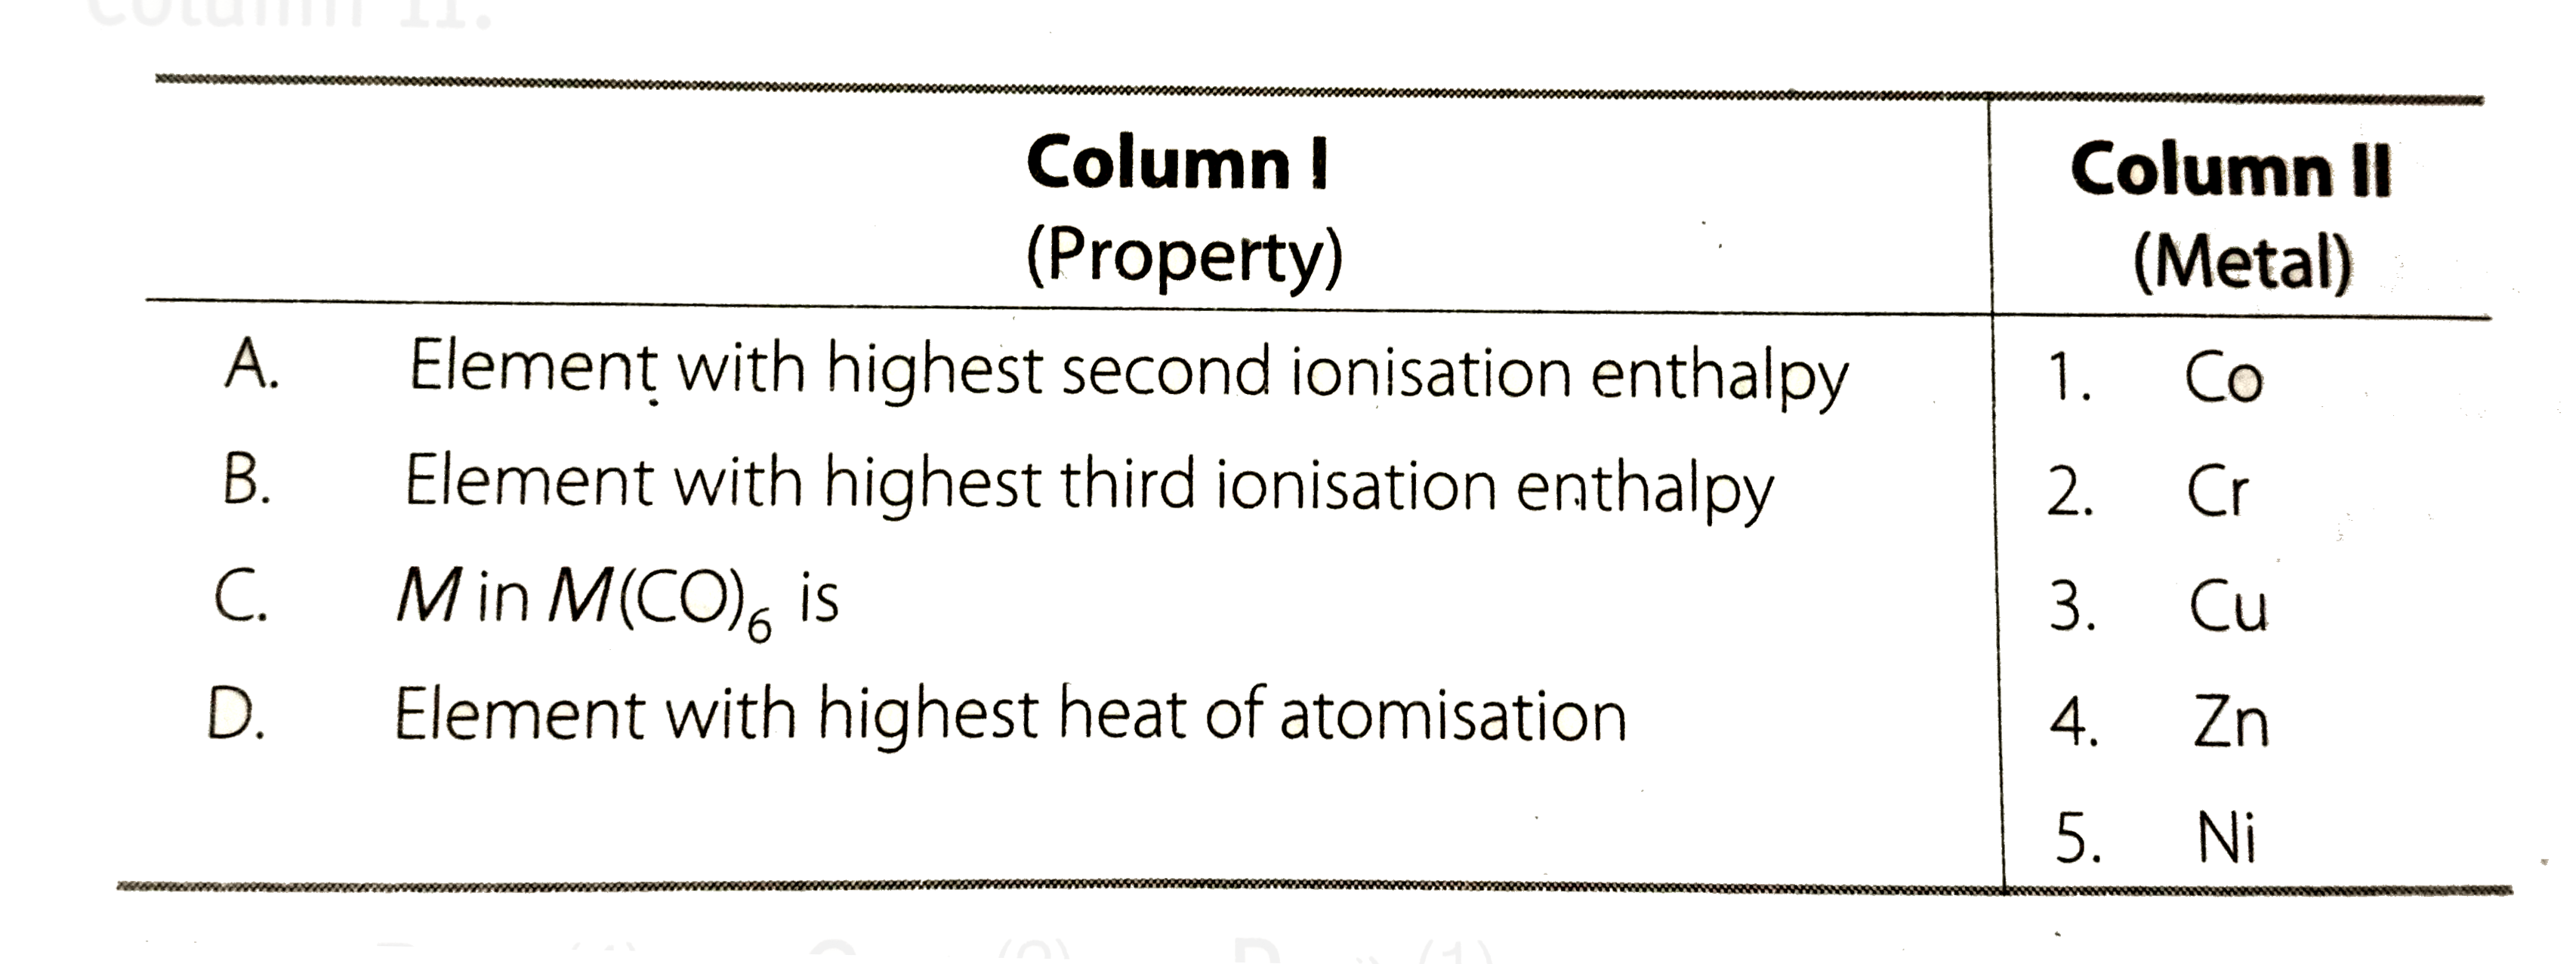
View SolutionMatch the properties given in Column I with the metals given in Column II.
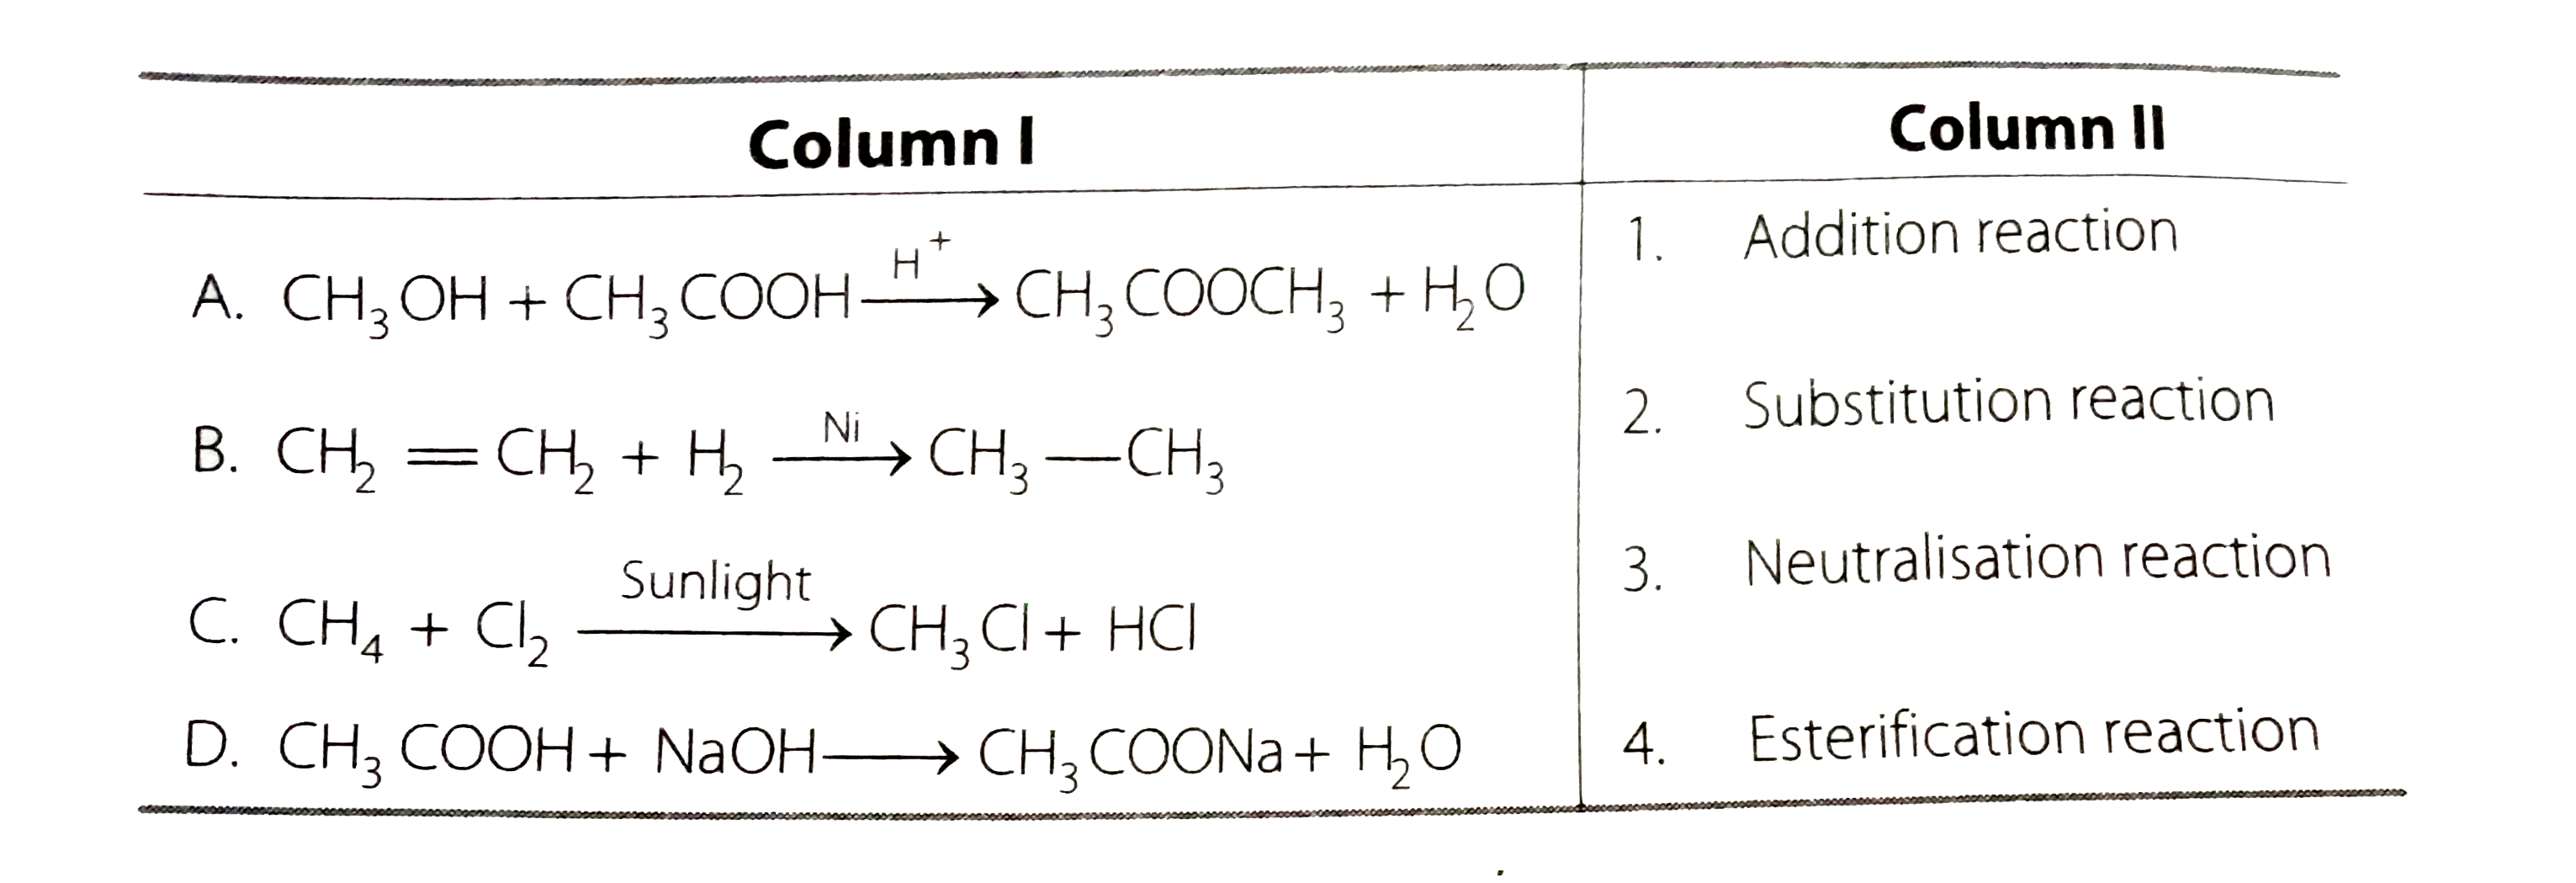
View SolutionMatch the reactions given in Column I with the names given in Column II.
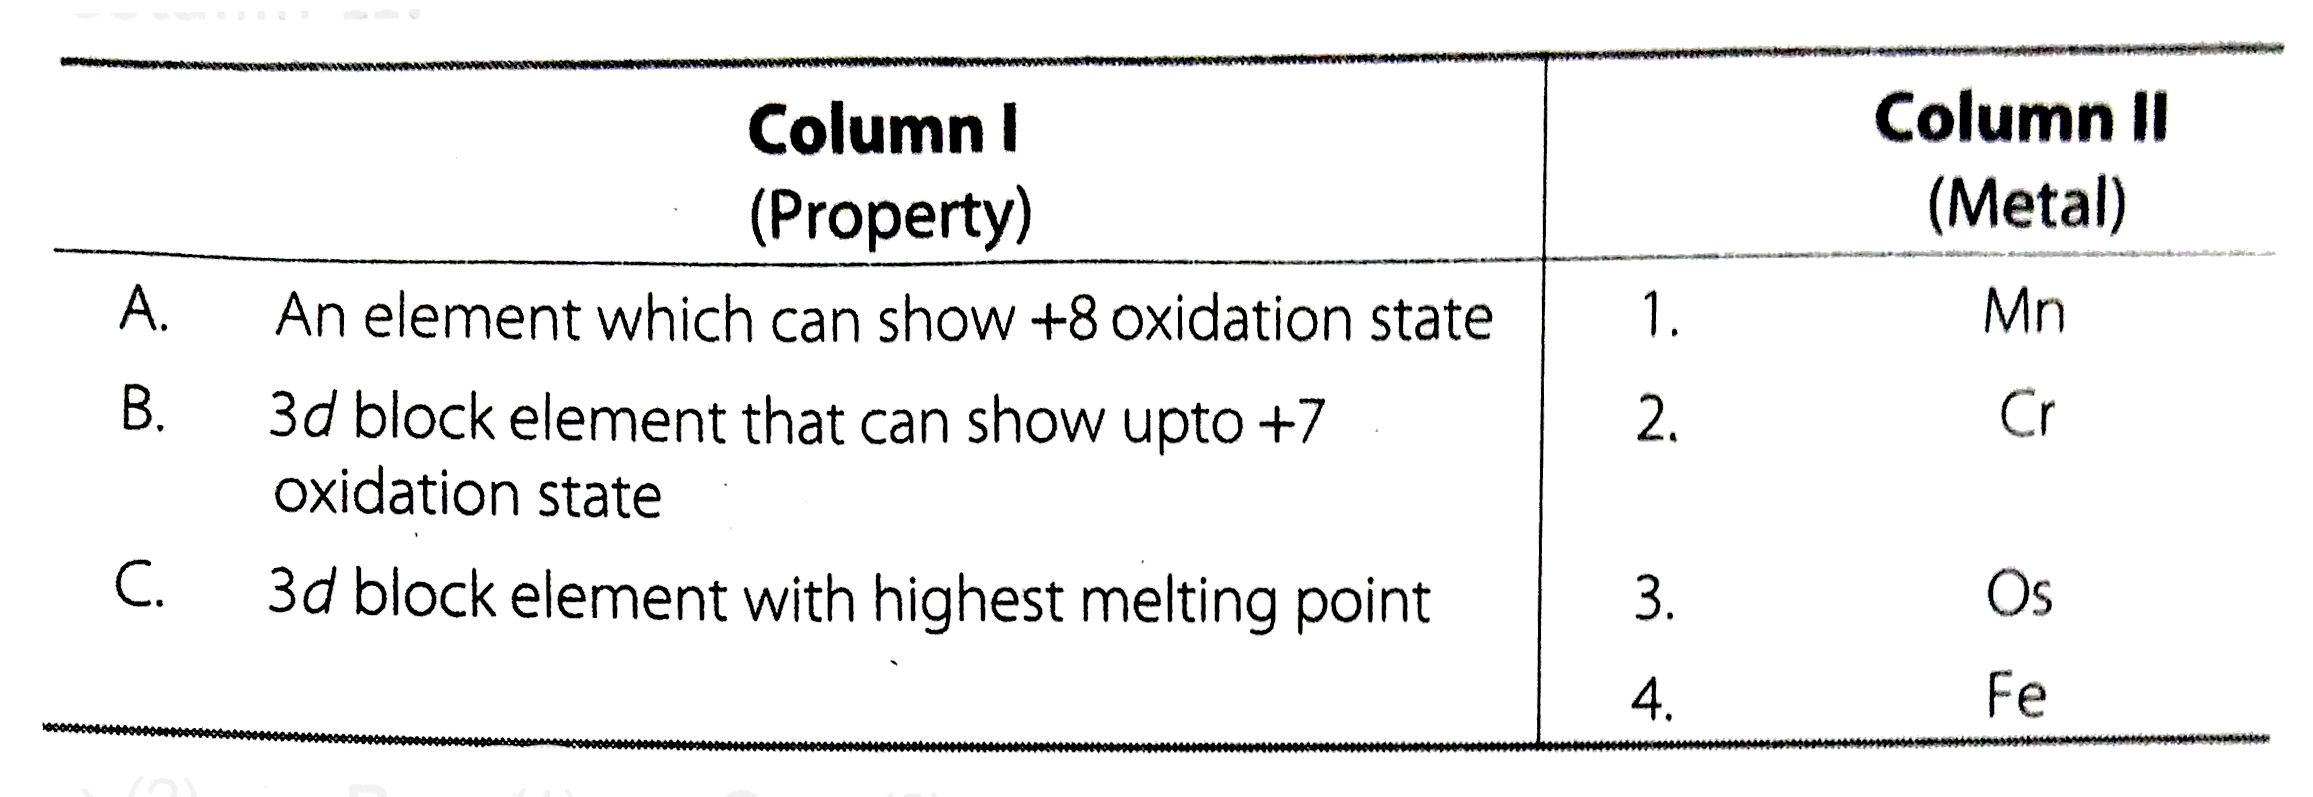
View SolutionMatch the properties given in Column I with the metals given in Column II
View SolutionMatch the type of packing given in column I with the iterms given in column II.
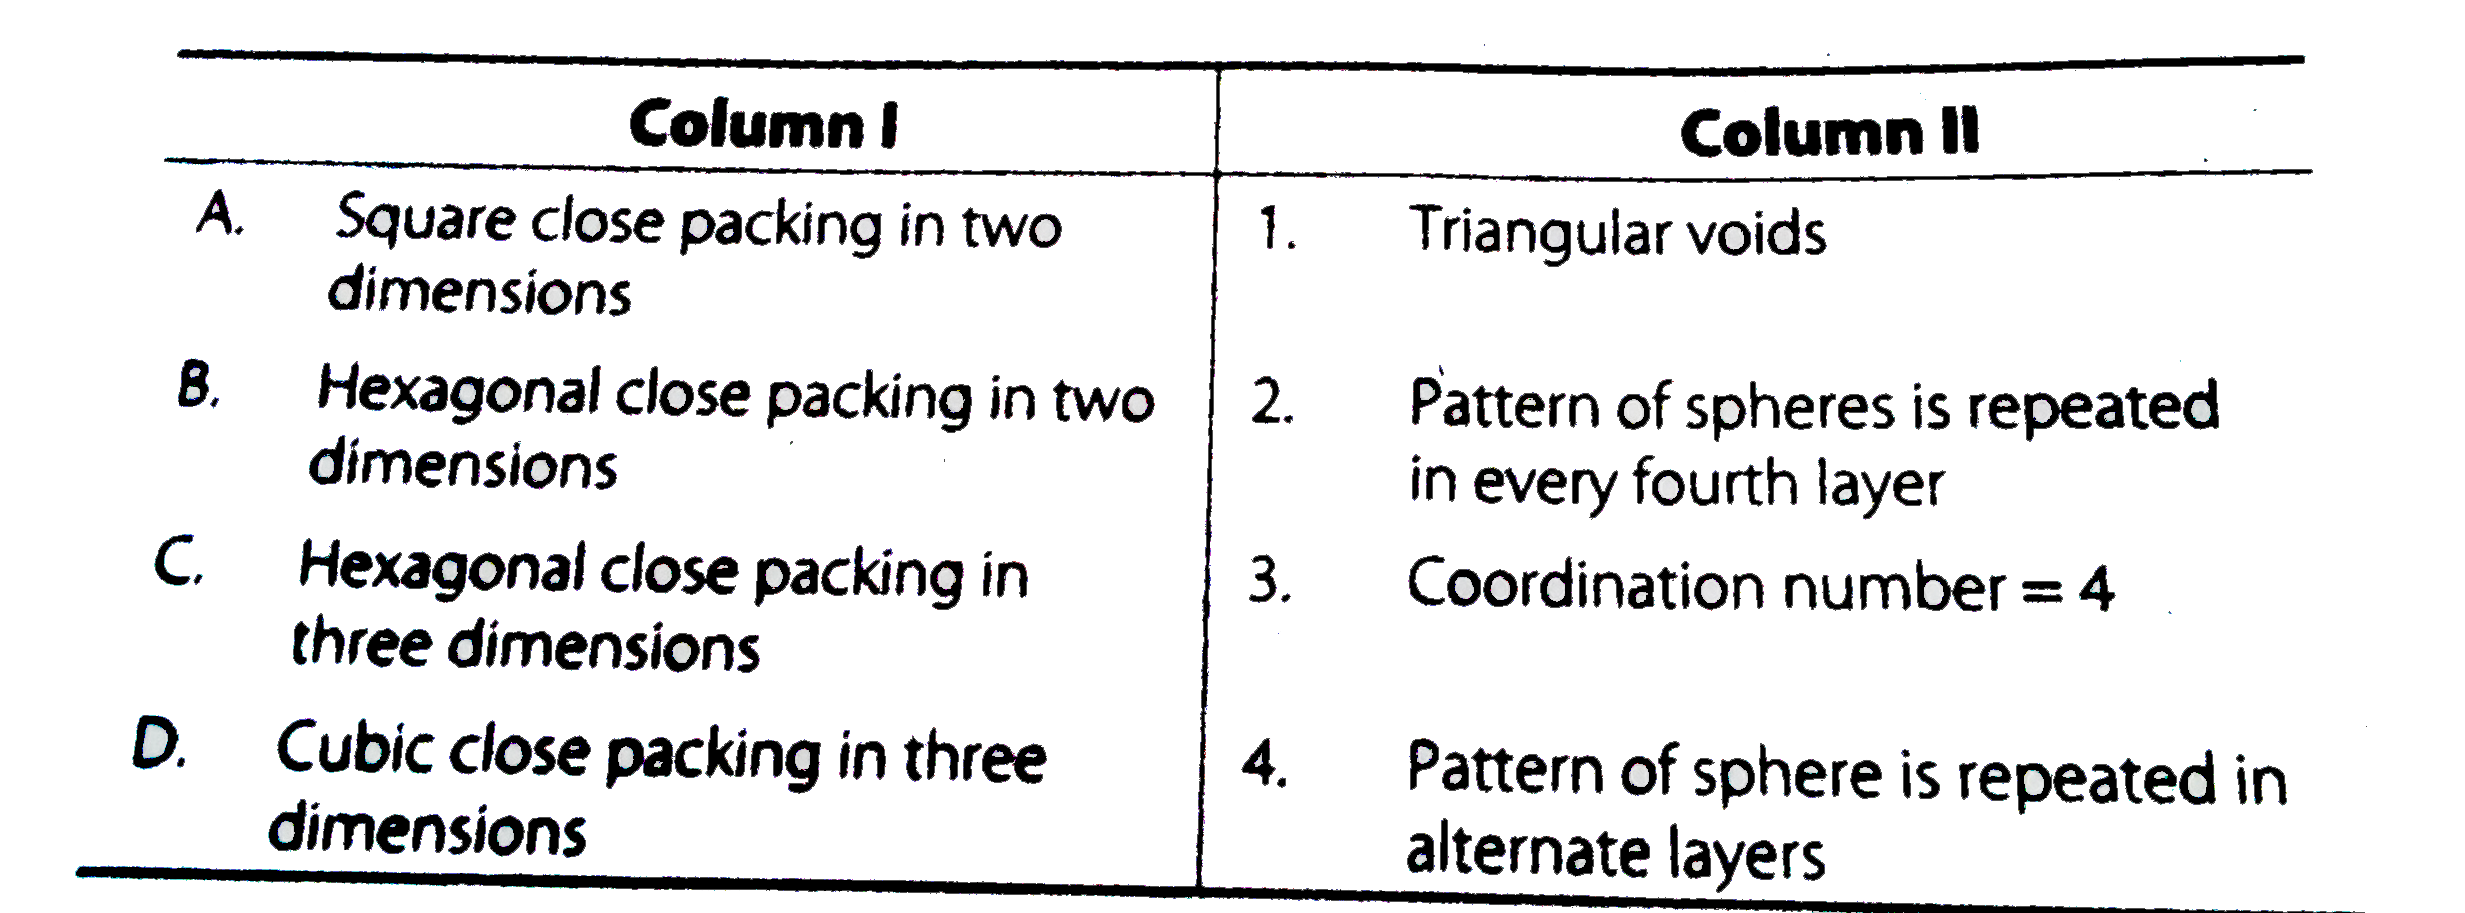
View SolutionMatch the type of packing given in column I with the iterms given in column II.

View Solution
