Liquid oxygen at 50K is heated to 300K at constant pressure of 1atm. The rate of heating is constant. Which of the following graphs represents the variation of temperature with time?
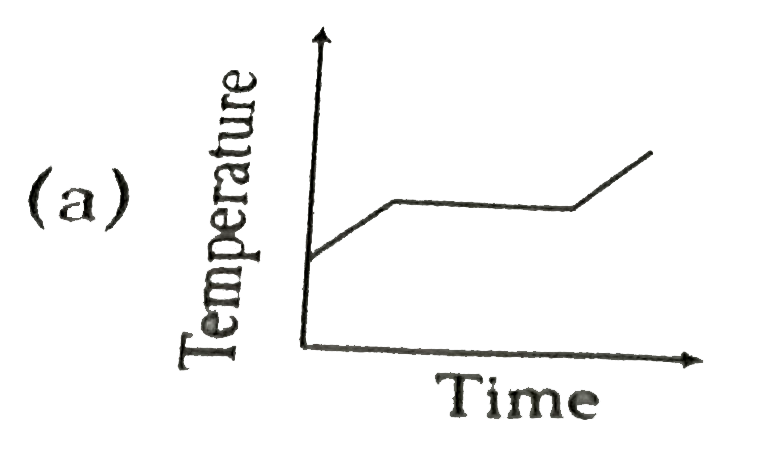

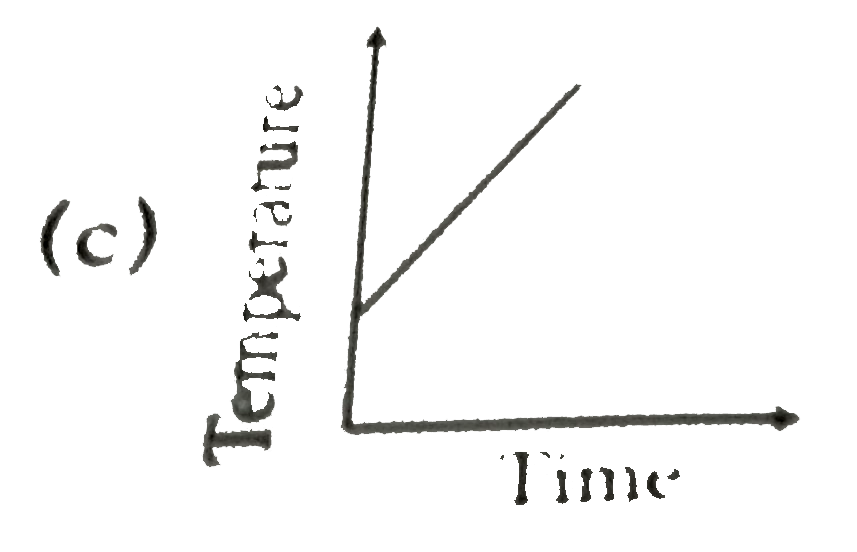

The correct Answer is:A
Graph a) shows the variation of temperature with time. At first, temperature will increase, then there will be state change from liquid to gas.
Topper's Solved these Questions
- CALORIMETRY AND HEAT TRANSFERBOOK - DC PANDEY ENGLISHCHAPTER - CALORIMETRY AND HEAT TRANSFEREXERCISE - Match the columns
4 Videos
- CALORIMETRY & HEAT TRANSFERBOOK - DC PANDEY ENGLISHCHAPTER - CALORIMETRY & HEAT TRANSFEREXERCISE - Level 2 Subjective
14 Videos
- CENTRE OF MASSBOOK - DC PANDEY ENGLISHCHAPTER - CENTRE OF MASSEXERCISE - Medical entrances gallery
27 Videos
Similar Questions
A body moves from rest with a constant acceleration. Which one of the following graphs represents the variation of its kinetic energy K with the distance travelled x?
View SolutionA body moves from rest with a constant acceleration. Which one of the following graphs represents the variation of its kinetic energy K with the distance travelled x?
View Solution
Knowledge Check
Which one of the following graphs represents variation of specific heat capacity of water with temperature?
A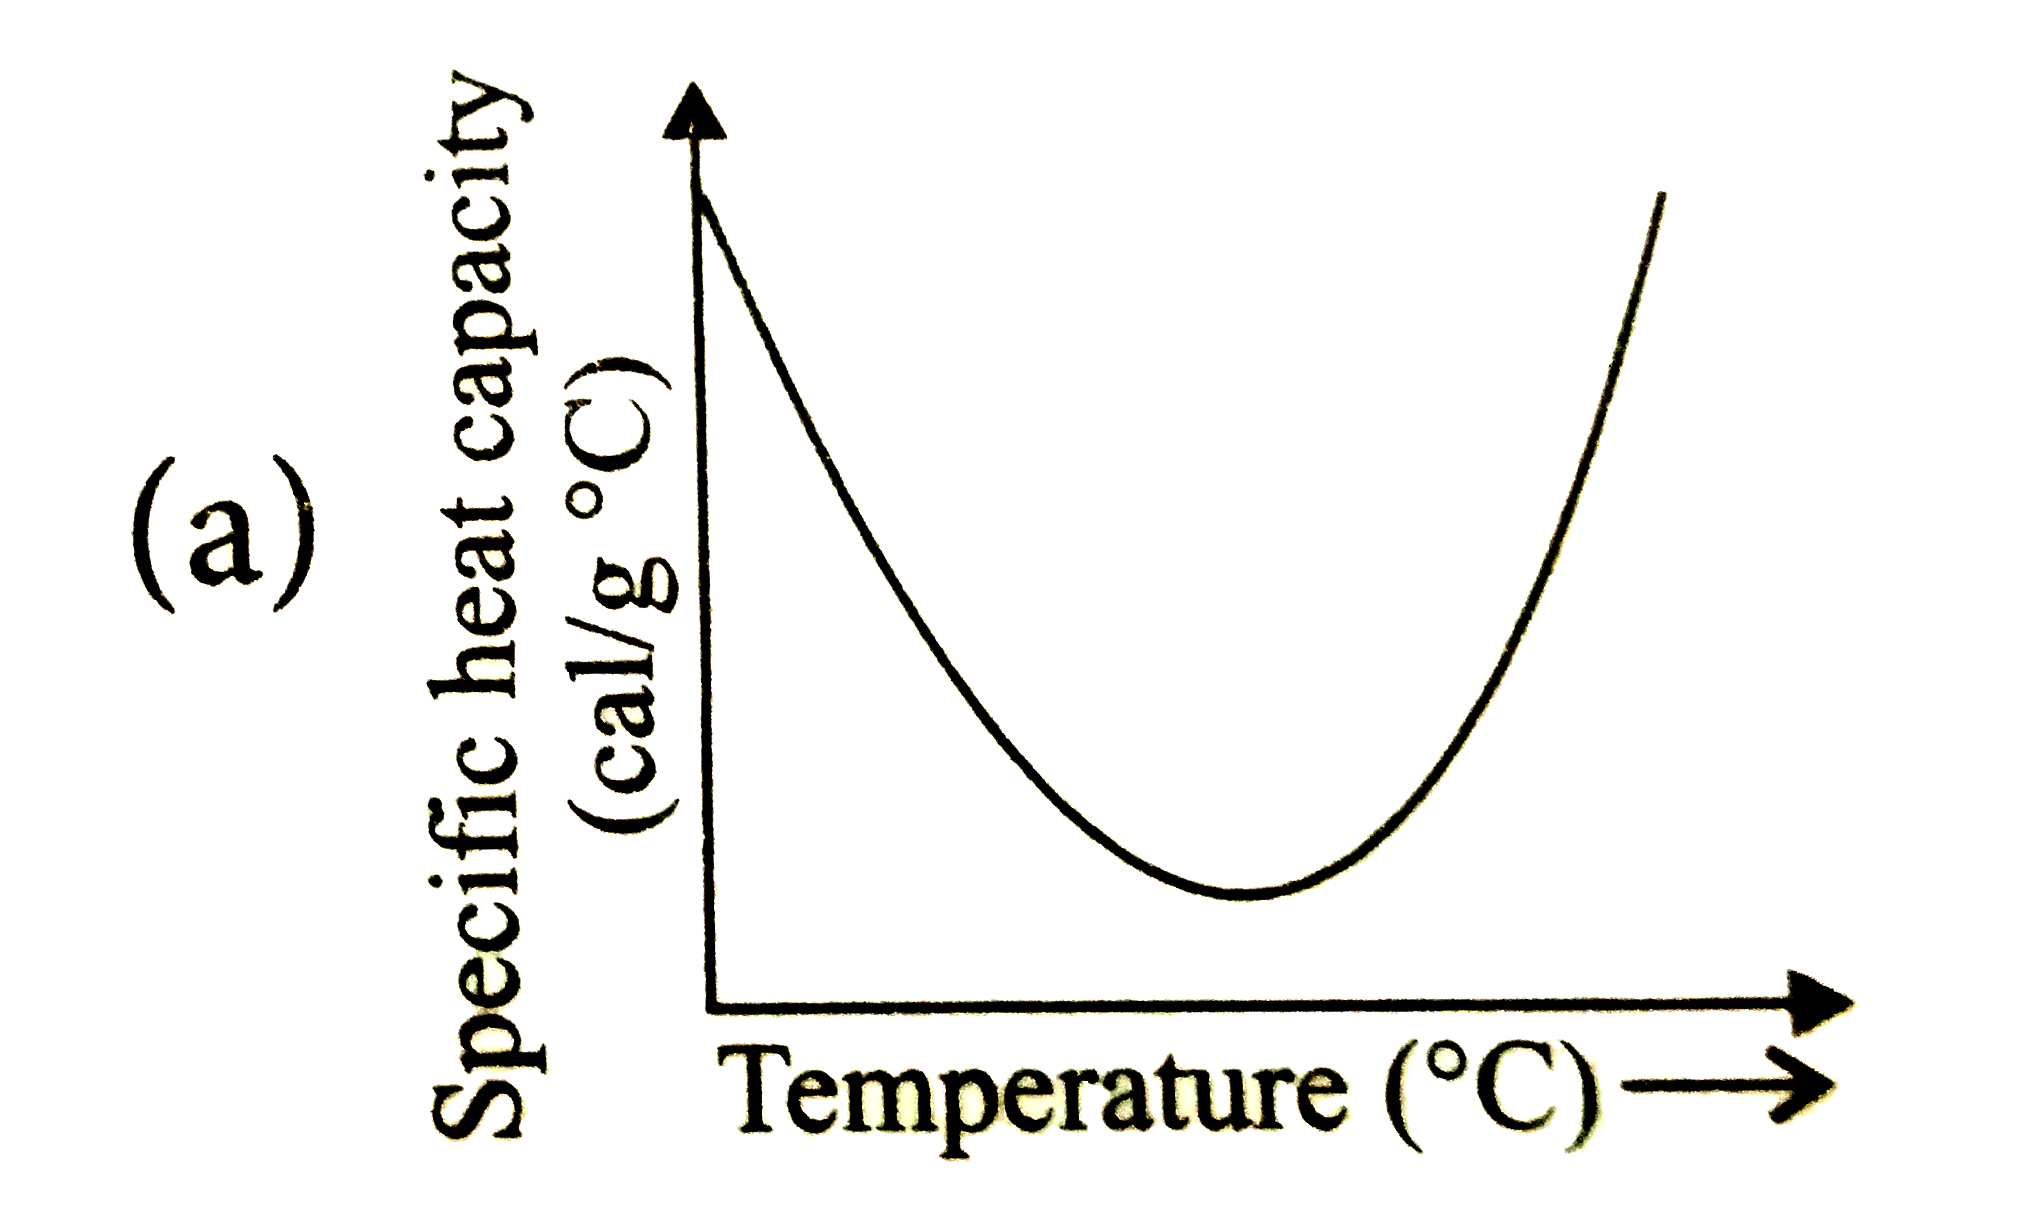 B
B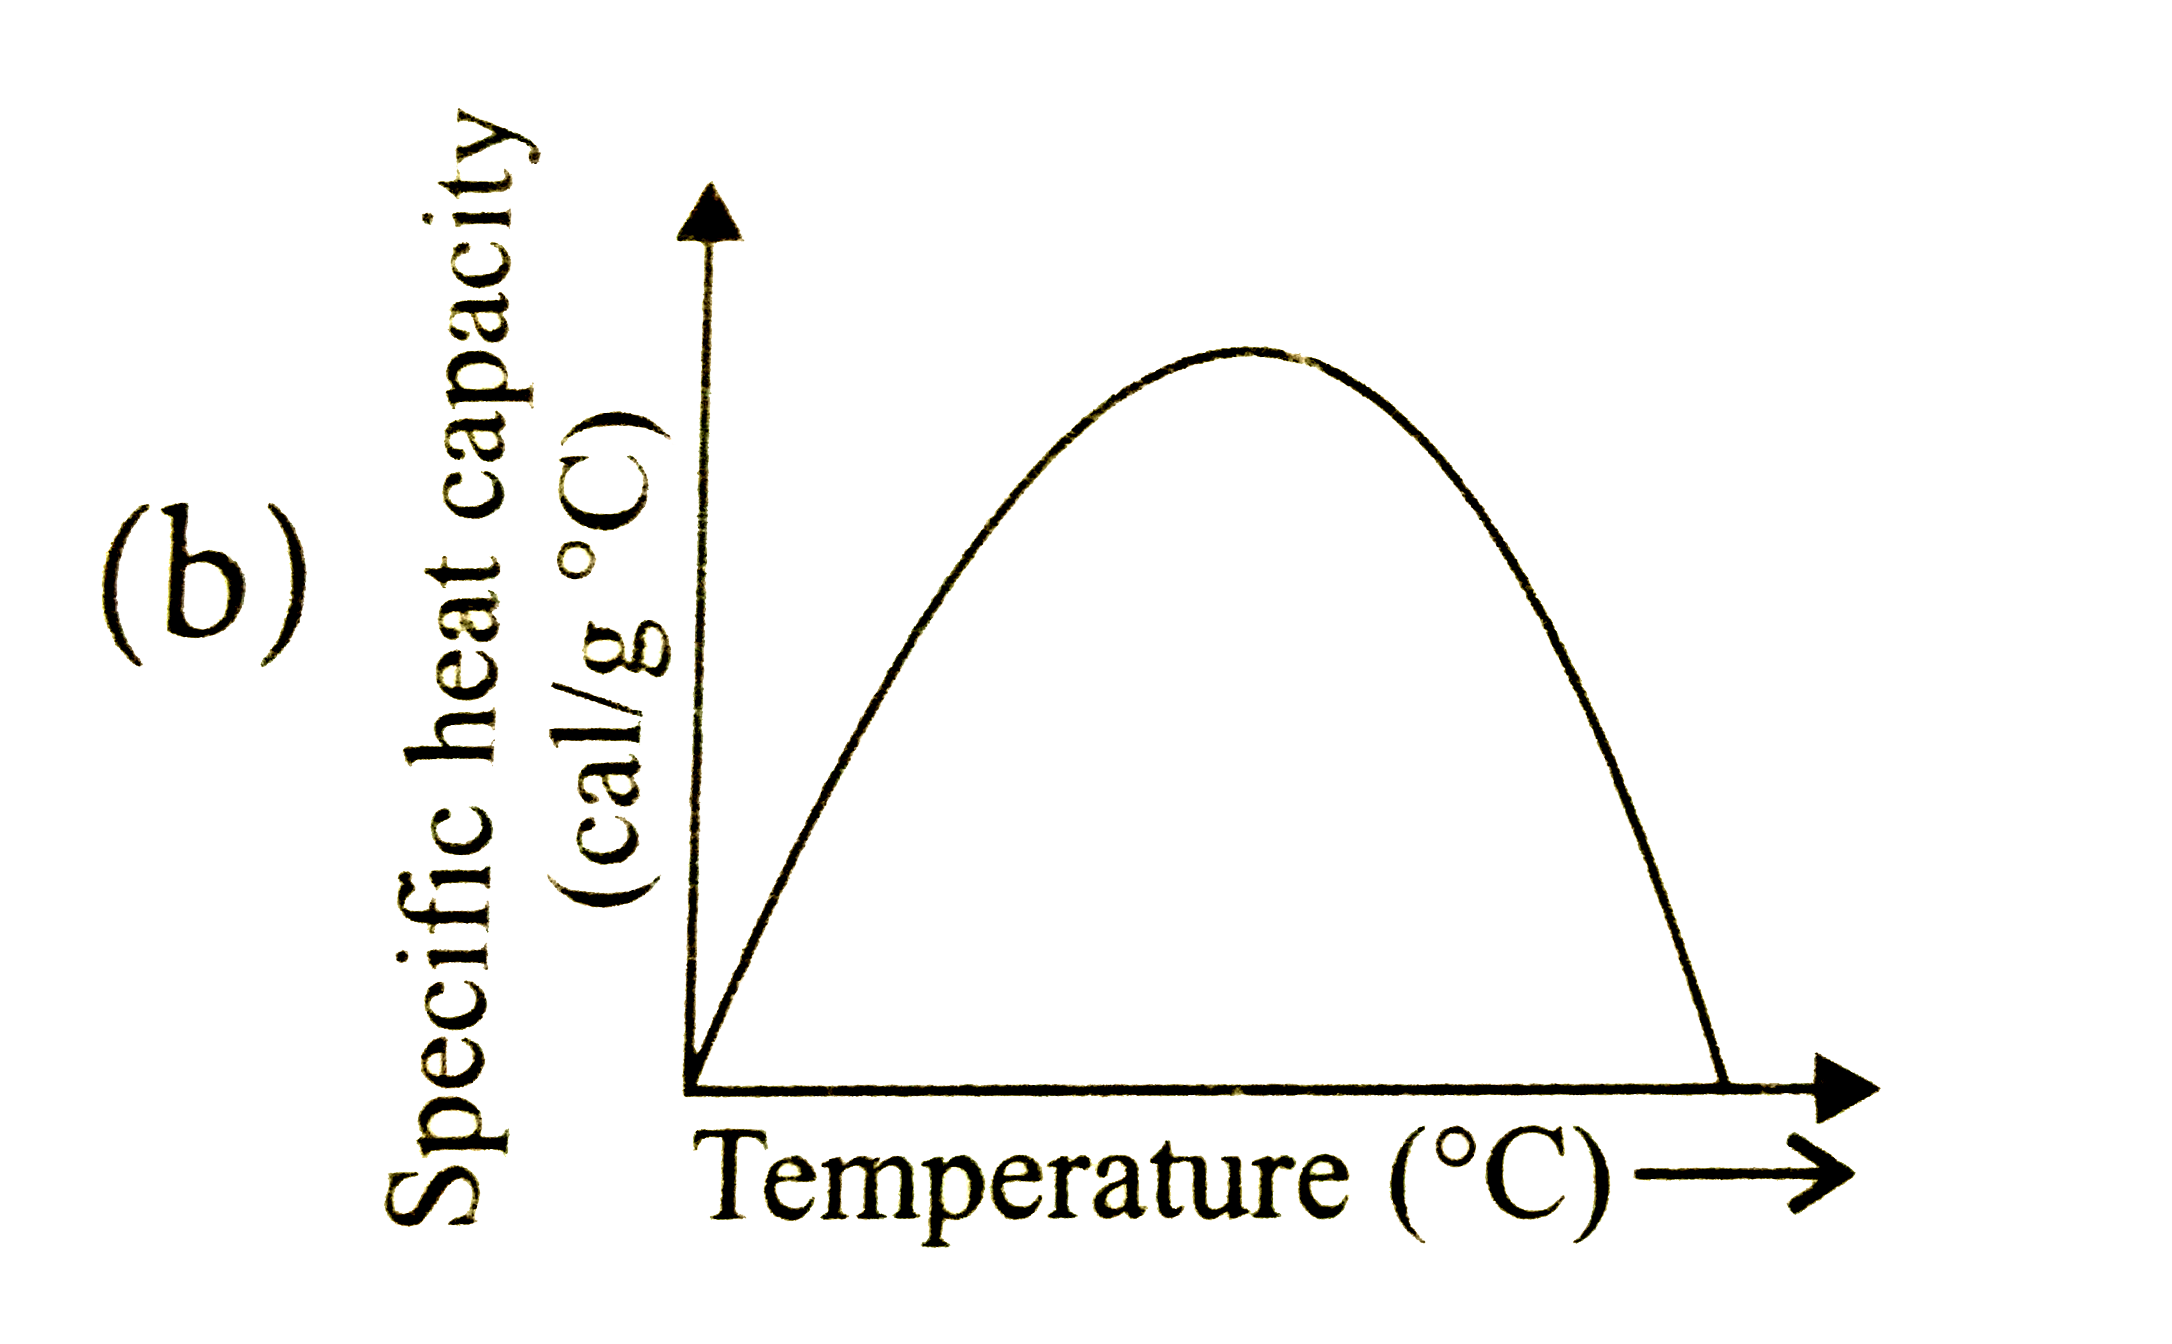 C
C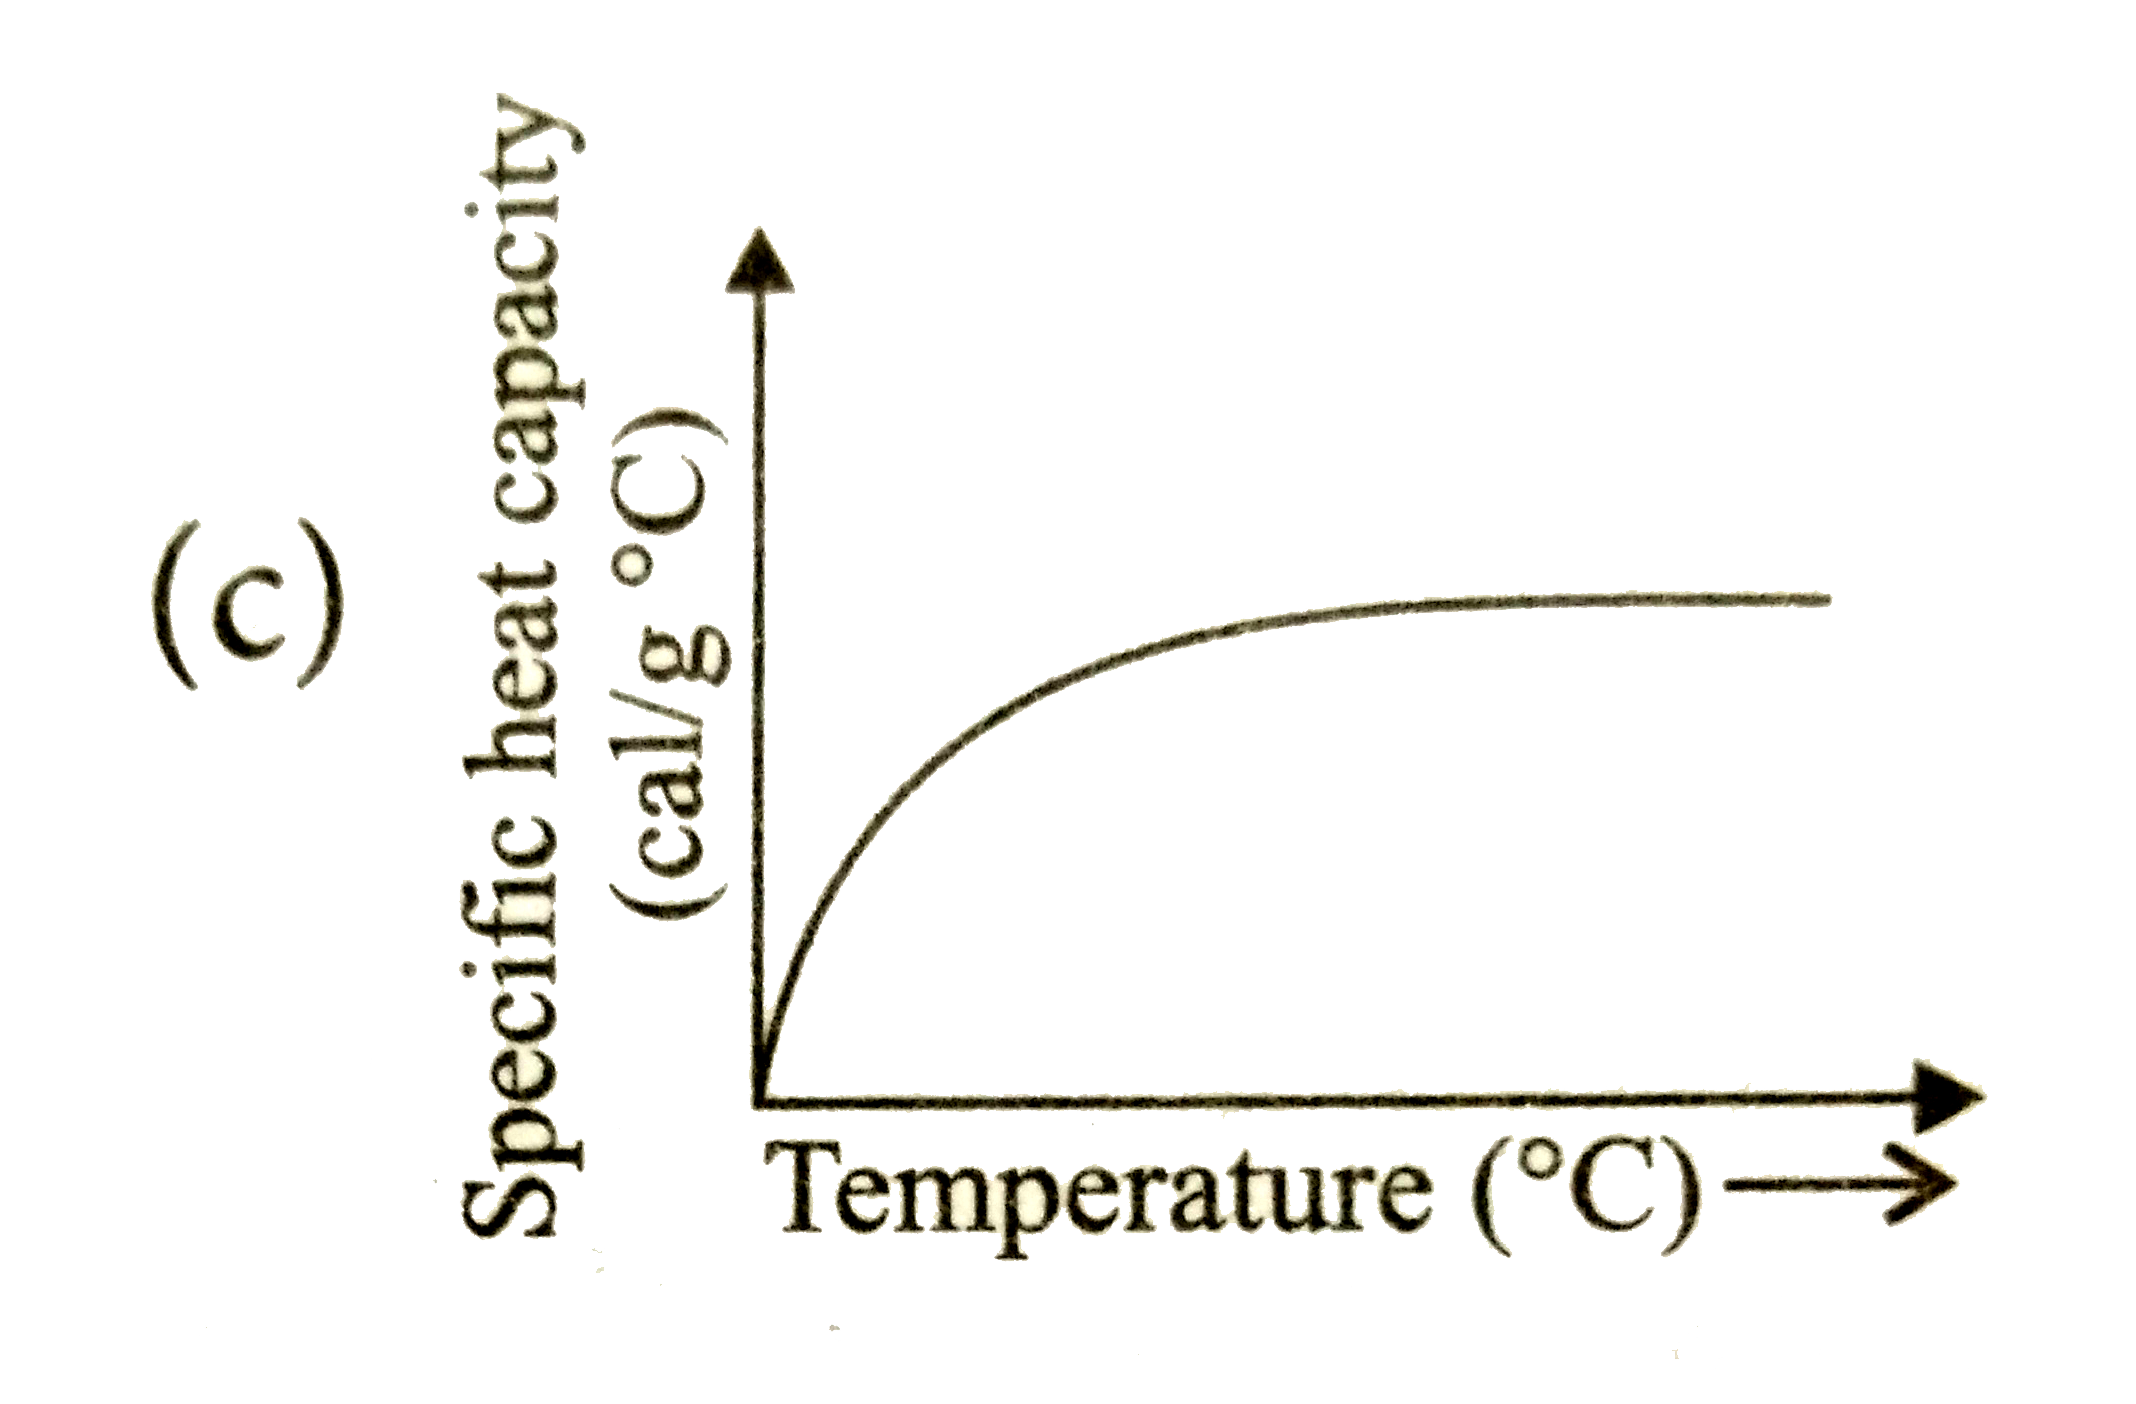 D
D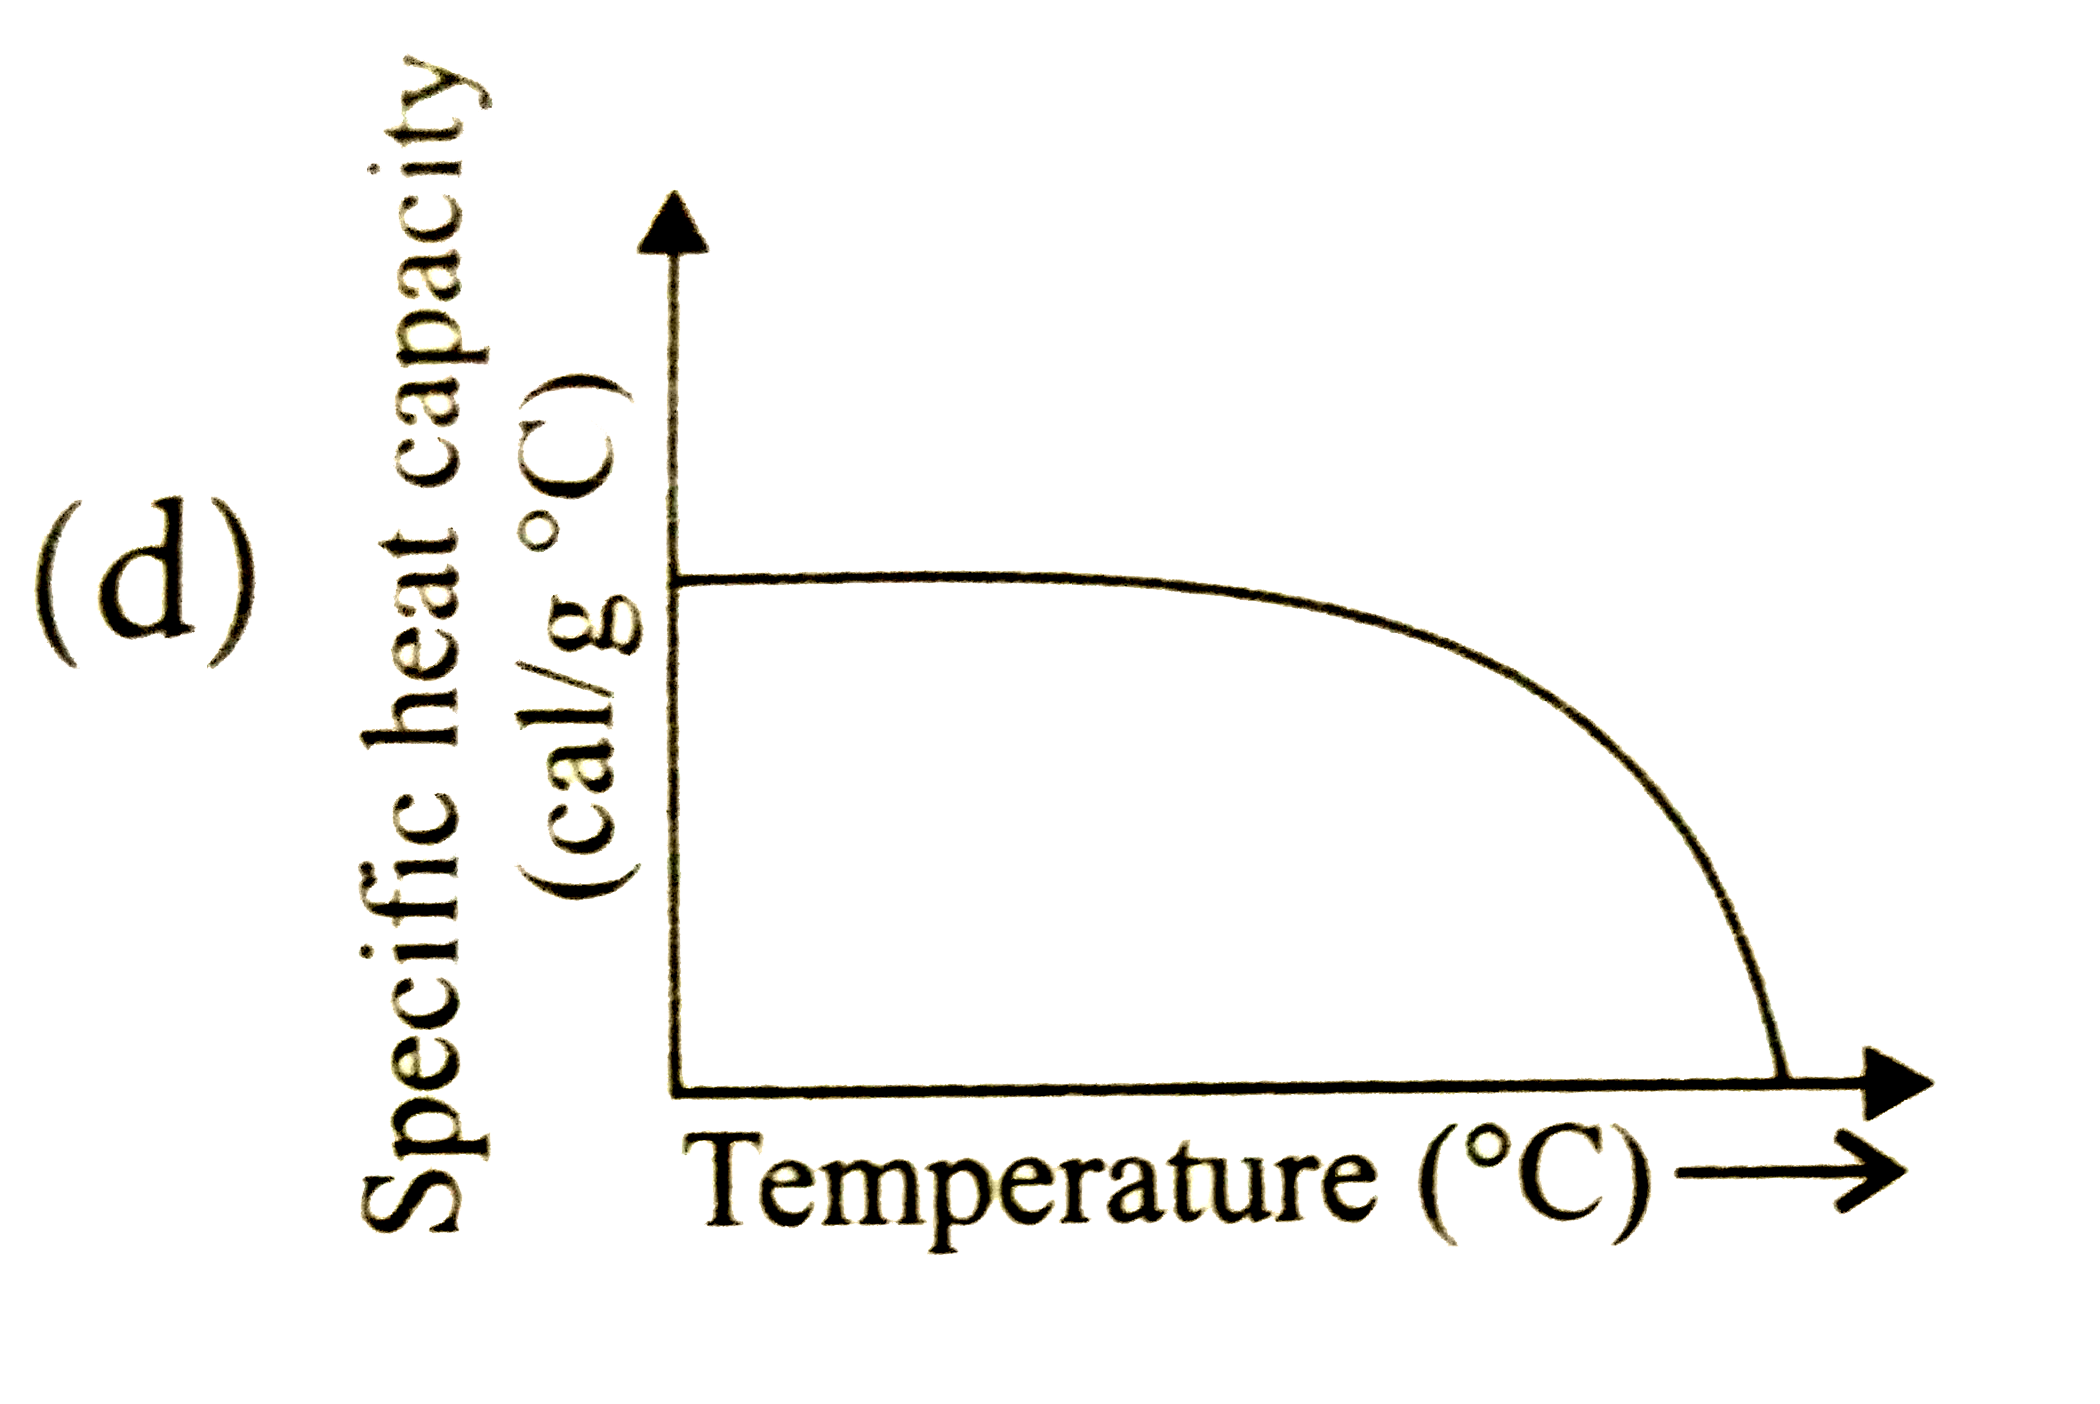
300 ml of a gas at 300 K is cooled to 276 K at constant pressure. The final volume is
View SolutionIf heat energy is given to an ideal gas at constant pressure, then select the graph which best represents the variation of VT with temperature (T).
View SolutionThe temperature of 5 moles of a gas is decreased by 2K at constant pressure of 1 atm. Indicate the correct statement
View Solution450mL of oxygen gas at 20∘C is heated to 50∘C. What is the new volume of the gas at constant pressure?
View SolutionOne mole of an ideal monoatomic gas requires 207 J heat to raise the temperature by 10 K when heated at constant pressure. If the same gas is heated at constant volume to raise the temperature by the same 10 K, the heat required is [Given the gas constant R = 8.3 J/ mol. K]
View SolutionA piece of ice is heated at a constant rate. The variation in temperature with time of heating is shown in the graph in Fig. 11.6.
(i) What is represented by the part AB ?
(ii) What does the part CD represent ?
(iii) What conclusion do you draw regarding the nature of ice from the graph ?
View SolutionAccording to Arrhenius equation rate constant K is equal to A e.−Ea/RT . Which of the following options represents the graph of ln K vs 1T?
View Solution
